

Development, Validation and Use of Custom Software
for the Analysis of Pain TrajectoriesThis section is compiled by Frank M. Painter, D.C.
Send all comments or additions to: Frankp@chiro.org


FROM: Sci Rep 2024 (Aug 12); 14 (1): 18719 ~ FULL TEXT
OPEN ACCESS M. R. van Ittersum • A. de Zoete • M. Rubinstein • Al-Madfai
A. Kongsted • P. McCarthy
Chiropractie Groesbeek,
Nijmeegsebaan 32, 6561 KG,
Groesbeek, The Netherlands.
In chronic musculoskeletal conditions, the prognosis tends to be more informative than the diagnosis for the future course of the disease. Many studies have identified clusters of patients who seemingly share similar pain trajectories. In a dataset of low back pain (LBP) patients, pain trajectories have been identified, and distinct trajectory types have been defined, making it possible to create pattern recognition software that can classify patients into respective pain trajectories reflecting their condition. It has been suggested that the classification of pain trajectories may create clinically meaningful subgroups of patients in an otherwise heterogeneous population of patients with LBP. A software tool was created that combined the ability to recognise the pain trajectory of patients with a system that could create subgroups of patients based on their characteristics. This tool is primarily meant for researchers to analyse trends in large heterogeneous datasets without large losses of data. Prospective analysis of pain trajectories is not directly helpful for clinicians. However, the tool might aid in the identification of patient characteristics which have predictive capabilities of the most likely trajectory a patient might experience in the future. This will help clinicians to tailor their advice and treatment for a specific patient.
Subject terms: Data mining, Chronic pain, Prognosis
From the FULL TEXT Article:
Introduction
In chronic musculoskeletal diseases, diagnosis alone is often insufficient to inform patients and clinicians about the future course of the disease. [1] Most chronic musculoskeletal diseases, such as low back pain (LBP), are caused by a complex combination of biological, psychological, social, and genetic factors that influence the course of the disease. [2] It is therefore argued that prognosis, which considers all of these elements, might be a better framework to inform patients and clinicians about the likely course of the disease. [1]
Within many patient populations, suffering from chronic diseases such as chronic kidney disease or cancer, it might be possible to identify clusters of individuals who share similar pain trajectories. [3] LBP studies have found that pain trajectories do not vary greatly over time, making them interesting when creating a prognosis, as the patient is likely to continue on the same trajectory they have experienced in the past. [4]
LBP is a common and heterogeneous condition that is currently considered to be a combination of many biological, psychological, social, lifestyle, comorbidities, and pain processing mechanisms. [2] Due to this complex combination of potential contributing factors, it is impossible to diagnose the exact cause of pain in 95% of LBP cases. This creates challenges for researchers in studying LBP because it is impossible to create subgroups based on a diagnosis within an often large heterogeneous group of patients. It also creates challenges for clinicians because most treatment efficacy studies do not provide definitive answers due to the large heterogeneity of patient cohorts among studies. [5, 6] The most commonly used method to create different groups of LBP patients is separation by symptom duration into acute and chronic patients, which appears too simplistic for such a complex condition. [7]
Pain trajectories have been studied extensively in LBP because trajectories might provide an alternative way to create meaningful subgroups of patients. [7–15] Currently, a detailed study of patient trajectories requires a large number of patients to be tracked regularly to create a homogeneous dataset. This is expensive in terms of time, resources and finance. Analytical approaches to datasets compiled from individual patient data (IPD) extracted from randomised controlled trials (RCTs) are limited by the data loss during analysis caused by the heterogeneity of the methodologies used in each RCT. This paper details our software approach to allow greater statistical exploration of such heterogeneous datasets.
This paper describes how a novel tool called Trajectory Analysis and Mining Software (TAMS) [16] can be used to study pain trajectories in detail. TAMS has three main capabilities:
Recognising pain trajectory patterns of individual patients;
Creating subgroups of patients to identify parameters that might have predictive
capabilities with regard to specific pain trajectories andCalculating and collecting data on the most prevalent pain trajectory within LBP,
the episodic pain trajectory.Using TAMS will hopefully lead to a greater understanding of pain trajectories in general
and increased knowledge of pain trajectories within the field of LBP research.
Methods
Technical information
TAMS was written using the scripting language AWK combined with Korn shell scripts. [17, 18] The software runs on macOS, Linux and other Unix-type operating systems.
Input data
TAMS uses the comma-separated or CSV file format as the input because it is the most common format in which datasets are stored. Furthermore, TAMS was developed to deal with 'long' file formats, whereby each patient encounter with all recorded parameters of that encounter is placed on a separate line in the file. Commercial statistical software can typically export data in this format; therefore, converting any existing dataset into a format (long and CSV) that TAMS can use is easy.
Pattern recognition
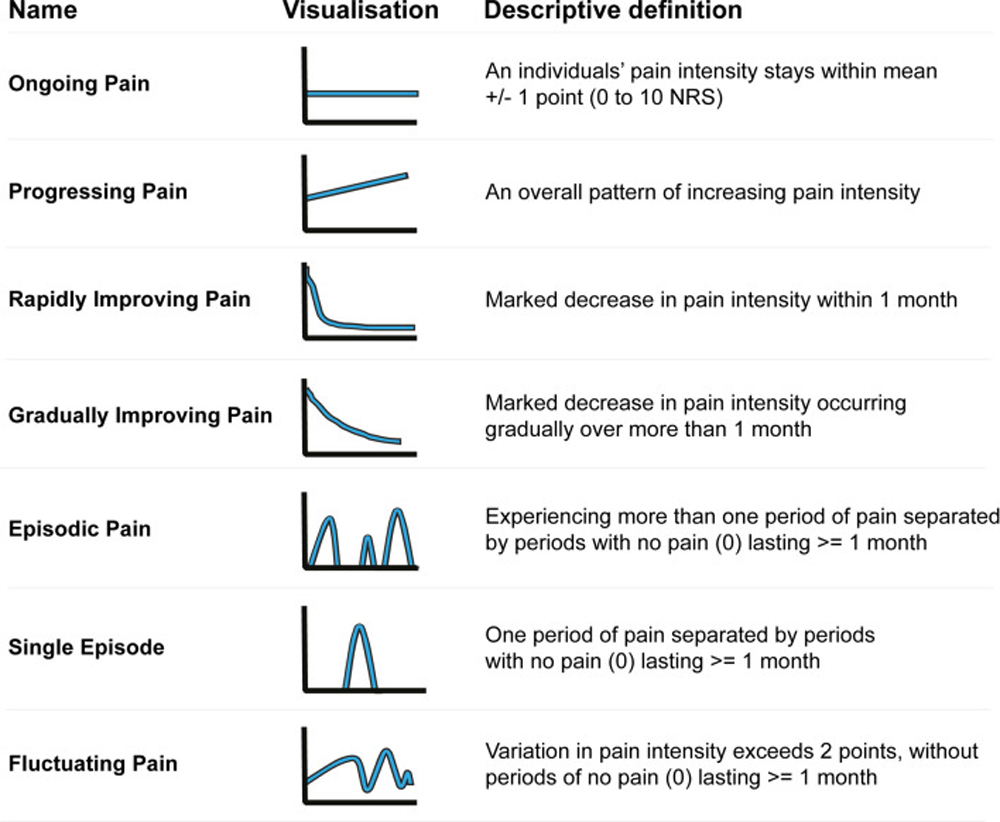
Figure 1 Currently, pain trajectories within cohorts of patients with LBP are mainly identified using data-driven analyses with longitudinal data (e.g., latent class modelling) [9]. All these analyses show a number of unstandardised trajectories that appear similar but have consistent differences in profile. Hence, comparisons between cohorts and settings using these trajectories can be problematic. To remedy this situation, a group of pain trajectory researchers suggested standards for naming and defining pain trajectories, as shown in Figure 1. [11]
Using these pre-defined definitions to identify pain trajectories has a major advantage over pure data-driven analyses identifying latent classes, as each analysis will result in the same defined pain trajectories, independent of the dataset used as input.
TAMS uses longitudinal patient data to build a trend line for each unique patient in a dataset, using the week number of the follow-up appointment as an index and pain intensity as parameter for time and y-axis, respectively. After creating a trendline, TAMS calculates extra parameters (metadata parameters) needed for the pattern detection algorithm to function, such as the mean perceived pain of the patient or if there were periods of four or more pain-free weeks. TAMS then uses the created trendline to calculate extra parameters to determine whether any pain trajectory definitions match the trendline for that patient.

Figure 2 The flow diagram of the novel algorithm is shown in Figure 2. As presented in the flow diagram, all trajectories specified in the suggested standards can be further stratified based on the severity of the mean pain intensity of a patient into minor, mild, moderate, and severe categories, creating 28 unique trajectory-severity groups. The trajectory 'fluctuating pain' is the last pain trajectory defined in the algorithm because it has the broadest definition. Consequently, the fluctuating pain trajectory serves as a collection tray for patients who do not fall into the other definitions.
Once the pain trajectories of all individual patients in the dataset is determined, the patient distribution across each pain trajectory is calculated. This distribution will be used as the result parameter in subsequent analyses. In most LBP studies, the result parameter used in the analyses is a change in symptoms at a specific time post-treatment, for instance, at one and three months after the patient was seen by a physician for the first time. When dealing with trends over time, such as pain trajectories, it is potentially meaningless to use a patient's pain intensity at a certain time post-baseline. This is because information about the trend is not factored into this analysis. If a patient experiences less pain after one month of a certain treatment, how do we know if this reflects improvement or merely fluctuating pain? Hence, we decided to use the distribution of patients over different pain trajectories as a result parameter.
Subgroup analysis
Recursive partitioning is the process of creating a decision tree for subgroups based on a set of rules21. Any numeric parameters or parameters that can be represented numerically in a dataset, such as the age or gender of the patients, can be used to create subgroups. The software further allows for dichotomised groups based on the mean value of the population, or groups can be created using population percentiles. Tailored rules can also be created for specific age groups or BMI with predetermined group limits. By specifying more than one parameter from the dataset for subgroup creation, TAMS combines the subgroups based on the specified parameters. This process of combining subgroups can continue to infinity in datasets with many parameters; however, dimensionality becomes an issue as much data would be needed to have enough patients per subgroup to perform statistically meaningful analysis across groups. For this reason, a maximum limit of three parameters was specified for TAMS to be used in recursive partitioning.
The goal of introducing a subgroup analysis capability in TAMS was to help identify specific characteristics that directly influence a patient's pain trajectory. For instance, let us say that age has a major influence on a patient's pain trajectory. By creating subgroups based on age, we expect the distribution of patients over different trajectories to be very different from that of the entire patient population.
Episode data extraction
Most pain trajectory studies indicate that LBP is episodic in most cases. [9, 10, 14, 22] Many patients experience episodes of pain separated by a minimum of four weeks, where the patient has zero pain. [20] Most treatment efficacy studies on LBP assume that LBP is a self-resolving disease. [11] Pain intensity data at predetermined moments post-baseline, for instance, at one and three months, were compared against the pain intensity at baseline to determine if a certain treatment option is more beneficial for a group of patients than another. [23–25] In the case of episodic diseases, it is probably more important to determine whether a certain treatment option affects future episodes. For instance, an effect on the duration of future episodes, an effect on the mean pain of future episodes, or an effect on the number of episodes a patient experiences during the year. To enable these types of analyses, TAMS collects, calculates, and stores episode-specific information per patient per episode in a separate output file for future analysis.
Testing and validation
The functional features of TAMS were successfully tested using simulated datasets created specifically for this purpose. This type of testing guaranteed essential workings of the software, such as the creation of subgroups. The next validation step to prove that the algorithm can recognise pain trajectory patterns was to redo a previously performed analysis using known trajectory definitions so that the results of the two analyses could be compared.
A study performed in Denmark in 2017 [10] was the only study that used a part of the standard definitions, as shown in Fig. 1, to identify the pain trajectories of a group of patients in a dataset. For the purpose of this paper, this study will be referred to as 'the Danish study'. The dataset used in the Danish study, which contains data from 1077 LBP patients, was previously analysed for pain trajectories using a latent class analysis (LCA). [12] Having a sufficient number of patients with known trajectories, the Danish Study was used to validate the output of TAMS using real-life data.
The researchers from the Danish study decided to exclude the first ten weeks of the recorded data because they were irrelevant to their analysis. Consequently, certain pain trajectories could not be detected, mainly the rapidly and gradually improving trajectories. These specific pain trajectories rely heavily on what happens in the first few weeks after the baseline measurement, and they become impossible to detect once the first ten weeks of data are removed.

Figure 3 To replicate the Danish analysis and prove the functionality of our pattern recognition software, we had to create the same conditions. The first ten weeks of data were removed, and our pattern detection algorithm was altered to remove the rapidly and gradually improving and progressing pain trajectories. The resulting algorithm, which was more or less identical to the Danish study, is shown in Figure 3.
The trajectory assessment was compared with the original study to calculate the accuracy scores obtained by constructing a truth table per trajectory per patient. This table was subsequently used to calculate the F1-score, which is an accuracy score based on the harmonic mean between precision and recall. [26] F-scores are frequently used as accuracy measures in algorithm testing for machine learning and data mining. The F1 score is a number between 0 and 1 or 0 and 100%; the higher the F1 value, the higher the accuracy. The F1-score is calculated using the following equation [26]:
Output files
TAMS can generate several different output files. These files are in the CSV format, similar to the input files, so that they can be easily imported into any statistical software. The first output file contains the distribution data of patients over the different pain trajectories, which are calculated after the trajectories of all patients in the dataset are identified. The second output file was almost identical to the input file, with the addition of an extra column containing the detected trajectory. The third output file contains episode information per patient, how many episodes were detected, and information per episode, specifically the duration and mean pain intensity for that episode. The fourth output file contains the extra parameters that TAMS calculates per patient and the metadata parameters that it needs to be able to run the pattern recognition algorithm. The final output file contains a condensed version of the first output file with distribution information. This file is meant to hold the output of a data mining run; therefore, if a thousand different subgroup combinations are tested, the user of TAMS does not have a thousand individual files but instead has one file with a thousand lines, all representing one run of TAMS.
Results

Table 1 A comparison of the results of our algorithm with those of the Danish study showed an accuracy of 99.47%. The five patients that the algorithm had 'mislabelled' turned out to be mislabelled in the assessment of the Danish study. The resulting confusion matrix, including the accuracy calculations, is presented in Table 1.
The accuracy with which TAMS reproduced the results of the Danish study validated the use of the TAMS algorithm presented in Fig. 3 to assess a dataset of patients with LBP. To the best of our knowledge, no study has used all of the suggested standard definitions to identify pain trajectories in a dataset of patients with LBP. This means that it is not possible to validate the algorithm in Fig. 2 by comparing the results of TAMS with the results of another study, as was done with the Danish study. For this reason, we visually inspected all 1077 identified pain trajectories TAMS found in the dataset of the Danish study and all were found to be correctly identified.
The Danish study only assessed weeks 10–52 of the data with a subset of the available pain trajectories. It was decided to redo the analysis using the whole dataset, with all 52 weeks and all of the pain trajectories defined in Fig. 1 and implemented in the algorithm presented in Fig. 2.

Figure 4 To showcase the possible analyses TAMS can perform, a couple of different analyses were done using the distribution of patients over the various trajectories as a result parameter. The results of the analyses were not stratified further based on pain severity to keep the number of groups in the results to a minimum. The first analysis was a recursive partitioning subgroup analysis using the parameters age and gender from the dataset of the Danish study. Two groups were created from the gender parameter, male and female, and three groups were created from the age parameter. The resulting distribution of the patients is shown in Figure 4.
The results of this analysis show some differences in patient distributions when using the parameters age and gender. We expect these differences to increase when subgroups are created from parameters that might have predictable abilities on pain trajectories.

Figure 5
Table 2 The second analysis was a subgroup analysis based on the clinical setting consulted for LBP. The Danish study included 1077 LBP patients, whereby 947 patients were recruited in 17 different chiropractic clinics and 251 patients were recruited from general practice. After the exclusion process from the Danish study, 199 patients remained from general practice and 741 patients from chiropractic clinics. The pain trajectories of these patients were analysed and the results were stratified based on setting. The results of this analysis can be seen in Figure 5.
The third analysis was geared specifically towards the episodic pain trajectory. In the dataset of the Danish study, 586 LBP patients were found to have experienced an episodic pain trajectory. TAMS calculates the number of episodes per episodic LBP patient, the duration of each episode, and the mean pain intensity per episode. These data can be studied further to see if different treatment modalities have an effect on the number of episodes per year, the average duration per episode or the mean pain per episode. Table 2 shows these data from the Danish study's dataset, grouped by the number of episodes.
Discussion
We have created a pattern recognition software system that can identify pain trajectories in longitudinal datasets of patients with pain Pain trajectories in LBP are relevant to explore further, especially if pain trajectories can potentially be used to make a cohort of LBP patients less heterogeneous by serving as LBP phenotypes. [11, 14]
Applications
In the last decade, at least two large IPD datasets were created on the subject of LBP. [23, 25] This was done by combining the individual participant data of RCTs on a specific subject within LBP, for instance, exercise treatment for LBP, to form large datasets containing data from thousands of patients. These datasets are heterogeneous in nature since the studies that comprised them were all different in design and data collection strategies. The subsequent analyses of these IPD datasets, whereby researchers compared the pain intensity at baseline to the pain intensity at one, three and six months, suffered from a loss of data. This was because the data points were not necessarily collected at the same times or frequency between studies.
TAMS looks at the pain intensity trend instead of the pain intensity data at specific moments in time. It does not matter if the data come from different studies with different data collection strategies because TAMS builds trends for each patient. This type of trend-based analysis should severely limit the amount of data loss whilst analysing large, compounded datasets such as IPDs.
Using our novel software, pain trajectory-based analyses can be performed on a large scale. This means that multiple heterogeneous datasets can be analysed, patient cohorts who received different treatments can be compared based on the distribution of patients over the different pain trajectories, and pain trajectory-specific patient characteristics can be revealed through subgroup analyses.
TAMS is written so that the subgrouping process can be easily automated. By systematically using all the numerical parameters in the dataset for recurrent partitioning, it is possible to start a process, which is essentially mining the dataset. In this process, all combinations of parameters are tried to find groups of potentially interesting patients by comparing patient distribution over different trajectories. Groups of interest can be flagged and further studied at a later date.
TAMS can also be used to evaluate the efficacy of different treatment modalities. TAMS can create different subgroups of patients receiving a certain treatment. Alternatively, treatment modality-specific datasets can be created, which can be analysed by TAMS. The settings of TAMS will be the same for both analyses, and the differences in patient distributions might help inform about the efficacy of different treatments. It will be interesting to see if different treatment modalities for LBP result in a different distribution of patients over different pain trajectories in case-matched designs. This may indicate the effectiveness of the treatment modality for each pain trajectory.
By examining the effects of treatments on the trajectories of patients, it might be possible to determine which treatment is more effective for certain patients. This needs to be studied further before clinicians can use it; however, calculating all the individual parameters needed for these studies is a good first step. The ability to consistently detect a patient's pain trajectory should enable a more detailed analysis of pain trajectories, specifically the most frequent trajectory in LBP episodic pain. Data such as the number of episodes, average pain per episode, and duration of each episode should make it possible to study episodes of LBP in greater detail.
The easy, reliable and rapid detection of trajectories should also enable the use of pain trajectories as inclusion/exclusion criteria for future studies or secondary analysis of datasets.
The suggested standards of pain trajectory definitions are well-defined, which makes it possible to implement them in a pattern detection algorithm, as was done in TAMS. However, this could also be done for pain trajectories of other chronic diseases, if the definitions are well-defined. TAMS is written with maximum flexibility, making it relatively easy to alter the algorithms for use in other chronic healthcare conditions. For instance, the same trajectories were detected in patients with chronic neck pain as those currently implemented in TAMS. [27–29] This means that TAMS can be used without alterations to analyse the datasets of patients with neck pain. In other chronic diseases such as chronic kidney disease, arthritis or cancer, patients have distinct pain trajectories as well. [3] If the trajectories are as well defined as in LBP, the pattern recognition algorithm can be easily rewritten to enable TAMS to detect these trajectories as well.
The source code to TAMS has been made available to download from GitHub so that other pain trajectory researchers can use the software. It has been written in a human-readable language so anyone can inspect the code and potentially improve upon it. The algorithms from TAMS can also be adapted to create a plugin for commercial statistical software packages such as SPSS or R.
Limitations
The pain trajectory detection algorithm implements the pain trajectory definitions specified in Kongsted et al.'s 2016 paper. [11] Therefore, it is only as good as our interpretation of these definitions. We only identified one dataset thatcould be used to validate TAMS. Ideally, this number would be much higher.
The Danish study used a dataset that contained pain intensity information that was collected on a weekly basis, with the use of SMS track. [30] This is an automatic data collection system, which uses SMS to question patients on a regular basis about their symptoms. Weekly information about the pain intensity of LBP patients is ideal for pain trajectory purposes, but not many LBP datasets collect data at such a high frequency. It is not yet known how many data points per patient are minimally needed to assess the pain trajectory accurately. However, the fewer the points available for a patient, the harder it becomes for the algorithm to detect whether the trajectory is fast improving or episodic. For instance, a minimum of four pain-free weeks is difficult to detect, with six points collected over the course of a year. However, in many cases with fewer data points, it might be possible for the algorithm to detect a pain trajectory or at least determine which pain trajectory a patient does not fit into.
At present, TAMS’s user interface is not user-friendly. The software is command-line driven, runs in a terminal and has no graphical user interface. This has been done for multiple reasons, the main one being speed. The analysis performed to identify the pain trajectories and create the patient subgroups based on the gender and age variables took less than a second to perform in a dataset of 1077 patients. This speed is important when the software is used for data mining. In this process, all possible combinations of parameters are tested to determine whether any of the combinations are of interest. In larger datasets, the potential number of parameter combinations can be billions. For this reason, it is important to have a very fast way to analyse datasets, and any couple of milliseconds saved could mean substantial analysis time saved in a data-mining operation.
Clinical relevance
The main area of intended use would be to facilitate analysis in research, especially when comparing data compiled from published studies, as in the IPD. Regarding direct clinical use, the prospective identification of pain trajectories is not very helpful for a clinician who sees a patient in their office for the first time. It is, therefore, essential to identify patient characteristics that might have predictive capabilities on which trajectory a patient might experience in the future. If it is possible, based on patient characteristics, to create an objective, reliable, and consistent 'educated guess' about the course of a patient's pain, so that both clinical advice and treatment may be tailored towards this trajectory. TAMS can be used to identify these patient characteristics to aid clinicians.
Conclusions
Turning the predefined pain trajectories for chronic LBP into an algorithm made it possible to create subgroups in a cohort of patients with LBP based on their trajectories. This need not be restricted to use in LBP. Other conditions which exhibit chronic pain could also be analysed using the same software approach or the software adapted to suit condition-specific trajectories. In this study, we demonstrated that the software can be used to replicate pain trajectory detection, as was performed in a previous Danish study. The analysis of the Danish study was extended to use the whole dataset and all the pain trajectories as defined in the proposed standard pain trajectories. Since TAMS calculates certain trajectory-specific information, such as duration of episodes, frequency of episodes, and mean pain per episode, this means that it can be used to study pain trajectories in far more detail than has been done previously. Using software for this task, makes the analysis repeatable, transparent and fast, as well as being able to run on heterogeneous datasets such as found in IPDs, which will ultimately benefit care of patients.
Acknowledgements
The authors wish to acknowledge and thank the Chiropractic Knowledge Hub for sharing their data with us, so that we could perform our validation analysis and subsequent analyses. We also would like to thank prof. Olli Ruuskanen for his advice and guidance.
Author contributions
M.R.v.I. wrote the main manuscript, wrote the software, performed the testing of the software and performed the analyses described in the manuscript. All authors supervised the process and reviewed the manuscript and the (test) results.
Data availability
The software has been made available via GitHub:
https://github.com/MaartenvanIttersum/TAMS or through Zenodo: 10.5281/zenodo.11478880. A dataset for testing purposes is also available in the GitHub repository, with instructions in the readme file of the same repository. The data used in this study to validate the software and to showcase its features are available from the Chiropractic Knowledge Hub (https://www.kiroviden.com/en/). Restrictions apply to the availability of these data, which were used under license for this study.
Competing interests
The authors declare no competing interests.
References:
Croft, P. et al.
The science of clinical practice: disease diagnosis or patient prognosis?
Evidence about “what is likely to happen” should shape clinical practice.
BMC Med.13, 1–8. 10.1186/s12916-014-0265-4 (2015).
10.1186/s12916-014-0265-4Hartvigsen J, Hancock MJ, Kongsted A, Louw Q, Ferreira ML, et al.
What Low Back Pain Is and Why We Need to Pay Attention
Lancet. 2018 (Jun 9); 391 (10137): 2356–2367
This is the second of 4 articles in the remarkable Lancet Series on Low Back PainJames, R. J. E., Walsh, D. A. & Ferguson, E.
General and disease-specific pain trajectories as predictors
of social and political outcomes in arthritis and cancer.
BMC Med.16, 1–14 (2018).
10.1186/s12916-018-1031-9Dunn, K.M., Campbell, P., and Jordan, K.P.
Long-term Trajectories of Back Pain:
Cohort Study With 7-year Follow-up
BMJ Open. 2013 (Dec 11); 3 (12): e003838Chiarotto, A. & Koes, B. W.
Nonspecific low back pain.
N Engl J Med 2022 (May 5); 386 (18): 1732-1740Maher, C., Underwood, M. & Buchbinder, R.
Non-specific low back pain.
Lancet 2017 (Feb 18); 389 (10070): 736-747Axén, I. & Leboeuf-Yde, C.
Trajectories of Low Back Pain
Best Pract Res Clin Rheumatol. 2013 (Oct); 27 (5): 601–612Axén, I. et al.
Clustering Patients on the Basis of Their Individual
Course of Low Back Pain Over a Six Month Period
BMC Musculoskelet Disord. 2011 (May 17); 12: 99Gatchel, R. et al.
Transitioning from acute to chronic pain: An examination
of different trajectories of low-back pain.
Healthcare6, 48 (2018).
10.3390/healthcare6020048Kongsted, A., Hestbćk, L. & Kent, P.
How Can Latent Trajectories of Back Pain
be Translated into Defined Subgroups?
BMC Musculoskelet Disord. 2017 (Jul 3); 18 (1): 285Kongsted A, Kent P, Axen I, Downie AS, Dunn KM.
What Have We Learned From Ten Years
of Trajectory Research in Low Back Pain?
BMC Musculoskelet Disord. 2016 (May 21); 17 (1): 220Kongsted, A., Kent, P., Hestbaek, L. & Vach, W.
Patients With Low Back Pain Had Distinct Clinical Course Patterns
That Were Typically Neither Complete Recovery Nor Constant Pain.
A Latent Class Analysis of Longitudinal Data
Spine J. 2015 (May 1); 15 (5): 885–894Macedo LG, Maher CG, Latimer J, McAuley JH, Hodges PW, Rogers WT.
Nature and determinants of the course of chronic low back pain
over a 12-month period:
a cluster analysis.
Phys Ther. 2014;94(2):210–21Nim, C. G., Kongsted, A., Downie, A. & Vach, W.
Temporal stability of self-reported visual back pain trajectories.
Pain163, E1104–E1114 (2022).
10.1097/j.pain.0000000000002661Tamcan, O. et al.
The course of chronic and recurrent low back pain
in the general population.
Pain150, 451–457 (2010).
10.1016/j.pain.2010.05.019van Ittersum, M. R.
Trajectory Analysis and Mining Software (TAMS)
(Version 1.0) [Computer software] (2024).
Zenodo 10.5281/zenodo.11478880Aho, A. V., Kernighan, B. W. & Weinberger, P. J.
The AWK Programming Language
(Addison-Wesley Publishing Company, Boston, 1988).Korn, D. G.
KSH—An Extensible High Level Language (1994).Ostelo, R. W. J. G. et al.
Interpreting change scores for pain and functional status in low back pain:
Towards international consensus regarding minimal important change.
Spine33, 90–94 (2008).
10.1097/BRS.0b013e31815e3a10De Vet, H. C. W. et al.
Episodes of low back pain: A proposal for uniform definitions to be used in research.
Spine27, 2409–2416 (2002).
10.1097/00007632-200211010-00016Seibold, H., Zeileis, A. & Hothorn, T.
Model-based recursive partitioning for subgroup analyses.
Int. J. Biostat.12, 45–63 (2016).
10.1515/ijb-2015-0032Eklund, A., Jensen, I., Lohela-Karlsson, M., Leboeuf-Yde, C. & Axén, I.
Absence of Low Back Pain to Demarcate an Episode:
A Prospective Multicentre Study in Primary Care
Chiropractic & Manual Therapies 2016 (Feb 18); 24: 3Hayden, J. A. et al.
Exercise Treatment Effect Modifiers in Persistent Low Back Pain:
An Individual Participant Data Meta-analysis of 3514
Participants From 27 Randomised Controlled Tials
British J Sports Medicine 2020 (Nov); 54 (21): 1277–1278Underwood, M.
United Kingdom Back Pain Exercise and Manipulation (UK BEAM)
Randomised Trial: Effectiveness of Physical Treatments
for Back Pain in Primary Care
British Medical Journal 2004 (Dec 11); 329 (7479): 1377de Zoete, A. et al.
Moderators of the effect of spinal manipulative therapy on pain relief
and function in patients with chronic low back pain:
An individual participant data meta-analysis.
Spine46(8), E505–E517 (2021).Olson, D. L. & Delen, D.
Advanced Data Mining Techniques
(Springer, Berlin, 2008).Ailliet, L., Rubinstein, S. M., Hoekstra, T., van Tulder, et al
Long-term Trajectories of Patients with Neck Pain
and Low Back Pain Presenting to Chiropractic Care:
A Latent Class Growth Analysis
European J Pain 2018 (Jan); 22 (1): 103–113Irgens, P. et al.
Neck Pain Patterns and Subgrouping Based
on Weekly SMS-derived Trajectories
BMC Musculoskelet Disord 2020 (Oct 14); 21 (1): 678Myhrvold, B. L. et al.
Visual Trajectory Pattern as Prognostic Factors for Neck Pain
European J Pain 2020 (Oct); 24 (9): 1752–1764www.sms-track.com.
https://www.sms-track.com/
Return to TRAJECTORIES OF LOW BACK PAIN
Since 8-17-2024


| Home Page | Visit Our Sponsors | Become a Sponsor |
Please read our DISCLAIMER |