

Metabolic Syndrome Components Are Associated
with Intervertebral Disc Degeneration:
The Wakayama Spine StudyThis section was compiled by Frank M. Painter, D.C.
Make comments or suggestions to Frankp@chiro.org


FROM: PLoS One. 2016 (Feb 3); 11 (2): e0147565 ~ FULL TEXT
OPEN ACCESS Masatoshi Teraguchi, Noriko Yoshimura, Hiroshi Hashizume, Shigeyuki Muraki, et al
Department of Orthopaedic surgery,
Wakayama Medical University,
811-1 Kimiidera,
Wakayama, 641-8509, Japan.OBJECTIVE: The objective of the present study was to examine the associations between metabolic syndrome (MS) components, such as overweight (OW), hypertension (HT), dyslipidemia (DL), and impaired glucose tolerance (IGT), and intervertebral disc degeneration (DD).
DESIGN: The present study included 928 participants (308 men, 620 women) of the 1,011 participants in the Wakayama Spine Study. DD on magnetic resonance imaging was classified according to the Pfirrmann system. OW, HT, DL, and IGT were assessed using the criteria of the Examination Committee of Criteria for MS in Japan.
RESULTS: Multivariable logistic regression analysis revealed that OW was significantly associated with cervical, thoracic, and lumbar DD (cervical: odds ratio [OR], 1.28; 95% confidence interval [CI], 0.92-1.78; thoracic: OR, 1.75; 95% CI, 1.24-2.51; lumbar: OR, 1.87; 95% CI, 1.06-3.48). HT and IGT were significantly associated with thoracic DD (HT: OR, 1.54; 95% CI, 1.09-2.18; IGT: OR, 1.65; 95% CI, 1.12-2.48). Furthermore, subjects with 1 or more MS components had a higher OR for thoracic DD compared with those without MS components (vs. no component; 1 component: OR, 1.58; 95% CI, 1.03-2.42; 2 components: OR, 2.60; 95% CI, 1.62-4.20; ≥3 components: OR, 2.62; 95% CI, 1.42-5.00).
CONCLUSION: Metabolic Syndrome (MS) components were significantly associated with thoracic intervertebral disc degeneration (DD). Furthermore, accumulation of MS components significantly increased the odds ratio [OR] for thoracic DD. These findings support the need for further studies of the effects of metabolic abnormality on DD.
From the FULL TEXT Article:
Introduction
Intervertebral disc degeneration (DD) is generally considered as the first step of spinal change and undergoes destructive changes with age. It is typically followed by the loss of water and proteoglycan content of the nucleus, annulus tears, gradual formation of osteophytes, disc narrowing, and spinal canal stenosis [1, 2], and low back pain [3–6], is a major public health problem that negatively influences activities of daily living and quality of life in those affected. The number of patients with degenerative disease of the spine is increasing [6], thereby causing medical expenses to rise. In spite of these situation, the cause of DD is not fully understood.
Because the etiology of DD exclude aging remains poorly understood. Accordingly, we need to clarify which risk factors promote DD to establish preventive measures against DD. In the present study, we focused on metabolic syndrome (MS) component, such as overweight (OW), hypertension (HT), dyslipidemia (DL), and impaired glucose tolerance (IGT), because MS component has some influence on atherosclerosis [7] and accumulation of MS component increase the risk of atherosclerosis events. [8] MS may increase not only the risk of cardiovascular events but also the risk of DD in the whole body [9], because intervertebral discs, which are structures with precarious nutrient supply at tissue level throughout the whole body, may suffer and gradually degenerate as a consequence of failure of nutrient supply to disc cells. [10, 11]
However the association between MS component and DD remains controversial. [9] In some previous epidemiologic studies, OW [6, 12–16], DL [16], and IGT [17] were found to be associated with DD in the lumbar region. Other studies, however, have found no clear associations between hypertension (HT) [9], IGT [9, 16], and DL [9, 18], and DD in the lumbar region. This may be due to the limitation of potential biases related to patient selection and the consequences of disease on behavior. Furthermore, the majority of epidemiologic investigations have focused only on the lumbar spine.
We believe that analysis of DD in the entire spine would provide more useful data than that of DD in only the lumbar region. Since the cervical and lumbar regions comprise mobile segments, the intervertebral discs in these regions are easily affected by mechanical and motion stress; thus, the effects of certain factors imposed on all intervertebral discs equally, such as age and endogenic factors, might be masked. In contrast, the thoracic region is stabilized by the thoracic cage, which reduces mechanical stress imposed on the intervertebral discs. We conducted a thorough literature review and found no studies of associations between component of MS and DD that focused on a population-based analysis using whole-spine magnetic resonance imaging (MRI).
The purpose of the present study was to examine the association of each MS component, such as OW, HT, DL, and IGT, with DD in the cervical, thoracic, and lumbar regions of the entire spine in a large population. We also examined the relationship between accumulation of MS components and DD.
Methods
Participants
The present study design was approved by the Wakayama medical university ethics committee. All participants provided their written informed consent. The present study, entitled the Wakayama Spine Study, was a population-based study of DD performed using a subcohort of the large-scale population-based cohort study called Research on Osteoarthritis/Osteoporosis Against Disability (ROAD). The ROAD study is a nationwide, prospective study of bone and joint diseases consisting of population-based cohorts established in several communities in Japan. [19, 20] A second visit of the ROAD study to the mountainous region of H town and the seacoast region of T town was performed between 2008 and 2010. From inhabitants participating in the second visit of the ROAD study, 1,063 volunteers were recruited for MRI examinations. Among the 1,063 volunteers, 52 declined to attend the examination; therefore, 1,011 inhabitants were recruited for registration in the Wakayama Spine Study. Among the 1,011 participants, those who had an MRI-sensitive implanted device (e.g., pacemaker) or other disqualifiers were excluded. Consequently, 980 individuals underwent whole-spine MRI. One participant who had undergone a previous cervical operation and 4 participants who had undergone previous posterior lumbar fusion were excluded from the analysis. Whole-spine MRI results were available for 975 participants (324 men, 651 women) with an age range of 21 to 97 years (mean, 67.2 years for men, 66.0 years for women). Thirty participants with incomplete anthropometric measurements and 17 participants without blood measurements were excluded. Finally, the present study comprised 928 participants (308 men, 620 women) with a mean age of 67.4 years.
The participants completed an interviewer-administered questionnaire of 400 items that included lifestyle information, such as smoking habit, alcohol consumption, family history, past history, occupation, physical activity, and health-related quality of life. Anthropometric measurements included height, weight, and body mass index (BMI) (weight [kg]/height [m]2). An experienced public health nurse measured systolic and diastolic blood pressure (BP) using a mercury sphygmomanometer.
MRI
A mobile MRI unit (Excelart 1.5 T; Toshiba, Tokyo, Japan) was used in the present study, and whole-spine MRI was performed for all participants on the same day as the questionnaire and anthropometric examination. The participants were supine during MRI, and those with rounded backs used triangular pillows under their head and knees. The imaging protocol included sagittal T2-weighted fast-spin echo (FSE) (repetition time [TR], 4000 ms/echo; echo time [TE], 120 ms; field of view [FOV], 300 × 320 mm) and axial T2-weighted FSE (TR, 4000 ms/echo; TE, 120 ms; FOV, 180 × 180 mm).
Sagittal T2-weighted images were used to assess the intervertebral space from C2/3 to L5/S1. C2/3 to C7/T1, T1/2 to T12/L1, and L1/2 to L5/S1 were defined as the cervical, thoracic, and lumbar region, respectively. Grading of DD was performed by a board certified orthopedic surgeon (M.T.) who was blinded to the background of the subjects. The degree of DD on MRI was classified into 5 grades based on the Pfirrmann system [21], with grades 4 and 5 indicating DD. The signal intensity for grade 4 is intermediate to hypointense to cerebrospinal fluid (dark gray), while the structure is inhomogeneous. The signal intensity for grade 5 is hypointense to cerebrospinal fluid (black), and the structure is likewise inhomogeneous. In addition, the disc space is collapsed. It has been reported that loss of signal intensity is significantly associated with morphologic level of DD and also with water and proteoglycan content in a disc. [22] Therefore, we used a grading system based on signal intensity and disc height.
For evaluating intraobserver variability, 100 randomly selected whole-spine magnetic resonance images were rescored by the same observer (M.T.) more than 1 month after the first reading. Furthermore, to evaluate interobserver variability, 100 other magnetic resonance images were scored by 2 board certified orthopedic surgeons (M.T. and R.K.) using the same classification system. The intra- and interobserver variability for DD, as evaluated by kappa analysis, were 0.94 and 0.94, respectively.
Blood examination
All blood and urine samples were extracted between 9:00 AM and 3:00 PM. Some samples were extracted under fasting conditions. After centrifugation of the blood samples, sera were immediately placed in dry ice, and transferred to a deep freezer within 24 hours. These samples were stored at –80°C until assayed. For the samples of participants in the baseline study, the following items were measured: blood counts, hemoglobin, hemoglobin A1c (HbA1c), blood sugar, total protein, aspartate aminotransferase, alanine aminotransferase, γ-glutamyl transpeptidase, high-density lipoprotein cholesterol (HDL-C), total cholesterol, triglycerides (TGs), blood urea nitrogen, uric acid, and creatinine. These analyses were performed at the same laboratory within 24 hours after extraction (Osaka Kessei Research Laboratories Inc., Osaka, Japan).
Definitions of MS components were based mainly on the criteria of the Examination Committee of Criteria for MS in Japan [23]. According to the consensus, an abdominal circumference ≥85 cm in men and ≥90 cm in women is a necessary condition for MS. HT was diagnosed as systolic BP ≥130 mm Hg and/or diastolic BP ≥85 mm Hg; DL, as serum TG level ≥150 mg/dL and/or serum HDL-C level <40 mg/dL; and IGT, as fasting serum glucose level ≥100 mg/dL. Recently, the National Cholesterol Education Program’s Adult Treatment Panel III report proposed a new set of criteria to define MS without central obesity, as indicated by waist circumference, as the core feature. [24] Furthermore, compared with BMI, measurement of waist circumference is less reproducible due to lack of uniformity in measurement methods. [25, 26] By contrast, measurement of BMI is more user-friendly and widely practiced. In this study, we decided to use BMI ≥25 kg/m2 as an indicator of OW, based on the criteria of the Japan Society for the Study of Obesity. [25]
In addition, because not all blood samples were obtained under fasting conditions, we did not use participants’ data concerning serum levels of glucose and TGs because of their large variation depending on hours after eating. Instead, we used serum HDL-C level <40 mg/dL to indicate DL, and serum HbA1c level ≥5.5% to indicate IGT (the value for HbA1c (National Glycohemoglobin Standardization Program (NGSP)) (%) is estimated as an NGSP-equivalent value calculated by the formula HbA1c (%) = HbA1c (Japan Diabetes Society (JDS)) (%) + 0.4%). [27] These are indices used in the National Health and Nutrition Survey in Japan, which were adopted as criteria for MS in this national screening based on the difficulty of collecting samples under fasting conditions. [28]
Statistical analysis
All statistical analyses were performed using JMP version 8 (SAS Institute Japan, Tokyo, Japan). Differences between the groups depending on the presence or absence of DD were tested using a variance analysis. Multivariable logistic regression analysis was performed to determine the association of OW, HT, DL, and IGT with DD. The DD in the cervical, thoracic, or lumbar region was separately served as an objective variable. Then, to clarify the association between accumulation of MS components and DD, logistic regression analysis was repeated using presence of DD in the cervical, thoracic, and lumbar region, respectively, as the objective variable and number of MS components present as the explanatory variable, after adjusting for age, sex, regional difference, smoking habit, and alcohol consumption. P value of <0.05 was treated as significant

Table 1
Table 2
Table 3
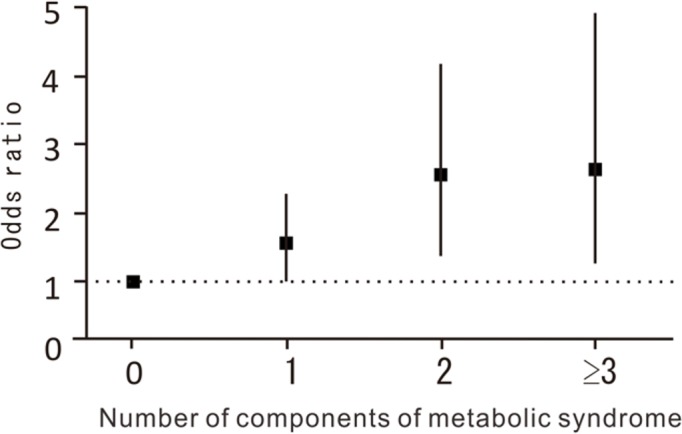
Figure 1 Table 1 shows selected characteristics of the participants, including age, height, weight, BMI, systolic and diastolic BP, and serum levels of HDL-C and HbA1c, classified by sex. Table 1 also shows the proportion of subjects who smoked (regularly or more than once a month) and consumed alcohol (regularly or more than once a month), and the prevalence of OW, HT, DL, and IGT. In the total population, the MS component with the highest prevalence was HT, followed by OW, IGT, and DL.
Table 2 shows the mean value of each MS component according to absence and presence of DD in the cervical, thoracic, and lumbar region, respectively. Mean values of age, BMI, systolic BP, and HbA1c were significantly higher, while those of HDL-C were significantly lower, in subjects with DD than in those without DD.
To determine the associations of DD with OW, HT, DL, and IGT, multivariable logistic regression analysis was performed (Table 3). OW was significantly associated with presence of DD in the cervical, thoracic, and lumbar regions. In addition, HT, DL, and IGT were significantly associated with presence of DD in the thoracic region, but not with DD in the cervical and lumbar regions.
Next, to determine the effect of accumulation of MS components on DD in the thoracic region, we examined the association of number of MS components present with DD after adjusting for age, sex, regional difference, smoking habit, and alcohol consumption. Figure 1 shows the odds ratio (OR) of number of MS components for presence of DD in the thoracic region. Subjects with 1 or more MS components had a higher OR for presence of DD compared with those without MS components (vs. no component; 1 component: OR, 1.58; 95% confidence interval [CI], 1.03–2.42; p = 0.0353; 2 components: OR, 2.60; 95% CI, 1.61–4.20; p < 0.0001; ≥3 components: OR, 2.62; 95% CI, 1.42–5.00; p = 0.0021).
Discussion
The present study was the first to determine the associations between MS components and DD in the entire spine using whole-spine MRI in a large population. We elucidated that OW was significantly associated with presence of DD in the entire spine, including the cervical, thoracic, and lumbar regions. HT, DL, and IGT were significantly associated with presence of DD in the thoracic region, but not with DD in the cervical and lumbar regions. Furthermore, we also found that accumulation of MS components was significantly associated with presence of DD in the thoracic region.
Regarding the association between degenerative musculoskeletal disease and metabolic risk factors, Yoshimura et al. clarified the association between accumulation of metabolic risk factors and presence and occurrence of knee osteoarthritis (OA). [29, 30] Hart et al. found that metabolic risk factors, such as high blood glucose level, hypercholesterolemia, and even treated HT, were associated with development of knee OA. [31] Furthermore, Anekstein et al. clarified the association between diabetes mellitus and lumbar spinal stenosis in the patients. [32] However, to our knowledge, there has been no report concerning the association between MS components and DD in the spine, especially the entire spine, using whole-spine MRI in a large population.
In the present study, OW was significantly associated with presence of DD in the cervical, thoracic, and lumbar regions. The association between OW and DD has been previously reported, and Liuke et al. found that past OW was more strongly associated with DD than present OW. [13] Samartzis et al. reported that DD in the lumbar region was significantly associated with OW and obesity. [14] On the other hand, according to Okada et al. and Matsumoto et al., DD in the cervical and thoracic regions did not have significant correlation with BMI. [32, 33] Therefore, the association remains controversial. The present study is the first to determine the association of OW with DD in the entire spine using a population-based design, and found that OW was significantly associated with DD in not only the lumbar region but also the cervical and thoracic regions. DD is influenced by inflammatory cytokines, such as adipokines, known as key metabolism mediators. [34–37] Inflammatory cytokines, such as leptin, adiponectin, and resistin, have more addressed in body fat. [34, 38] Thus, OW may lead to an increase in adipokine secretion of proinflammatory cytokines and metabolic mediators; thus, all intervertebral discs in the entire spine may be influenced by inflammatory cytokines. Further research is needed to elucidate the mechanism through which OW affects DD since both direct mechanical stress and indirect factors affect the intervertebral discs.
To our knowledge, there has been less report regarding the association of HT with DD or lumbar spinal stenosis as spinal disorder. [9, 39] HT is a well-known risk factor for development of atherosclerosis. [40] Thus, HT might lead to vascular insufficiency to the disc, due to atherosclerosis, which can affect nutrient and metabolite transport into the disc.
The present study also confirmed the significant association between IGT and DD. In one study, it was reported that diabetic sand rats had more dehydrated discs compared with a control group. [17] In the Nurses’ Health Study, IGT increased the risk of lumbar disc herniation. [41] However, several previous reports on DD also showed a weak association with IGT [9, 16, 42]; this may be due to their investigation of DD in only the lumbar region. In this study, we found an association between IGT and presence of DD in the thoracic region. Therefore, IGT, which is well known for causing microangiopathy throughout the whole body, also might be a predisposing factor for development of DD. Furthermore, advanced glycation end products accumulate in the intervertebral discs with aging, particularly when the concentration of serum glucose is high, such as in IGT. [43] Therefore, IGT might be associated with DD.
In this study, we found a negative association between DL and DD. The association of DL and DD also remains controversial in previous reports. [9, 18, 44] We believe that DD might be the result of decreased blood supply, caused by DL, to the already poorly vascularized discs. [45, 46] The mean HDL-C was higher in women than in men, as shown in Table 2. Because women in Japan use health services more frequently compared with men [28], the proportion of patients with DL in women was higher than that in men. This might have influenced the negative association between DD and DL. In a follow-up study, we will further investigate the association between DL and DD.
We found no associations of HT, DL, and IGT with DD in the cervical and lumbar regions. Since the cervical and lumbar regions comprise mobile segments, the intervertebral discs are easily affected by mechanical and motion stress, while the effect of endogenous factors might be masked. In contrast, in the thoracic region, mechanical stress on the intervertebral discs is reduced because the region is stabilized by the thoracic cage. Distinct associations among DD in the cervical, thoracic, and lumbar regions might indicate the effects of HT, DL, and IGT on DD are due to endogenous factors. To clarify risk factors for DD, particularly endogenous risk factors, it may be useful to examine associations in not only the cervical and lumbar regions, but in the thoracic region as well.
Study limitations
This study has several limitations. First, this was a cross-sectional study; thus, the causal relationships between MS components and DD remain unclear. These can only be ascertained by a follow-up study that clarifies the incidence and/or progression rates of DD in the same cohort. Second, the participants included in the present study may not represent the general population since they were recruited from only 2 local areas. To confirm whether the participants are representative of the Japanese population, we compared anthropometric measurements and frequencies of smoking and alcohol consumption between the general Japanese population and the study participants. No significant difference in BMI was observed (men: 24.0 kg/m2 vs. 23.7 kg/m2, p = 0.33; women: 23.5 kg/m2 vs. 23.1 kg/m2, p = 0.07). Further, the proportion of men who smoked and who consumed alcohol (those who regularly smoked or consumed alcohol more than once per month) and the proportion of women who consumed alcohol were significantly higher in the general Japanese population than in the study population, whereas there was no significant difference in the proportion of women who smoked (men who smoked: 32.6% vs. 23.3%, p = 0.015; women who smoked: 4.9% vs. 3.5%, p = 0.50; men who consumed alcohol: 73.9% vs. 57.5%, p < 0.0001; women who consumed alcohol: 28.1% vs. 18.2%, p < 0.0001).
These results suggest the likelihood that, in this study, participants had healthier lifestyles than those of the general Japanese population. [28] This “healthy” selection bias should be taken into consideration when generalizing the results obtained from the Wakayama Spine Study. In addition, since the blood samples obtained were not always from participants under fasting conditions, we used serum HDL-C level <40 mg/dL, and not TG level, to indicate DL, and serum HbA1c level ≥5.5%, and not blood glucose level, to indicate IGT, which are indices used by the National Health and Nutrition Survey in Japan. [28] These differences in the definition of MS might have skewed the true association between MS and DD.
Conclusions
We investigated the associations between MS components and DD in the cervical, thoracic, and lumbar regions in a large population of individuals ranging in age from 21 to 97 years. We revealed that OW was significantly associated with presence of DD in the entire spine, and that HT and IGT were significantly associated with presence of DD in the thoracic region. We also found that subjects with 1 or more MS components had a higher OR for presence of DD compared with those without MS components. The prevention of MS may be useful for avoiding DD. Further investigations, along with continued longitudinal surveys of the Wakayama Spine Study, will elucidate the associations between MS components and occurrence or progression of DD.
Acknowledgments
The authors wish to thank Mrs. Tomoko Takijiri and other members of the Public Office in Hidakagawa Town, and Mrs. Tamako Tsutsumi, Mrs. Kanami Maeda, and other members of the Public Office in Taiji Town for their assistance in the location and scheduling of participants for examinations.
Abbreviations
DD = disc degeneration
MS = metabolic syndrome
OW = overweight
HT = hypertension
DL = dyslipidemia
IGT = impaired glucose tolerance
ROAD = Research on Osteoarthritis/Osteoporosis Against Disability
Funding Statement
This study was supported by H23-Choujyu-002 (Director, Toru Akune), H-25-Choujyu-007 (Director, Noriko Yoshimura), H25-Nanchitou (Men)-005 (Director, Sakae Tanaka), 201417014A (Director, Noriko Yoshimura), and H22-Choujyu-Wakate-007 (Director, Shigeyuki Muraki) from the Ministry of Health, Labour and Welfare; a Grant-in-Aid for Scientific Research (B26293139, B23390172 to Noriko Yoshimura, B2629333, C20591774 to Shigeyuki Muraki, C26462249 to Hiroshi Hashizume, C25462305 to Hiroshi Yamada) and a Grant-in-Aid for Young Researcher (B25860448 to Yuyu Ishimoto, B26861286 to Masatoshi Teraguchi, B26860419 to Ryohei Kagotani, B15K20013 to Hiroki Iwahashi), and Grant-in-Aid for Challenging Exploratory Research (15K15219 to Noriko Yoshimura, 26670307 to Shigeyuki Muraki, 24659666 to Hiroyuki Oka, 25670293 to Toru Akune) of JSPS KAKENHI grant; a Grant from the Japanese Orthopaedics and Traumatology Foundation, Inc. (No. 287) to Masatoshi Teraguchi; and Collaborating Research with NSF 08033011- 00262 (Director, Noriko Yoshimura) from the Ministry of Education, Culture, Sports, Science and Technology in Japan. This study was also supported by grants from the Japan Osteoporosis Society (Noriko Yoshimura, Shigeyuki Muraki, Hiroyuki Oka, and Toru Akune), a grant from JA Kyosai Research Institute (Hiroyuki Oka), a grant from Mitsui Sumitomo Insurance Welfare Foundation (Shigeyuki Muraki), and research aid from the Japanese Orthopaedic Association (JOA-Subsidized Science Project Research 2006-1 & 2010-2; Director, Hiroshi Kawaguchi).
Data Availability
The present study used resident data from two communities in Wakayama prefecture. It is impossible for us to provide and upload these data in a public repository because we have confirmed with these municipalities and residents that data will remain confidential. We will provide anonymized data on request after discussing the contents with the municipalities, as long as researchers are qualified to request these data. Data requests can be made to the corresponding author at pj.ca.dem-amayakaw@muzihsah.
References:
Boos N, Weissbach S, Rohrbach H, Weiler C, Spratt KF, Nerlich AG.
Classification of age-related changes in lumbar intervertebral discs:
2002 Volvo Award in basic science.
Spine. 2002;27(23):2631–44Katz JN, Harris MB.
Lumbar spinal stenosis.
N Engl J Med 2008;358(8):818–25Luoma K, Riihimäki H, Luukkonen R, Raininko R, Viikari-Juntura E, Lamminen A.
Low back pain in relation to lumbar disc degeneration.
Spine 2000; 25(4):487–92Borenstein DG, O'Mara JW Jr, Boden SD, Lauerman WC, Jacobson A, Platenberg, et al.
The value of magnetic resonance imaging of the lumbar spine to predict
low-back pain in asymptomatic subjects:
a seven-year follow-up study.
J Bone Joint Surg Am 2001. 2001;83-A(9):1306–11de Schepper EI, Damen J, van Meurs JB, Ginai AZ, Popham M, Hofman A, et al.
The association between lumbar disc degeneration and low back pain:
the influence of age, gender, and individual radiographic features.
Spine 2010;35(5):531–6Teraguchi M, Yoshimura N, Hashizume H, Muraki S, Yamada H, Minamide A, et al.
Prevalence and distribution of intervertebral disc degeneration
over the entire spine in a population-based cohort:
the Wakayama Spine Study.
Osteoarthritis Cartilage 2014; 22(1):104–10Vitale C, Marazzi G, Volterrani M, Aloisio A, Rosano G, Fini M:
Metabolic syndrome.
Minerva Med. 2006, 97 (3): 219–29Wilson PW, D'Agostino RB, Parise H, Sullivan L, Meigs JB.
Metabolic Syndrome as a precursor of cardiovascular disease
and type 2 diabetes mellitus.
Circulation. 2005;112(20):3066–72Suri P, Hunter DJ, Rainville J, Guermazi A, Katz JN.
Quantitative assessment of abdominal aortic calcification and associations
with lumbar intervertebral disc height loss: the Framingham Study.
Spine J 2012;12(4): 315–23Urban JP, Smith S, Fairbank JC.
Nutrition of the intervertebral disc.
Spine 2004; 29(23):2700–9Urban JP, Roberts S.
Degeneration of the intervertebral disc.
Arthritis Res Ther 2003; 5(3):120–30Yoshimura N, Dennison E, Wilman C, Hashimoto T, Cooper C.
Epidemiology of chronic disc degeneration and osteoarthritis of the
lumbar spine in Britain and Japan: a comparative study.
J Rheumatol 2000; 27(2): 429–33Liuke M, Solovieva S, Lamminen A, Luoma K, Leino-Arjas P, Luukkonen R, et al.
Disc degeneration of the lumbar spine in relation to overweight.
Int J Obes (Lond) 2005; 29(8): 903–8Samartzis D, Karppinen J, Chan D, Luk KD, Cheung KM.
The association of lumbar intervertebral disc degeneration on
magnetic resonance imaging with body mass index in overweight and obese adults.
Arthritis Rheum 2012; 64(5):1488–96Takatalo J, Karppinen J, Taimela S, Niinimäki J, Laitinen J, Sequeiros RB, et al.
Association of abdominal obesity with lumbar disc
degeneration—a magnetic resonance imaging study.
PLoS One 2013; 8(2): e56244Hangai M, Kaneoka K, Kuno S, Hinotsu S, Sakane M, Mamizuka N, et al.
Factors associated with lumbar intervertebral disc degeneration in the elderly.
Spine J 2008; 8(5): 732–40Ziv I, Moskowitz RW, Kraise I, Adler JH, Maroudas A.
Physicochemical properties of the aging and diabetic sand rat intervertebral disc.
J Orthop Res 1992;10(2): 205–10Kauppila LI, Mikkonen R, Mankinen P, Pelto-Vasenius K, Mäenpää I.
MR aortography and serum cholesterol levels in patients
with long-term nonspecific lower back pain.
Spine 2004; 29(19): 2147–52Yoshimura N, Muraki S, Oka H, Kawaguchi H, Nakamura K, Akune T.
Cohort profile: Research on Osteoarthritis/
Osteoporosis Against Disability (ROAD) study.
Int J Epidemiol 2010; 39(4): 988–95Yoshimura N, Muraki S, Oka H, Mabuchi A, En-Yo Y, Yoshida M, et al.
Prevalence of knee osteoarthritis, lumbar spondylosis, and osteoporosis
in Japanese men and women: the research on osteoarthritis/
osteoporosis against disability study.
J Bone Miner Metab 2009; 27(5): 620–28Pfirrmann CW, Metzdorf A, Zanetti M, Hodler J, Boos N.
Magnetic resonance classification of lumbar intervertebral disc degeneration.
Spine 2001; 26(17): 1873–8Benneker LM, Heini PF, Anderson SE, Alini M, Ito K.
Correlation of radiographic and MRI parameters to morphological and
biochemical assessment of intervertebral disc degeneration.
Eur Spine J 2005; 14(1): 27–35The Examination Committee of Criteria for Metabolic Syndrome.
The definition and criteria of metabolic syndrome [in Japanese].
J Jpn Soc Intern Med 2005; 94: 794–809.Grundy SM, Brewer HB Jr, Cleeman JI, Smith SC Jr, Lenfant C.
Definition of metabolic syndrome: report of the National Heart, Lung,
and Blood Institute/American Heart Association conference
on scientific issues related to definition.
Circulation 2004; 109(3): 433–8Examination Committee of Criteria for ‘Obesity Disease’ in Japan;
Japan Society for the Study of Obesity.
New criteria for ‘obesity disease’ in Japan.
Circ J 2002; 66(11): 987–92Shibata K, Suzuki S, Sato J, Ohsawa I, Goto S, Hashiguchi M, et al.
Abdominal circumference should not be a required criterion for
the diagnosis of metabolic syndrome.
Environ Health Prev Med 2010; 15(4): 229–35Japan Diabetes Society Committee on the Diagnostic Criteria of Diabetes Mellitus.
Report of the Committee on the classification and diagnostic criteria of diabetes mellitus.
J. Jpn. Diabetes Soc. 2010; 53: 450–67.Ministry of Health, Labour and Welfare.
The outline of the results of National Health and Nutrition Survey 2008 [in Japanese].
Available at:
http://www.mhlw.go.jp/houdou/2008/04/dl/h0430-2c.pdfYoshimura N, Muraki S, Oka H, Kawaguchi H, Nakamura K, Akune T.
Association of knee osteoarthritis with the accumulation of metabolic
risk factors such as overweight, hypertension, dyslipidemia, and impaired
glucose tolerance in Japanese men and women: the ROAD study.
J Rheumatol 2011; 38(5): 921–30Yoshimura N, Muraki S, Oka H, Tanaka S, Kawaguchi H, Nakamura K, et al.
Accumulation of metabolic risk factors such as overweight, hypertension,
dyslipidaemia, and impaired glucose tolerance raises the risk of occurrence
and progression of knee osteoarthritis: a 3-year follow-up of the ROAD study.
Osteoarthritis Cartilage 2012; 20(11): 1217–26Hart DJ, Doyle DV, Spector TD.
Association between metabolic factors and knee osteoarthritis in women:
the Chingford study.
J Rheumatol 1995; 22(6):1118–23Anekstein Y, Smorgick Y, Lotan R, Agar G, Shalmon E, Floman Y, et al.
Diabetes mellitus as a risk factor for the development of lumbar spinal stenosis.
Isr Med Assoc J 2010; 12(1): 16–20Okada E, Matsumoto M, Ichihara D, Chiba K, Toyama Y, Fujiwara H, et al.
Aging of the cervical spine in healthy volunteers:
a 10-year longitudinal magnetic resonance imaging study.
Spine 2009; 34(7):706–12Matsumoto M, Fujimura Y, Suzuki N, Nishi Y, Nakamura M, Yabe Y, et al.
MRI of cervical intervertebral discs in asymptomatic subjects.
J Bone Joint Surg Br 1998; 80(1):19–24Balistreri CR, Caruso C, Candore G.
The role of adipose tissue and adipokines in
obesity-related inflammatory diseases.
Mediators Inflamm 2010;2010:802078Zhao CQ, Liu D, Li H, Jiang LS, Dai LY.
Expression of leptin and its functional receptor on disc cells:
contribution to cell proliferation.
Spine 2008;; 33(23):E858–64Gruber HE, Ingram JA, Hoelscher GL, Hanley EN Jr.
Leptin expression by annulus cells in the human intervertebral disc.
Spine J 2007; 7(4): 437–43Li Z, Shen J, Wu WK, Yu X, Liang J, Qiu G, et al.
The role of leptin on the organization and expression of
cytoskeleton elements in nucleus pulposus cells.
J Orthop Res 2013; 31(6): 847–57Lotan R, Oron A, Anekstein Y, Shalmon E, Mirovsky Y.
Lumbar stenosis and systemic disease: is there any relevance?
J Spinal Disord Tech 2008; 21(4): 247–51Alexander RW.
Theodore Cooper Memorial Lecture.
Hypertension and the pathogenesis of atherosclerosis.
Oxidative stress and the mediation of arterial inflammatory response:
a new perspective.
Hypertension 1995; 25(2):155–61Jhawar BS, Fuchs CS, Colditz GA, Stampfer MJ.
Cardiovascular risk factors for physician-diagnosed lumbar disc herniation.
Spine J 2006; 6(6): 684–91Videman T, Battié MC, Gibbons LE, Kaprio J, Koskenvuo M, Kannus P, et al.
Disc degeneration and bone density in monozygotic twins
discordant for insulin-dependent diabetes mellitus.
J Orthop Res 2000; 18(5): 768–72Tsai TT, Ho NY, Lin YT, Lai PL, Fu TS, Niu CC, et al.
Advanced glycation end products in degenerative nucleus pulposus with diabetes.
J Orthop Res 2014; 32(2):238–44Leino-Arjas P, Kaila-Kangas L, Solovieva S, Riihimäki H, Kirjonen J, Reunanen A.
Serum lipids and low back pain: an association?
A follow-up study of a working population sample.
Spine 2006; 31(9): 1032–7Kauppila LI.
Prevalence of stenotic changes in arteries supplying the lumbar spine.
A postmortem angiographic study on 140 subjects.
Ann Rheum Dis 1997; 56(10): 591–5Kauppila LI, McAlindon T, Evans S, Wilson PW, Kiel D, Felson DT.
Disc degeneration/back pain and calcification of the abdominal aorta.
A 25-year follow-up study in Framingham.
Spine 1997; 22(14): 1642–7
Return to DISC HERNIATION
Return to NON-MUSCULOSKELETAL DYSFUNCTION
Since 1-07-2017
| Home Page | Visit Our Sponsors | Become a Sponsor |
Please read our DISCLAIMER |