

The European Epidemic: Pain Prevalence
and Socioeconomic Inequalities in
Pain Across 19 European CountriesThis section is compiled by Frank M. Painter, D.C.
Send all comments or additions to: Frankp@chiro.org


FROM: European Journal of Pain 2019 (Sep); 23 (8): 1425–1436 ~ FULL TEXT
OPEN ACCESS Adam Todd Courtney L. McNamara Mirza Balaj Tim Huijts Nasima Akhter
Katie Thomson Adetayo Kasim Terje A. Eikemo Clare Bambra
School of Pharmacy,
Faculty of Medical Sciences,
Newcastle University,
Newcastle upon Tyne, UK.

BACKGROUND: Using data from the European Social Survey (ESS) 2014, this study presents an update of pain prevalence amongst men and women across Europe and undertakes the first analysis of socioeconomic inequalities in pain.
METHODS: Data from the ESS 2014 survey were analysed for three pain variables: back/neck pain (n = 11,032), hand/arm pain (n = 5,954) and foot/leg pain (n = 6,314). Education was used as the indicator of socioeconomic status (SES). Age-adjusted risk differences and age-adjusted risk ratios were calculated from predicted probabilities generated by means of binary logistic regression. These analyses compared the lower education group with the higher education group (the socioeconomic gap), and the medium education group with the higher education group (the gradient).
RESULTS: High prevalence rates were reported for all three types of pain across European countries. At a pan-European level, back/neck pain was the most prevalent with 40% of survey participants experiencing pain; then hand/arm pain at 22%, and then foot/leg pain at 21%. There was considerable cross-national variation in pain across European counties, as well as significant socioeconomic inequalities in the prevalence of pain-with social gradients or socioeconomic gaps evident for both men and women; socioeconomic inequalities were most pronounced for hand/arm pain, and least pronounced for back/neck pain. The magnitudes of the socioeconomic pain inequalities differed between countries, but were generally higher for women.
CONCLUSIONS: Future strategies to reduce the burden of pain should acknowledge and consider the associated socioeconomic inequalities of pain to ensure the "pain gap" does not widen.
SIGNIFICANCE: This is a pan European study that has explored socioeconomic inequalities in pain. Across Europe, pain is more prevalent in people of lower socioeconomic position; these pain inequalities were most significant for hand/arm pain, and least significant for back/neck pain.
From the FULL TEXT Article:
Introduction
Chronic pain is a global problem which has a significant impact on patients and their families (through disability, lost work and social isolation), employers, health services and the wider economy (Gureje, Von Korff, Simon, & Gater, 1998; McQuay, 2008; Phillips, 2009). Indeed, recent estimates suggest that, in Denmark, for example, one million working days are lost each year due to chronic pain, while in the United Kingdom, it is suggested that back pain alone costs the economy more than 5 billion per year; similar findings have also been reported throughout Europe (Eriksen, Sjřgren, Bruera, Ekholm, & Rasmussen, 2006; Maniadakis & Gray, 2000). Given these findings, it is no surprise that chronic pain is viewed as a significant public health priority (Goldberg & McGee, 2011). Furthermore, the World Health Organisation (WHO) have recently reclassified—through the International Classification of Diseases (ICD)—chronic pain as a disease in the hope that governments take a new interest in how chronic pain is identified, assessed and managed (ICD, 2018).
The aetiology of chronic pain is complex, and is influenced by a range of biochemical, psychosocial and behavioural factors (Cohen & Mao, 2014; Turk & Okifuji, 2002). Studies have shown that the prevalence of chronic pain is also associated with a range of socioeconomic and sociodemographic factors: increasing age (Rustřen et al., 2005), female sex (Blyth et al., 2001; Fayaz, Croft, Langford, Donaldson, & Jones, 2016) and lower educational status (Azevedo, Costa-Pereira, Mendonça, Dias, & Castro-Lopes, 2013; Dorner et al., 2018; Hagen et al., 2002) are positively associated with the prevalence of chronic pain. It is this complexity that makes chronic pain challenging to manage effectively, with many treatment strategies relying on the use of opioid analgesics, although there are very few studies to support their long-term effectiveness (Jensen, Thomsen, & Hřjsted, 2006; Stannard, 2011).
In the United States, the increased reliance on opioid analgesics has given rise to an “opioid epidemic,” where there has been increasing levels of opioid misuse and related overdoses (Calcaterra, Glanz, & Binswanger, 2013). In view of this well-reported opioid crisis, there is an abundance of literature exploring the prevalence of chronic pain in the United States (e.g. by Johannes, Le, Zhou, Johnston, & Dworkin, 2010), although the prevalence of pain in other countries is less documented. In terms of future planning, it is important to establish the burden of pain so that appropriate resources are provided for health and social services. To date, Breivik, Collett, Ventafridda, Cohen, and Gallacher (2006) provide the most comprehensive indication of the prevalence of chronic pain in Europe—but this study uses data that is from the early 2000s, and does not consider socioeconomic inequalities in pain prevalence. Although there are individual country studies of socioeconomic inequalities of pain (see, for example, the work by Hagen et al., 2005), little is known about differences in socioeconomic inequalities in pain across different European countries. What is lacking is a comprehensive and up-to-date study of the prevalence of pain and socioeconomic inequalities in pain across Europe: both at a wider European-level and at an individual country-level. The objective of this study was, therefore, to provide the first pan-European analysis of the prevalence of pain and socioeconomic inequalities in pain amongst both men and women.
Methods
Data
This study is based on cross-sectional data from the 2014 round of the European Social Survey (ESS) which contained the rotating module “Social inequalities in health and their determinants”—the first comparable, pan-European survey of non-communicable diseases (NCDs) and their determinants in Europe (Eikemo, Bambra, Huijts, & Fitzgerald, 2017). Pain data were available for 19 European countries: Austria, Belgium, Czech Republic, Denmark, Finland, France, Germany, Hungary, Ireland, Lithuania, Netherlands, Norway, Poland, Portugal, Slovenia, Spain, Sweden, Switzerland and the United Kingdom. Specifically, the survey collected data on three pain variables: back/neck pain, hand/arm pain and foot/leg pain; other types of pain variables were not included in the survey. Data were collected via face-to-face interviews with individuals aged 15 years and over living in private households.
The average response level for all countries was 51.6%, ranging from 31.4% in Germany to 68.9% in Lithuania (for more details: see: https://www.europeansocialsurvey.org/docs/round7/survey/ESS7_data_documentation_report_e03_2.pdf. In line with previous studies using earlier ESS rounds, we included only respondents aged 25–74 years in this study (Huijts, Stornes, Eikemo, & Bambra, 2017). We restricted our analyses to this target population since inclusion of all ages would have yielded selectivity problems: people younger than 25 years have often not yet completed their education and people over the age of 75 years represent a very selective group of relatively healthy individuals (Huijts, Monden, & Kraaykamp, 2010). After excluding individuals with missing data on study variables, a total of 27,552 respondents were used for our pooled analysis.
Data were analysed for the three pain variables included in the ESS: back/neck pain (n = 11,032), hand/arm pain (n = 5,954) and foot/leg pain (n = 6,314). Data were collected by providing participants with a list of conditions and asking them to indicate which they had experienced in the last 12 months: muscular or joint pain in the back or neck; muscular or joint pain in the hand or arm; muscular or joint pain in the foot or leg. More information on the data collection, including the full questionnaire that was used, can be found on the ESS website: http://www.europeansocialsurvey.org/. See e-supplement 1 for further information on the analysed sample.
Education was used as the indicator of socioeconomic status (SES). Seven categories were used by the ESS to measure respondents’ highest educational level, reflecting the International Standard Classification of Education (ISCED) (ISCED, 2011). In keeping with other comparative epidemiological studies (Huijts et al., 2010), a low, medium and high education groups were constructed from these categories.
Analysis
Data were age-standardized by weighting up or down the unstandardized (crude) prevalence rates for five-year age groups in each country in accordance with the European Standard Population (ESP) of 2013 (Eurostat, 2013). This is a revision of the commonly used 1976 ESP, which accounts for the fact that the European population is ageing (ISD Scotland, 2014). Data were weighted using post-stratification population weights for the pooled analysis and design weights for the country specific analysis. These weights are reported in the ESS to correct for different population sizes between countries and use information on age-group, gender, education and region to reduce the sampling error and pote7ntial non-response bias of the survey (ESS, 2014). In the pooled analysis, we further accounted for the nesting of individuals within countries by estimating clustered standard errors. We present pooled estimates (percentages) for the combined cross-national sample as well as country-specific results.
For both, a pooled European analysis and country-specific analyses of inequalities in pain by SES, age-adjusted risk differences (ARD) and age-adjusted risk ratios (ARR) were calculated from predicted probabilities generated by means of binary logistic regression (Norton, Miller, & Kleinman, 2013). These analyses separately compared (a) the lower education group with the higher education group (the socioeconomic gap) and (b) the medium education group with the higher education group. ARRs were used in preference to odds ratios, as the latter are likely to be artificially high for more common NCDs (Tajeu, Sen, Allison, & Menachemi, 2012). Moreover, ARRs are calculated from predicted probabilities, which are a preferred estimation method for cross-national comparisons of health inequalities (Beckfield, Olafsdottir, & Bakhtiari, 2013). This is because they do not rely on the assumption that error variance across countries is the same. A social gradient in health was observed when significant differences were observed between either the low or the medium education groups compared to the high education group. When a difference was only observed between the low education group and the high education group, we deemed this a socioeconomic gap (Bambra, 2016). Stata v14.1 was used for all analyses.
Sensitivity analysis
Of the 29,589 observations in our data, 154 (0.5%) had missing covariate and 1883 (6.4%) had missing outcome data. All the analyses presented in this work were based on maximum likelihood estimation, which are valid and unbiased under the assumption of missing at random (Molenberghs & Kenward, 2007). Due to the low proportion of missing covariate data, sensitivity analyses were only performed for the missing outcome data. Dropout models using a generalized linear mixed effect model were fitted on each of the pain outcomes. The results showed significant association between probability of missing with age and education status. Older participants were also more likely to have missing outcome data, as were participants with low educational status, compared to those with higher educational status. The dropout model indicated that the missing mechanism in the outcome data was not likely to be missing completely at random.
To sensitize the assumption of missing not at random, we compared the results from direct likelihood estimation and multiple imputation. Both results should be consistent and similar if the missing mechanism is missing at random. A substantial difference between the two sets of results may indicate missing not at random, suggesting that the results in the paper should be interpreted with caution. As shown in e-supplement 2, the direct likelihood estimation and multiple imputation results are similar and comparable. We, therefore, conclude that the results presented in the paper are unbiased with respect to missing data and the assumption of missing at random appears plausible.
Ethical approval
Ethical approval of this work was not required, as the study used non-patient identifiable secondary data; patients were not actively involved in this research.
Results
Prevalence of pain

Table 1
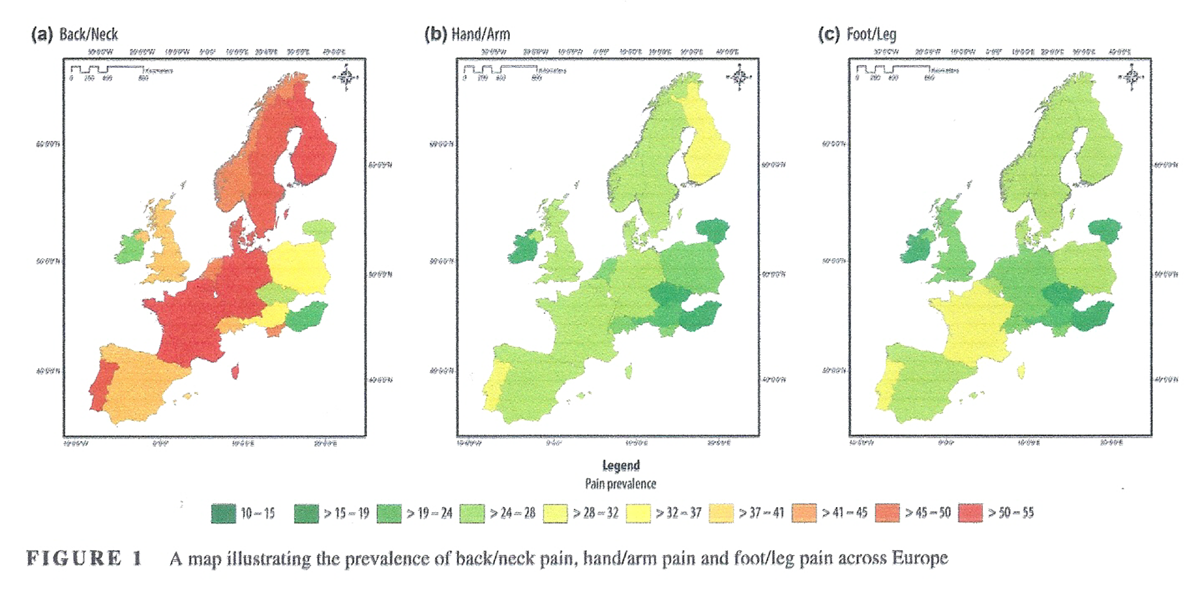
Figure 1
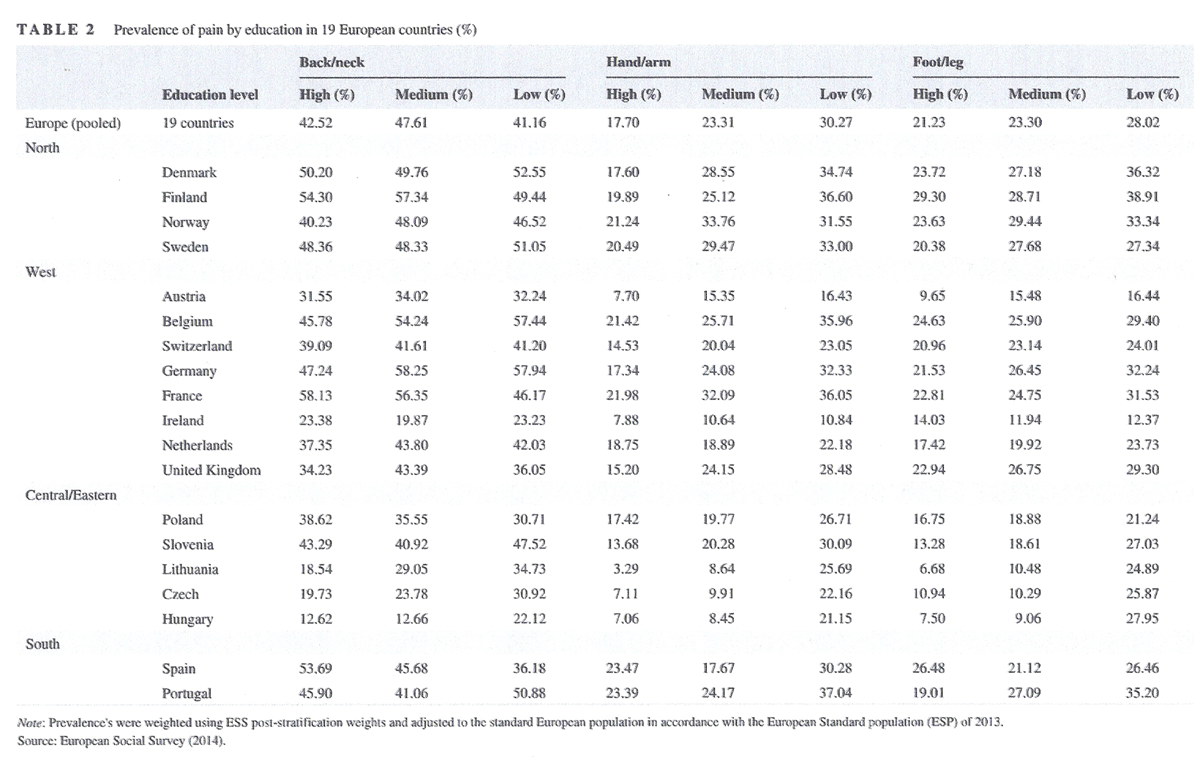
Table 2 Countries were grouped by geographical regions to highlight the regional clustering of estimates that we find for several of the items. The overall prevalence estimates for back/neck pain, hand/arm pain and foot/leg pain, for each country and Europe as a whole is summarized in Table 1, e-supplement 3 and visually in Figure 1. Overall, all three pain conditions affect substantial percentages of the respondents in most countries—an epidemic, yet there are also considerable differences across countries.
Note: Prevalence's were weighted using ESS post-stratification weights and adjusted to the standard European population in accordance with the European Standard population (ESP) of 2013.
Source: European Social Survey (2014).At the pan-European level, around 40% of all respondents reported back/neck pain, 22% hand/arm pain and 21% foot/leg pain. These prevalence rates were generally lower in Central/Eastern Europe (with the exception of Slovenia), compared to the rest of Europe. The prevalence of back/neck pain was highest in Germany (54.05%) and lowest in Hungary (16.08%); hand/arm pain was highest in Finland (31.67%) and lowest in Lithuania (13.00%); foot/leg pain was highest in Portugal (31.84%) and lowest in Lithuania (10.54%). When looking at levels of education, it is clear that, at the pan-European level, people with lower education have higher levels of hand/arm pain, foot/leg pain, but not back/neck pain (Table 2, and e-supplement 4).
Note: Prevalence's were weighted using ESS post-stratification weights and adjusted to the standard European population in accordance with the European Standard population (ESP) of 2013.
Source: European Social Survey (2014).Socioeconomic inequalities in pain
Table 3-A
Table 3-A

Figure 2
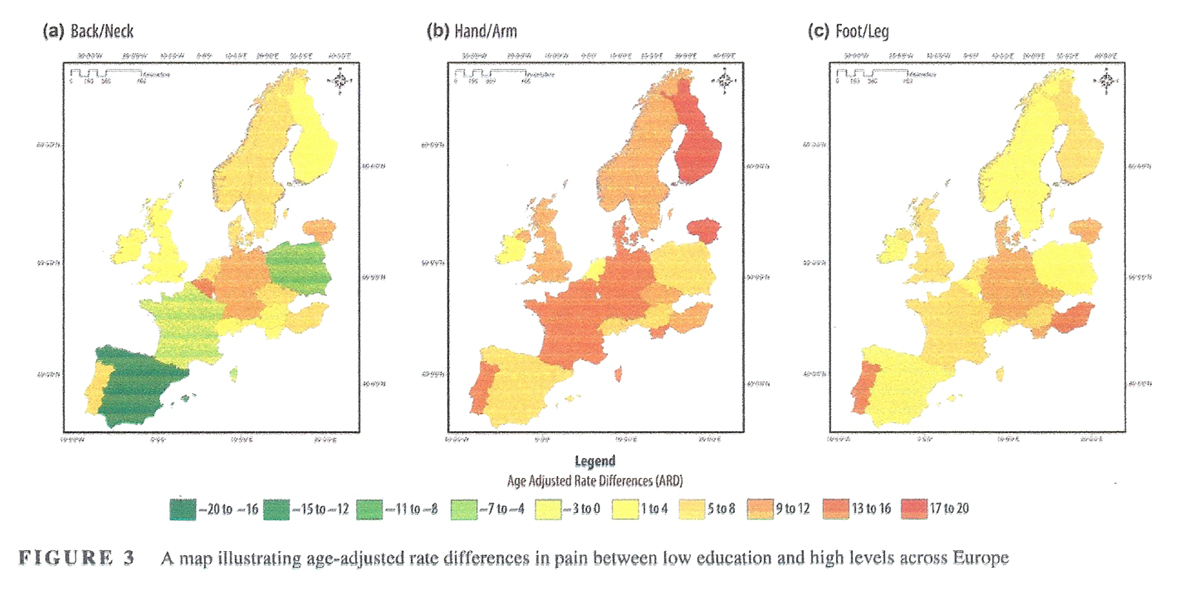
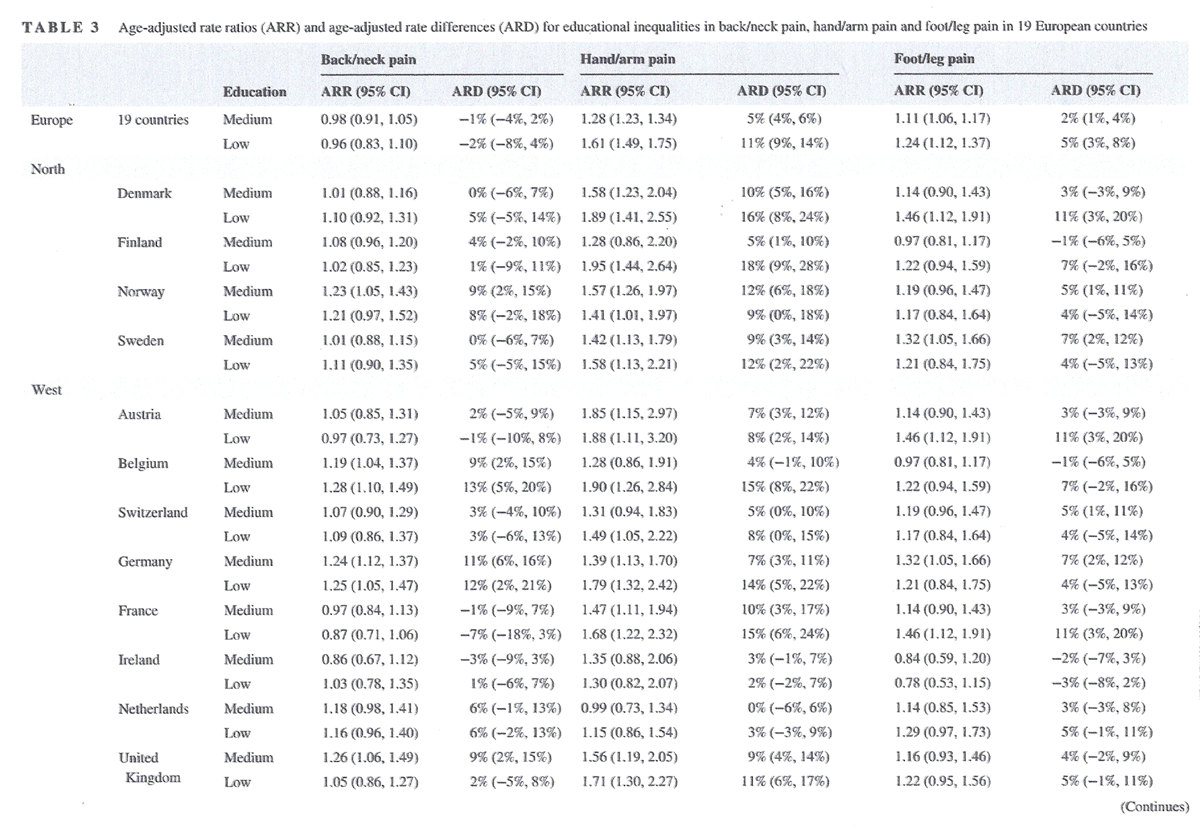
Figure 3 The ARDs and ARRs for prevalence by SES for back/neck pain, hand/arm pain and foot/leg pain, are summarized for men and women together (Table 3, and visually in Figures 2 and 3), and separately (e-supplements 5–7). At the pan-European level, when examining all respondents, a social gradient, in absolute terms (ARD) and in relative terms (ARR), was observed for hand/arm pain—with both the medium education group (ARD 5% [95% CI 4, 6%], and ARR 1.28 [95% CI 1.23, 1.34]) and the low education group (ARD 11% [95% CI 9, 14%], and ARR 1.61 [95% CI 1.49, 1.75]) exhibiting significantly higher prevalence than the high education group (reference). This gradient was also observed for foot/leg pain: the medium education group (ARD 2% [95% CI 1, 4%], and ARR 1.11 [95% CI 1.06, 1.17]) and the low education group (ARD 5% [95% CI 3, 8%], and ARR 1.24 [95% CI 1.12, 1.37]). There was no reported social gradient at the pan-European level for all respondents with respect to back/neck pain.
The majority of countries exhibited significant inequalities in pain, with social gradients present for back/neck pain in three countries (Belgium, Germany, and Lithuania), arm/hand pain in eight countries (Denmark, Finland, Sweden, Austria, Germany, France, United Kingdom, Lithuania) and foot/leg pain in one country (Lithuania). A significant socioeconomic pain gap—between low and high education status—was present in 3 countries (Belgium, Germany, Lithuana) for back pain, in 14 countries for hand/arm pain (Denmark, Finland, Norway, Sweden, Austria, Belgium, Switzerland, Germany, France, United Kingdom, Slovenia, Lithuania, Czech Republic, and Hungary) and in 8 countries for foot/leg pain (Denmark, Austria, France, Slovenia, Lithuania, Czech Republic, Hungary and Portugal).
When analysing men and women separately at the pan-European level, a social gradient was observed in both men and women for hand/arm pain, and in women for foot/leg pain: for hand/arm pain in men, the medium education group (ARD 4% [95% CI 2, 6%], and ARR 1.21 [95% CI 1.10, 1.33]) and the low education group (ARD 8% [95% CI 3, 10%], and ARR 1.45 [CI 95% 1.22, 1.72]), exhibited significantly higher prevalence than the high education group (reference). For hand/arm pain in women, the medium education group (ARD 6% [95% CI 5, 7%], and ARR 1.33 [95% CI 1.26, 1.40]), and the low education group (ARD 14% [95% CI 11, 16%] and ARR 1.72 [95% CI 1.56, 1.89]) exhibited significantly higher prevalence than the high education group. For foot/leg pain in women, the medium education group (ARD 4% [95% CI 2, 5%], and ARR 1.17 [95% CI 1.11, 1.23]) and the low education group (ARD 8% [95% CI 5, 10%], and ARR 1.36 [95% CI 1.24, 1.49]), exhibited significantly higher prevalence than the high education group (reference). There was, however, no social gradient observed at the pan-European level for men or women with respect to back pain.
At the pan-European level, socioeconomic inequalities were higher for women than men for hand/arm pain and foot/leg pain. In terms of individual country level analysis, the socioeconomic pain gap was highest for foot/leg pain in women in Portugal (ARD 23% [95% CI 12, 35%], and ARR 2.24 [95% CI 1.36, 3.69]); for hand/arm pain in women in Finland, (ARD 33% [95% CI 19, 47%], and ARR 2.28 [95% CI 1.93, 4.13]); and, for back/neck pain in men in Portugal (ARD 19% [95% CI 3, 36%], and ARR 1.58 [95% CI 1.00, 2.50]).
Discussion
In this paper, we have used data from the 7th wave of the European Social Survey (2014) to derive the first comprehensive overview of pain in 19 countries across Europe. We have identified several key findings that may be important to practitioners and policy makers: (a) high prevalence rates for all three types of pain were reported across European countries, and for both men and women; at a pan-European level, back pain was the most prevalent with 40% of survey participants experiencing pain within 12 months; then hand/arm pain at 22%, and then foot/leg pain at 21%; (b) there is a considerable cross-national variation in pain across European counties; this finding underlines the importance of using comparative data and conducting comparative research on pain, as generalizing findings from one European country to another could be problematic. Finally, (c) our analysis further indicates that there are significant socioeconomic inequalities in the prevalence of pain—with social gradients or socioeconomic gaps evident for both men and women across Europe; socioeconomic inequalities were most pronounced for hand/arm pain, and least pronounced for back/neck pain. In addition, the magnitudes of the socioeconomic pain inequalities differed between countries, but were generally higher for women.
Our findings correspond with findings from previous studies exploring the prevalence of pain. For example, Breivik et al. (2006), who published the most extensive pain survey at a pan-European level, showed that back pain is the most common site of chronic pain; unlike our survey, neck pain was treated separately in this survey, and was reported in 8% of respondents. Breivik et al. (2006) also reported that pain was more common in women than in men (56% vs. 44%); this finding is in agreement with our study where we also report that pain is more common in women than in men. In terms of socioeconomic inequalities in pain, previous smaller, single country-based studies have shown that pain is more prevalent in people of lower SES; for example, Grossschädl et al. (2016), who examined the prevalence of back pain among adult Austrians according to educational status, showed that the age-standardized prevalence of back pain was highest among adults with a low education level, although when the results were stratified according to sex, the inequality gradient (from low, middle and highly educated) was only evident for men. Importantly, the authors from this paper concluded that education level is an important social indicator for back pain, and the association between back pain and education level is more relevant for men than women.
Similarly, Hagen, Zwart, Svebak, Bovim, and Jacob (2005), who evaluated the relationship between SES and chronic musculoskeletal complaints in Norway, showed that when defining SES by education level, type of occupation, or income, low SES was associated with increased prevalence of chronic musculoskeletal complaints. Previous work from England also showed that chronic pain prevalence, pain intensity—and subsequent opioid utilization—is associated with education status, with people of lower education more likely to have pain; there were also significant inequalities in pain prevalence within England—with evidence of a pain divide between the North and South (Todd et al., 2018). Reasons for lower socioeconomic inequalities in back pain in our study, may be partly explained due to the higher population prevalence: there is some evidence that the magnitude of relative inequalities in mortality and morbidity are negatively correlated with underlying morbidity prevalence and mortality rates (Eikemo, Skalická, & Avendano, 2009).
The finding of socioeconomic inequalities in pain across Europe is also in keeping with other non-communicable diseases, such as some cancers, obesity and cardiovascular disease (Mackenbach et al., 2008). It is possible that the prevalence of pain in European countries may well reflect the underlying presence of non-communicable diseases across Europe (McNamara, Balaj, Thomson, Eikemo, Solheim, et al., 2017). Further, the socioeconomic inequalities in pain detected by this study follow a similar pattern to inequalities in NCDs more generally, and may also reflect underpinning conditions linked to pain. For example, diabetes can cause peripheral neuropathy, while obesity is a risk factor for developing osteoarthritis, especially on weight bearing joints; both of these complications can cause significant pain and discomfort.
This work has important policy implications: our findings reinforce that pain is not a marginal issue, but is an emerging European epidemic, and a major public health concern that is associated with significant “pain inequalities”. Crucially, the magnitude of the pain inequalities was highly variable between countries, which may suggest that there is opportunity to reduce inequalities in pain. In view of our findings, it is important that strategies are developed that seek to manage pain—and the associated complications—from a holistic perspective. Consideration should be given to physical challenges of pain, but also the behavioural, biological and social determinants associated with it. For example, adjusting for poor housing and neighbourhood quality has been shown to reduce SES differences in pain, and other NCDs (McNamara, Balaj, Thomson, Eikemo, & Bambra, 2017). Developing interventions—at a population level—to reduce pain and the inequalities associated with it is thus an important area for future research—particularly if Europe is to avoid a US style opioid epidemic.
This paper provides a unique overview of estimates of pain and inequalities in pain in 19 European countries using a comparable and recent data source (ESS). Nonetheless, there are some limitations to the data presented here. We present the key issues below, but for a fuller discussion of the strengths and weaknesses of the ESS data, see Eikemo et al. (2017). Firstly, all the pain measures included here are self-reported, and only indicate whether a participant has experienced pain in the last 12 months; we did not consider the length, intensity or type of pain, nor did we seek to determine if a participant had a clinical diagnosis of chronic pain. Relatedly, we did not consider multimorbidity in our analysis; it is possible that other chronic conditions could be associated with pain prevalence (e.g. diabetes and neuropathy). Secondly, because the data are based on a survey rather than on register data or other sources that cover information on the full population, caution is needed in translating the estimates presented in this paper into statements about the population prevalence of pain in the countries covered. As with all surveys, it can be questioned whether the data are fully representative for the whole population, and bias may occur due to selective unit non-response (e.g. respondents with physical or mental health problems may have been more likely to refuse participation in the survey) (Fitzgerald & Jowell, 2010; Häder & Lynn, 2007; Saris & Gallhofer, 2007).
Response rates varied across countries, and this issue may have especially affected results for countries with a relatively low response rate (e.g. Germany); however, response rates are one measure of survey quality and in themselves they are not a direct indicator of non-response bias.[43] The ESS sets out high targets for response rates (70 percent) and low rates for non-contacts (3 per cent) as part of its approach of aiming for the standards of the best surveys in Europe (Stoop, Matsuo, Koch, & Billiet, 2010). It should also be noted that the data only cover the non-institutionalized population, which is likely to result in underrepresentation of individuals who are institutionalized due to serious health problems. Thirdly, although the 7th wave of the European Social Survey captures 19 countries from all European regions, several countries were not covered. This means that the estimates presented here cannot be generalized to all European countries, and that repetition and replication of the questions included in this survey is needed to obtain a fully comprehensive overview of pain prevalence in all European countries.
Further, sample sizes in some countries for the SES analysis were quite small. Finally, we only used a single indicator, education, to measure SES. Education is seen as the most comparable indicator for measuring SES across different countries (Eikemo et al., 2008) as it is a fundamental determinant of other indicators of SES including both occupation and income (Lahelma, 2001; Ross & Wu, 1995). Education is a widely applied measure of socioeconomic position and reflects people's material and non-material resources and is fixed rather than fluctuating (as in the case of income for example) (Knesebeck, Verde, & Dragano, 2006). However, it should be noted that using a different indicator of SES, such as occupation or income, or multiple indicators might lead to different patterns of inequalities in pain across Europe. This is something that could be explored further.
Conclusion
This study provides the most up to date overview on the prevalence of pain in Europe and is the first to estimate socioeconomic inequalities in pain across 19 European countries for both men and women. It is clear that a substantial share of the European population experience the burden of pain, but also that the extent to which people experience pain depends strongly on country of residence, gender and SES. Any future strategies to reduce the burden of pain across Europe should acknowledge and consider the associated socioeconomic pain inequalities to ensure the “pain gap” does not widen.
Supporting Information
e-supplement 1 Cases deleted for missing data of: country, pain variables, gender, age and education
E-supplement 2 Sensitivity analysis for missing outcome data based on the comparison between maximum likelihood (GLMM) results and multiple imputations results.
e-supplement 3 Prevalence of pain by gender in 19 European countries (%)
e-supplement 4 Prevalence of Pain by Education and Gender in 19 European countries (%)
e-supplement 5 Age Adjusted Rate Ratios (ARR) and Age Adjusted Rate Differences (ARD) for educational inequalities in back/neck pain amongst men and women in 19 European countries
e-supplement 6 Age Adjusted Rate Ratios (ARR) and Age Adjusted Rate Differences (ARD) for educational inequalities in arm/hand pain amongst men and women in 19 European countries
e-supplement 7 Age Adjusted Rate Ratios (ARR) and Age Adjusted Rate Differences (ARD) for educational inequalities in foot/leg pain amongst men and women in 19 European countriesCorrespondence
Adam Todd, School of Pharmacy,
Faculty of Medical Sciences,
Newcastle University,
Newcastle upon Tyne NE2 4AX, UK.
adam.todd@newcastle.ac.uk
Funding
This article is part of the HiNEWS project—Health Inequalities in European Welfare States—funded by NORFACE (New Opportunities for Research Funding Agency Cooperation in Europe) Welfare State Futures programme (grant reference:462-14-110). For more details on NORFACE, see http://www.norfa ce.net/11.
References:
Azevedo, L., Costa-Pereira, A., Mendonça, L., Dias, C., & Castro-Lopes, J. (2013).
A population-based study on chronic pain and the use of opioids in Portugal.
Pain, 154(12), 2844–2852.
https://doi.org/10.1016/j.pain.2013.08.022Bambra, C. (2016).
Health divides: Where you live can kill you.
Bristol: Policy Press. 1447330358.Beckfield, J., Olafsdottir, S., & Bakhtiari, E. (2013).
Health inequalities in global context.
American Behavioral Scientist, 57(8), 1014–1039.
https://doi.org/10.1177/0002764213487343Blyth, F. M., March, L. M., Brnabic, A. J., Jorm, L. R., Williamson, M., & Cousins, M. J. (2001).
Chronic pain in Australia: A prevalence study.
Pain, 89 (2–3), 127–134. https://doi.org/10.1016/S0304-3959(00)00355-9Breivik, H., Collett, B., Ventafridda, V., Cohen, R., & Gallacher, D. (2006).
Survey of chronic pain in Europe: Prevalence, impact on daily life, and treatment.
European Journal of Pain, 10(4), 287–333.
https://doi.org/10.1016/j.ejpain.2005.06.009Calcaterra, S., Glanz, J., & Binswanger, I. A. (2013).
National trends in pharmaceutical opioid related overdose deaths compared to other substance related deaths: 1999–2009.
Drug and Alcohol Dependence, 131(3), 263–270.Classification of Diseases (ICD) (2018).
World Health Organization. Retrieved from
https://www.who.int/classifications/icd/en/.Cohen, S. P., & Mao, J. (2014).
Neuropathic pain: Mechanisms and their clinical implications.
BMJ, 348, f7656.
https://doi.org/10.1136/bmj.f7656Dorner, T. E., Stein, K. V., Hahne, J., Wepner, F., Friedrich, M., & Mittendorfer-Rutz, E. (2018).
How are socio-demographic and psycho-social factors associated with the prevalence and chronicity
of severe pain in 14 different body sites? A cross-sectional population-based survey.
Wiener Klinische Wochenschrift, 130(1–2), 14–22.
https://doi.org/10.1007/s00508-017-1223-xEikemo, T. A., Bambra, C., Huijts, T., & Fitzgerald, R. (2017).
The first pan-European sociological health inequalities survey of the general population:
The European Social Survey rotating module on the social determinants of health.
European Sociological Review, 33, 137–153.Eikemo, T. A., Huisman, M., Bambra, C., & Kunst, A. (2008).
Health inequalities according to educational level under different welfare regimes:
A comparison of 23 European countries.
Sociology of Health & Illness, 30(4), 565–582.Eikemo, T. A., Skalická, V., & Avendano, M. (2009).
Variations in relative health inequalities: Are they a mathematical artefact?
International Journal for Equity in Health, 8(1), 32.
https://doi.org/10.1186/1475-9276-8-32Eriksen, J., Sjřgren, P., Bruera, E., Ekholm, O., & Rasmussen, N. K. (2006).
Critical issues on opioids in chronic non-cancer pain: An epidemiological study.
Pain, 125(1–2), 172–179.
https://doi.org/10.1016/j.pain.2006.06.009European Social Survey. (2014).
Retrieved from http://www.europeansocialsurvey.org/Eurostat. (2013).
Revision of the European standard population: Report of Eurostat's Task Force (2013 ed.).
Luxembourg: Publications Office of the European Union. Retrieved from
http://ec.europa.eu/eurostat/en/web/products-manuals-and-guidelines/-/KS-RA-13-028Fayaz, A., Croft, P., Langford, R. M., Donaldson, L. J., & Jones, G. T. (2016).
Prevalence of chronic pain in the UK: A systematic review and meta-analysis of population studies.
British Medical Journal Open, 6(6), e010364.
https://doi.org/10.1136/bmjopen-2015-010364Fitzgerald, R., & Jowell, R. (2010).
Measurement equivalence in comparative surveys: The European Social Survey –
From design to implementation and beyond.
In J. A. Harkness, M. Braun, B. Edwards, T. P. Johnson, L. Lyberg, P. Mohler, & T. W. Smith (Eds.),
Cross-cultural survey methods (pp. 485–495).
London: Wiley.Goldberg, D. S., & McGee, S. J. (2011).
Pain as a global public health priority.
BMC Public Health, 11(1), 770.
https://doi.org/10.1186/1471-2458-11-770Grossschädl, F., Stolz, E., Mayerl, H., Rásky, É., Freidl, W., & Stronegger, W. (2016).
Educational inequality as a predictor of rising back pain prevalence in Austria-sex differences.
European Journal of Public Health, 26(2), 248–253.
https://doi.org/10.1093/eurpub/ckv163Gureje, O., Von Korff, M., Simon, G. E., & Gater, R. (1998).
Persistent pain and well-being: A World Health Organization study in primary care.
JAMA, 280(2), 147–151.
https://doi.org/10.1001/jama.280.2.147Häder, S., Lynn, J. A. (2007).
How representative can a multi-nation survey be?
In R. Jowell, C. Roberts, R. Fitzgerald, & G. Eva (Eds.),
Measuring attitudes cross-nationally: Lessons from the European Social Survey (pp. 33–52).
London: Sage.Hagen, K., Vatten, L., Stovner, L. J., Zwart, J. A., Krokstad, S., & Bovim, G. (2002).
Low socio-economic status is associated with increased risk of frequent headache:
A prospective study of 22718 adults in Norway.
Cephalalgia, 22(8), 672–679.
https://doi.org/10.1046/j.1468-2982.2002.00413.xHagen, K., Zwart, J. A., Svebak, S., Bovim, G., & Jacob, S. L. (2005).
Low socioeconomic status is associated with chronic musculoskeletal complaints among 46,901 adults in Norway.
Scandinavian Journal of Public Health, 33(4), 268–275.
https://doi.org/10.1080/14034940510005699Huijts, T., Monden, C. W. S., & Kraaykamp, G. (2010).
Education, educational heterogamy, and self-assessed health in Europe: A multilevel study of
spousal effects in 29 European Countries.
European Sociological Review, 26(3), 261–276.
https://doi.org/10.1093/esr/jcp019Huijts, T., Stornes, P., Eikemo, T. A., & Bambra C. (2017).
Prevalence of physical and mental non-communicable diseases in Europe:
Findings from the European Social Survey (2014) special module on the social determinants of health.
European Journal of Public Health, 27(suppl_1), 8–13.International Classification of Disease 11th Edition. (2018)
World Health Organisation. Retrieved from https://icd.who.intInternational Standard Classification of Education. (2011).
UNESCO Institute of Statistics. Retrieved from
http://uis.unesco.org/sites/default/files/documents/international-standard-classification-of
-education-isced-2011-en.pdfISD Scotland. (2014).
Standard population. Retrieved from
http://www.isdscotland.org/Products-and-Services/GPD-Support/Population/Standard-Populations/Jensen, M., Thomsen, A., & Hřjsted, J. (2006).
10-year follow-up of chronic non-malignant pain patients: Opioid use, health related quality of life
and health care utilization.
European Journal of Pain, 10(5), 423–433.
https://doi.org/10.1016/j.ejpain.2005.06.001Johannes, C. B., Le, T. K., Zhou, X., Johnston, J. A., & Dworkin, R. H. (2010).
The prevalence of chronic pain in United States adults: Results of an Internet-based survey.
The Journal of Pain, 11(11), 1230–1239.
https://doi.org/10.1016/j.jpain.2010.07.002Knesebeck, O. V. D., Verde, P. E., Dragano, N. (2006).
Education and health in 22 European countries.
Social Science and Medicine, 63, 1344–1351.Lahelma, E. (2001).
Health and social stratification. In W. C. Cockerham (Ed.),
The Blackwell companion to medical sociology (pp. 64–93).
Oxford: Blackwell.Mackenbach, J. P., Stirbu, I., Roskam, A. J., Schaap, M. M., Menvielle, G. (2008).
European Union working group on socioeconomic inequalities in health. Socioeconomic inequalities
in health in 22 European countries.
New England Journal of Medicine, 358(23), 2468–2481.
https://doi.org/10.1056/NEJMsa0707519Maniadakis, N., & Gray, A. (2000).
The economic burden of back pain in the UK. Pain, 84(1), 95–103.
https://doi.org/10.1016/S0304-3959(99)00187-6McNamara, C. L., Balaj, M., Thomson, K. H., Eikemo, T. A., & Bambra C. (2017).
The contribution of housing and neighbourhood conditions to educational inequalities in
non-communicable diseases in Europe: Findings from the European Social Survey (2014)
special module on the social determinants of health.
European Journal of Public Health, 27(suppl_1): 102–106.McNamara, C. L., Balaj, M., Thomson, K. H., Eikemo, T. A., Solheim, E. F (2017).
The socioeconomic distribution of non-communicable diseases in Europe: Findings from the European Social
Survey (2014) special module on the social determinants of health.
European Journal of Public Health, 27(suppl_1), 22–26.McQuay, H. (2008).
Management of chronic pain: Help and hope at the bottom of the pile.
BMJ, 336(7650), 954–955.
https://doi.org/10.1136/bmj.39520.699190.94Molenberghs, G., & Kenward, M. G. (2007).
Missing data in clinical studies.
Hoboken, NJ: Wiley. ISBN 9780470849811Norton, E. C., Miller, M. M., & Kleinman, L. C. (2013).
Computing adjusted risk ratios and risk differences in Stata.
Stata Journal., 13(3), 492–509.
https://doi.org/10.1177/1536867X1301300304Phillips, C. J. (2009).
The cost and burden of chronic pain.
Reviews in Pain, 3(1), 2–5.
https://doi.org/10.1177/204946370900300102Ross, C. E., & Wu, C. (1995).
The links between education and health.
American Sociological Review, 60, 719–745.
https://doi.org/10.2307/2096319Rustřen, T., Wahl, A. K., Hanestad, B. R., Lerdal, A., Paul, S., & Miaskowski, C. (2005).
Age and the experience of chronic pain: Differences in health and quality of life among younger, middle-aged,
and older adults.
Clinical Journal of Pain, 21(6), 513–523.
https://doi.org/10.1097/01.ajp.0000146217.31780.efSaris, W., & Gallhofer, I. (2007).
Questions travel successfully?
In R. Jowell, C. Roberts, R. Fitzgerald, & G. Eva (Eds.),
Measuring attitudes cross-nationally: Lessons from the European Social Survey (pp. 1–31).
London: Sage.Stannard, C. (2011).
Opioids for chronic pain: Promise and pitfalls.
Current Opinion in Supportive and Palliative Care, 5, 150–157.
https://doi.org/10.1097/SPC.0b013e3283458fbcStoop, I., Matsuo, H., Koch, A., & Billiet, J. (2010).
Paradata in the European Social Survey: Studying nonresponse and adjusting for bias.
Paper presented at the JSM Proceeding, Vancouver.Tajeu, G. S., Sen, B., Allison, D. B., & Menachemi, N. (2012).
Misuse of odds ratios in obesity literature: An empirical analysis of published studies.
Obesity., 20(8), 1726–1731.
https://doi.org/10.1038/oby.2012.71Todd, A., Akhter, N., Cairns, J. M., Kasim, A., Walton, N., Ellison, A., Bambra, C. (2018).
The pain divide: A cross-sectional analysis of chronic pain prevalence, pain intensity, and opioid utilisation in England.
British Medical Journal Open, 8, e023391.
https://doi.org/10.1136/bmjopen-2018-023391Turk, D. C., & Okifuji, A. (2002).
Psychological factors in chronic pain: Evolution and revolution.
Journal of Consulting and Clinical Psychology, 70(3),678–690.
https://doi.org/10.1037//0022-006X.70.3.678
Return to SPINAL PAIN MANAGEMENT
Since 10-28-2019


| Home Page | Visit Our Sponsors | Become a Sponsor |
Please read our DISCLAIMER |