

Global, Regional and National Burden of Low Back Pain
1990-2019: A Systematic Analysis of the Global
Burden of Disease Study 2019This section is compiled by Frank M. Painter, D.C.
Send all comments or additions to: Frankp@chiro.org


FROM: J Orthop Translat 2021 (Sep 10); 32: 49–58 ~ FULL TEXT
OPEN ACCESS Sheng Chen, Mingjue Chen, Xiaohao Wu, Sixiong Lin, Chu Tao, Huiling Cao, Zengwu Shao, and Guozhi Xiao
Department of Orthopaedics,
Union Hospital, Tongji Medical College,
Huazhong University of Science and Technology,
Wuhan, 430022, China.

Background: To comprehensively analyze the global level and trends of prevalence, incidence and years lived with disability (YLDs) for low back pain (LBP) from 1990 to 2019 by age, sex and sociodemographic index (SDI).
Methods: Publicly available modelled data and methods were obtained from the Global Burden of Diseases (GBD) study 2019, and used to evaluate the global burden of LBP through a systematic analysis.
Results: Globally, the age-standardized prevalence, incidence and YLDs rate of LBP were slightly decreased from 1990 to 2019, but the number of the prevalent cases, incident cases and YLDs had substantially increased, and LBP remains the leading cause of YLDs in 2019 worldwide. The number of prevalent cases was increased with age and peaked at the age of 45-54 years for both sexes, and the global prevalence rate was higher in females than in males and increased with age, peaking at the 80-84 age group in both sexes in 2019. Overall, a positive association between the age-standardized YLD rate and SDI was observed over the past thirty years. At the national revel, the United States, Denmark and Switzerland had the three highest levels of age-standardized prevalence, while Zambia, Zimbabwe and Canada showed the highest increase in the age-standardized prevalence during 1990-2019.
Conclusions: LBP is a major public health issue globally, and its burden remains high. Increasing population awareness about its risk factors and preventive measures for LBP are needed to reduce the future burden of this condition.
The translational potential of this article: Due to the high prevalence and heavy burden of LBP globally, it is important to update its epidemiological data. This systematic analysis provides researchers and healthcare policy makers with up-to-date, comprehensive and comparable information on global LBP burden, which is of clinical translational significance.
Keywords: Epidemiological science; Global burden; Low back pain.
From the FULL TEXT Article:
Introduction
Low back pain (LBP) is defined by the pain, stiffness or muscle tension located typically between the margin of the lower rib and the buttock creases, with or without sciatica (pain radiating from the buttock and downward along the course of the sciatic nerve). [1, 2] LBP is a common musculoskeletal symptom, which occurs in all countries from developing countries to developed countries, all age groups from children to the elderly population, and almost everyone during the lifetime with acute episode or chronic condition. [1, 3] LBP can seriously affect the quality of life, and has become the leading cause of years lived with disability (YLDs) worldwide (64.9 million), when compared with diabetes (38.6 million), chronic obstructive pulmonary disease (30.6 million) and other chronic diseases or disorders in 2017. [4, 5] Given the high prevalence and heavy burden of LBP globally, it is important to update the epidemiological data for researchers and healthcare policy makers.
In the last ten years, the burden of LBP has been reported in several review articles based on a few national studies, but there was no detailed information about all countries. [6–8] One study analyzed the global burden of five common musculoskeletal disorders using the Global Burden of Disease (GBD) Study 2017, but it did not specifically focus on LBP. [9] In addition, the worldwide LBP burden was reported in two studies using the GBD Study 2010 and 2017, respectively, but neither of them included the country-level information and analyzed the LBP burden by sociodemographic index (SDI), and the estimates need to be updated timely. [10, 11] Therefore, this study systematically analyzes the modelled global-, regional- and national-level prevalence, incidence and YLDs of LBP using the publicly available modelled data in the GBD Study 2019 by age, sex and SDI, and provides the most up-to-date, comprehensive and comparable information on global LBP burden.
Materials and methods
Overview
The GBD Study 2019 is performed by the Institute of Health Metrics and Evaluation (IHME) and follows the Guidelines for Accurate and Transparent Health Estimates Reporting (GATHER) statement. To date, GBD Study 2019 is the most up-to-date and comprehensive effort to describe the global epidemiological levels and trends of diseases and injuries. GBD study 2019 systematically analyzed 369 diseases and injuries, 286 fatal causes, 364 non-fatal causes and 87 risk factors in 204 countries and territories. The general methodology to estimate the disease burden for GBD study 2019 is the same as for GBD study 2017. When compared to previous studies, the methodology used in GBD study 2019 has been significantly improved by analyzing data from more countries, including new causes that induce LBP, improving the measurement methods and redistribution algorithms, increasing coverage of uncertainty intervals (UIs), revising processing of clinical informatics data, adopting new standard locations, increasing available data sources, etc. The detailed information has been showed in previous publication and can be found at http://ghdx.healthdata.org/gbd-results-tool and https://vizhub.healthdata.org/gbd-compare/. [12] All data were presented as counts and age-standardized rates per 100,000 population with UIs.
Case definition and data sources
In the GBD study 2019, LBP is defined as pain on the posterior aspect of the body ranging from the lower margin of the twelfth ribs to the lower gluteal folds, with or without pain involving one or both lower limbs, and the pain should last for at least one day. [12]
PubMed, Embase, CINAHL, and Ovid Medline electronic databases were searched for GBD study 2017 by IHME to end of October 2017, and eight studies were included in the last systematic review. [5] The search criteria, including age, sex and language, were not restricted. The terms “back pain”, “backache”, “back ache”, “lumbago” and “lumbar pain” were individually searched and combined with each of the following: “epidemiology”, “incidence”, “prevalence” and “cross-sectional”.
The following exclusion criteria were used:(1) sub-populations clearly not representative of the national population;
(2) not a population-based study;
(3) sample size <150;
(4) review.Extra information was obtained from unit record data of surveys in the GBD's repository of population health data (GHDx), which included the world and national health surveys. Opportunistically, the latest studies encountered during literature review were added in GBD 2019. Besides, data from the United States claims data for 2000, 2010–2012, and 2014–2016 by state were included. GBD then reported the prevalence of LBP based on 463 measures. Only 103 out of 204 countries and territories provided data for assessing the prevalence of LBP. [12]
Data processing and disease model
The reported prevalence estimates were split by sex and age as much as possible. For studies reporting prevalence with broad age groups for sexes separated or specific age groups for both sexes combined, the age-specific data were split by sex using the within-study sex ratio and uncertainty bounds. For studies reporting prevalence estimates for both sexes that could not be split using the reported ratio, the data were split by sex using the sex ratio obtained from meta-analysis of the within-study sex-specific data via Meta Regression-Bayesian, Regularized Trimmed (MR-BRT). The ratio of female to male was 1.18. After using bias adjustments, studies that reported data across age groups spanning 25 years or more were split into five-year age groups by using the prevalence age pattern estimated through a Bayesian metaregression tool, DisMod-MR 2.112.
Bias was corrected in studies that defined LBP with too broad anatomical area, recall periods of 1 week to 1 month and 2 months to 1 year, episode duration more than 3 months, activity limitation, together with studies performed among schoolchildren. Three additional covariates were added for claims data in the United States from the year 2000 and from 2010 onward and in Taiwan (province of China). Because it was unable to find matches for Taiwan to form a reliable MR-BRT network crosswalk, the claims data of Taiwan were not included in the final model. After data adjustment for case definition, outlier data were culled in a systematic way. Excess mortality in the DisMod model was set to 0, and it was assumed that no incident or prevalent LBP before the age of five. Summary exposure value (SEV) scalar was included for LBP as a country covariate, which combined the exposure measures for risks estimated to seriously affect LBP in GBD, such as increased body mass index (BMI) and occupational ergonomic exposure. The boundary values of SEV were set as 0.75 to 1.25. Detailed information about data processing and disease model can be found elsewhere. [12]
Severity and years lived with disability
The GBD disability weight evaluation is based on the lay descriptions of sequelae emphasizing major functional symptoms and consequences. The lay descriptions and disability weights for LBP severity levels are shown in Supplementary Table S1.
The severity distributions of LBP are obtained from the analysis of the Medical Expenditure Panel Surveys (MEPS), which is a continuous and overlapping survey of the United States community dwelling population. [12] The main purpose of MEPS is to collect the data about use and cost of healthcare. Each panel lasts for two years and conducted in five rounds, typically containing 30,000 to 35,000 individual respondents.
Respondents aged 18 years and older self-administer the SF-12 for two times in one panel, at rounds 2 and 4, usually about a year apart. Information about diagnoses on the basis of self-report of causes for encounters with health services was also usually collected by MEPS. Additionally, diagnoses can be derived through additional questions on “problems that bother you” and conditions that resulted in “disability days”. Then, the verbatim text was translated into three-digit international classification of diseases (ICD) codes by professional coders. The ICD codes for LBP are 724.2 (ICD-9) and M54.5 (ICD-10). The severity distribution for LBP with and without leg pain was derived from MEPS. USA claims data (2012) were used to derive the proportion of cases with LBP who reported leg pain. The proportions of LBP with leg pain were different by age group. The proportion in each severity level and each age group was acquired by multiplying the proportion in the severity level and the proportion of LBP with or without leg pain.
As no evidence for mortality from LBP was found in the GBD Study, the YLDs and disability-adjusted life years (DALYs) values were the same. In this study, the term YLDs was used. At every computed step, uncertainty was incorporated by sampling 1000 draws combining uncertainty derived from a variety of sources, which included input data, estimates of residual non-sampling error and corrections of measurement error. The 95% UI was defined as the 2.5th and 97.5th ranked draws. [13]
Complementary analyses
To determine the shape of the association between LBP burden measured as YLDs and SDI for all GBD regions and 204 countries and territories from 1990 to 2019, smoothing splines models were established. SDI is a comprehensive evaluation index to identify the developing status of countries and territories, which includes gross domestic product (GDP) per capita that has been smoothed over the past ten years, total fertility rate under the age of twenty-five, and average years of schooling for the population with age more than fifteen years old. SDI is expressed on a scale of 0 (less developed) to 1 (most developed). Excel version 2019 and ArcMap version 10.2 were applied to draw figures of estimates of prevalence, incidence and YLDs using data available from GBD study 2019.
Results
The burden of low back pain at global level

Table 1
page 4+5Globally, there were 568.4 million (95% UI 505.0 to 640.6 million) prevalent cases of LBP in 2019, with an age-standardized point prevalence estimate of 6972.5 (95% UI 6190.5 to 7860.5) per 100,000 population. There was a slight decrease of –0.164% (95% UI –0.171% to –0.156%) from 1990 to 2019. Besides, the number of incident cases for LBP globally was about 223.5 million (95% UI 197.7 to 253.0 million) with an age-standardized annual incidence rate of 2748.9 (95% UI 2425.8 to 3106.9), and there was a slight decrease of –0.133% (95% UI –0.139% to –0.126%) between 1990 and 2019 (Table 1). Moreover, 63.7 million (95% UI 45.0 to 85.2) YLDs were caused by LBP, with an age-standardized rate per 100,000 population of 780.2 (95% UI 549.3 to 1046.1) YLDs. Although the age-standardized YLD rate of LBP was decreased by –0.163% (95% UI –0.171% to –0.155%) since 1990, LBP was still the leading cause of age-standardized YLD rate globally (Table 1).
The burden of low back pain at regional level
The age-standardized prevalence per 100,000 of LBP in 2019 was highest in high-income North America (12314.6 (95% UI 11322.5 to 13367.9)), central Europe 9982.0 (95% 8822.9 to 11299.0)) and high-income Asia Pacific (9493.2 (95% UI 8298.9 to 10825.8)). Conversely, East Asia (5222.7 (95% UI 4625.2 to 5881.0)), South Asia (5485.6 (95% UI 4831.9 to 6219.0)) and Southern Sub-Saharan Africa (5776.0 (95% UI 5108.2 to 6542.9)) had the lowest age-standardized prevalence estimates (Table 1).
Central Europe (4106.3 (95% UI 3639.7 to 4642.9)), Oceania (3845.3 (95% UI 3419.3 to 4347.8)) and Eastern Europe (3820.5 (95% UI 3396.8 to 4291.7)) had the highest LBP age-standardized incidence rates, while the rates were lowest in East Asia (2317.4 (95% UI 2050.7 to 2613.8)), South Asia (2362.1 (95% UI 2078.4 to 2684.0)) and Southern Latin America (2391.1 (95% UI 2085.3 to 2715.7)) (Table 1).
High-income North America (1362.1 (95% UI 975.7 to 1800.2)), central Europe (1127.0 (95% UI 788.5 to 1509.6)) and high-income Asia Pacific (1080.5 (95% UI 751.0 to 1464.9)) had the highest age-standardized YLD rates in 2019, while East Asia (589.1 (95% UI 418.5 to 790.7)), South Asia (603.5 (95% UI 427.0 to 809.8)) and Southern Sub-Saharan Africa (638.8 (95% UI 452.3 to 853.4)) had the lowest age-standardized YLD rates (Table 1). The age-standardized prevalence and incidence estimates for all GBD regions by sex in 2019 are presented in Supplementary Figs. S1 and S2.
The percentage of changes in age-standardized prevalence estimates from 1990 to 2019 varied across all the GBD regions in 2019. As can be seen from Table 1, most regions displayed a decreasing trend. Thereinto, East Asia (–0.285% (95% UI –0.302% to –0.267%)), South Asia (–0.222% (95% UI –0.238% to –0.207%)) and high-income Asia Pacific (–0.124% (95% UI –0.135% to –0.110%)) showed the highest decreasing trends. Meanwhile, these regions also ranked top three with decreasing trends in age-standardized incidence and YLD rates. Some regions had a slight increasing trend. Tropical Latin America showed the highest increasing trends in age-standardized prevalence (0.010% (95% UI –0.003%–0.022%)), incidence (0.004% (95% UI –0.005%–0.014%)) and YLD rates (0.015% (95% UI 0.000–0.029%)) (Table 1). Supplementary Figs. S3 and S4 presented the age-standardized prevalence estimates and incidence rate by sex during 1990–2019.
Of note, there was a remarkable increase in the number of prevalent cases from 1990 (386.0 million (95% UI 342.7 to 434.5 million)) to 2019 (568.4 million (95% UI 505.0 to 640.6 million)), and the GBD regions contributing to this increase in 2019 were different from the regions in 1990 (Supplementary Fig. S5, Supplementary Table S2). Likewise, there was also an obvious increase in the number of incident cases from 1990 (149.3 million (95% UI 131.3 to 169.2 million)) to 2019 (223.5 million (95% UI 197.7 to 253.0 million)) with different contributing regions between 2019 and 1990 (Supplementary Fig. S6, Supplementary Table S3).
The burden of low back pain at national level

Figure 1 Age-standardized prevalence estimates for LBP per 100,000 population ranged from 5134.7 to 12706 cases in 2019 (Figure 1, Supplementary Table S2). Results revealed that the United States (12706 (95% UI 11718.1 to 13778.9)), Denmark (11082.3 (95% UI 9681.3 to 12714.3)) and Switzerland (10621.2 (95% UI 9303.4 to 12069.4)) had the highest age-standardized prevalence estimates in 2019. China (5134.7 (95% UI 4548.5 to 5787)), India (5246.5 (95% UI 4613.5 to 5943.6)) and Ghana (5503.8 (95% UI 4932.5 to 6108.6)) had the lowest age-standardized prevalence estimates. In addition, results showed that the percentage of change in age-standardized prevalence estimates varied substantially among countries between 1990 and 2019. Zambia (0.113% (95% UI 0.065%–0.16%)), Zimbabwe (0.066% (95% UI 0.018%–0.113%)) and Canada (0.064% (95% UI –0.06%–0.203%)) showed the largest increases. China (–0.291% (95% UI –0.309% to –0.272%)), India (–0.267% (95% UI –0.286% to –0.25%)) and Switzerland (–0.25% (95% UI –0.334% to –0.158%)) showed slightly decreasing trends (Fig. 1, Supplementary Table S2).
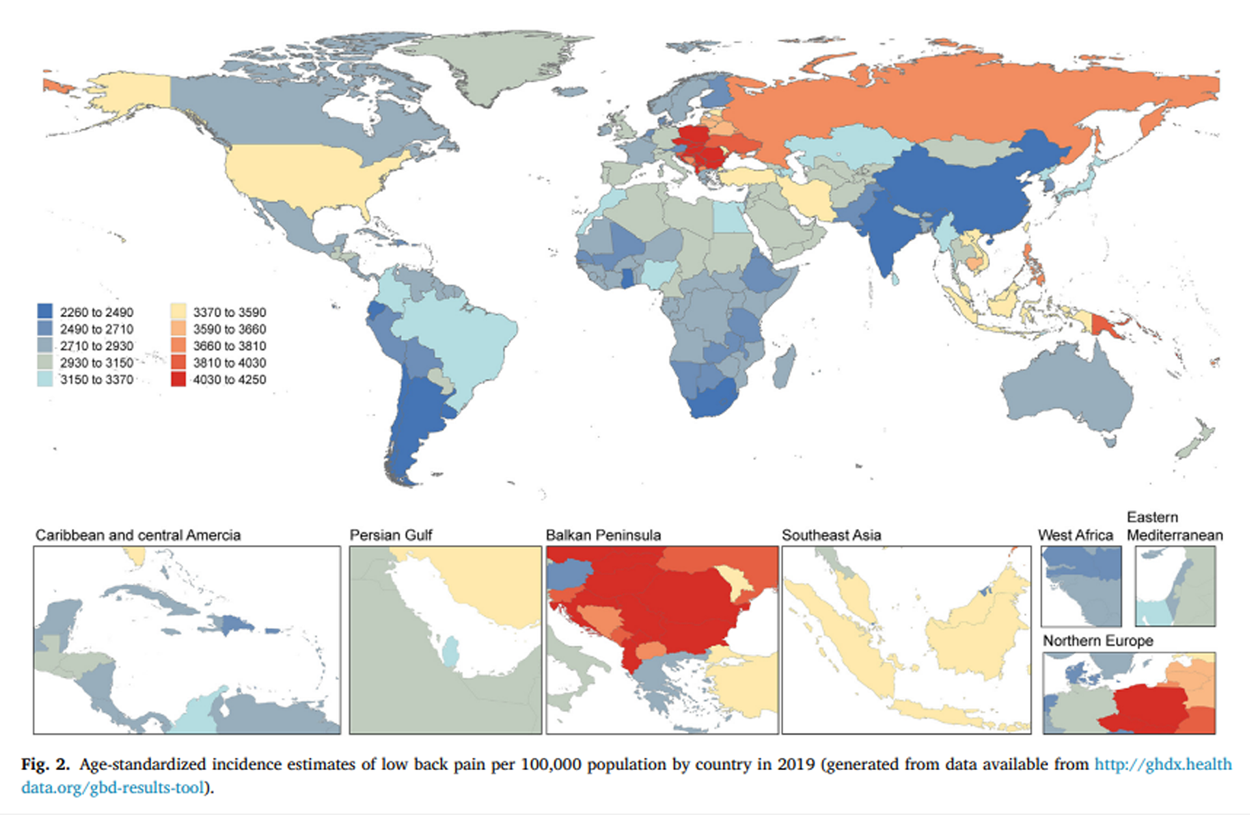
Figure 2 Age-standardized incidence rates per 100,000 population for LBP varied from 2268.6 to 4179.4 cases in 2019 (Fig. 2, Supplementary Table S3). Poland (4179.4 (95% UI 3702.2 to 4717.4)), Vanuatu (4160.1 (95% UI 3700.6 to 4674.5)) and Romania (4140.4 (95% UI 3651.6 to 4697)) showed the highest age-standardized incidence rates in 2019. India (2268.6 (95% UI 1998.3 to 2574.7)), China (2280.7 (95% UI 2017.2 to 2572.6)) and Singapore (2371.3 (95% UI 2056 to 2714.3)) had the lowest age-standardized incidence rates. Zambia (0.081% (95% UI 0.046%–0.116%)), Mali (0.047% (95% UI 0.016%–0.084%)) and Canada (0.047% (95% UI –0.072%–0.163%)) displayed the largest increases in age-standardized incidence rates from 1990 to 2019. China (–0.282% (95% UI –0.297% to –0.266%)), India (–0.24% (95% UI –0.256% to –0.225%)) and Taiwan (Province of China) (–0.164% (95% UI –0.235% to –0.096%)) showed the largest decreases in age-standardized incidence rates from 1990 to 2019 (Figure 2, Supplementary Table S3).
The top three countries with highest age-standardized prevalence estimates of LBP in 2019 also had the highest age-standardized YLD rates. India (575 (95% UI 407.5 to 773.4)), China (579.1 (95% UI 411.6 to 778.1)) and Eswatini (614.7 (95% UI 439.8 to 825.1)) showed the lowest age-standardized YLD rates (Supplementary Fig. S7 and Table S4). The top three countries with largest increases in age-standardized incidence rates of LBP from 1990 to 2019 also had the largest increases in age-standardized YLD rates. China (–0.29% (95% UI –0.308% to –0.27%)), India (–0.266% (95% UI –0.285% to –0.248%)) and Switzerland (–0.247% (95% UI –0.332% to –0.151%)) showed the largest decreases in age-standardized YLD rates of LBP from 1990 to 2019 (Supplementary Table S4).
Age and sex patterns of low back pain

Figure 3
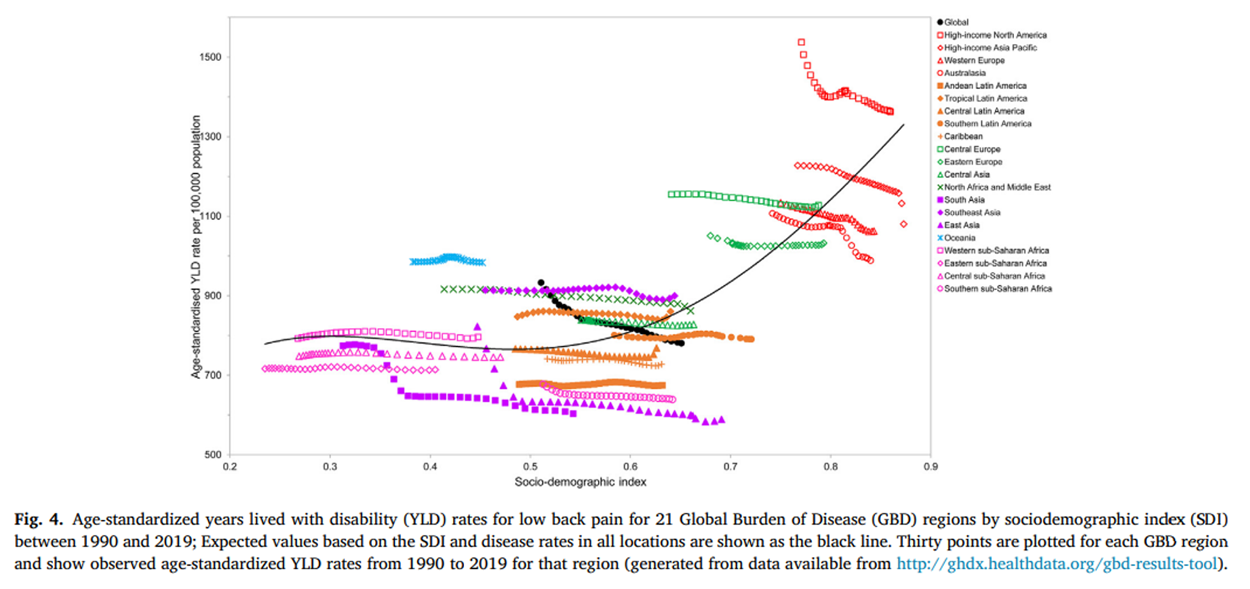
Figure 4
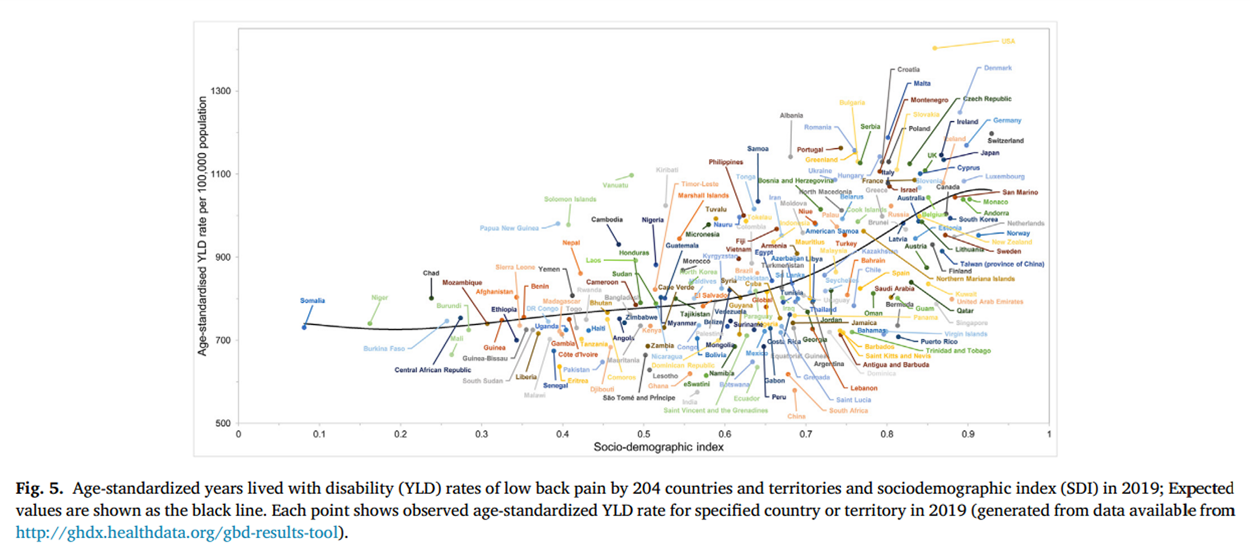
Figure 5 Results showed that the worldwide prevalence, incidence and YLD rates were higher in women than in men and increased with age, and then peaked at the age group of 80–84 years old for both sexes in 2019. Moreover, the number of prevalent, incident and YLD cases was also increased with age and peaked at the age group of 45–54 years old for both sexes, and then the decreasing trends were observed up to the oldest age group (Figure 3, Supplementary Figs. S8 and S9). It is noteworthy that there were no statistically significant differences between females and males in terms of prevalence, incidence, and YLD across all age groups.
Burden of low back pain by Socio-demographic index
Overall, a positive association was observed between the age-standardized YLD rate of LBP and SDI over the past thirty years (Figure 4). Interestingly, at the regional level, the age-standardized YLD rate of LBP displayed a decreasing trend with the increasing SDI during 1990–2019. In high-income North America, Central Europe, Oceania and Southeast Asia, the observed LBP burden estimates were higher than the expected level on the basis of SDI during 1990–2019. A positive association was also noted between age-standardized YLD rate of LBP and SDI for 204 countries and territories in 2019. In many countries and territories, including the United States, Denmark and Switzerland, the age-standardized YLD rate was higher than the expected level (Figure 5).
Discussion
In this study, we present the most up-to-date, comprehensive and comparable information of prevalence, incidence and YLD for LBP in 204 countries and territories from 1990 to 2019 using the publicly available modelled data and methods in GBD Study 2019. [12] National-level burden of LBP and the association between LBP burden and SDI have been analyzed in the present study.
In 2019, LBP accounted for approximately 568.4 million prevalent cases, 223.5 million incident cases and 63.7 million YLDs globally. Although the age-standardized prevalence, incidence and YLDs rate of LBP were slightly decreased from 1990 to 2019, the prevalent number, incident number and the number of YLDs had substantially increased, and LBP remains the leading cause of YLDs in 2019 worldwide. Moreover, the burden of LBP in some countries is still growing, with the largest increase in Zambia, Mali and Canada. Meanwhile, enormous social and economic costs were spent in the treatment and management of LBP. In the United States, it has been reported that LBP ranked first among 154 conditions in health care spending with an estimated spending at $134.5 billion in 2016. [14] Generally, the estimated spending of LBP includes only health care spending and accounts for a small portion of the total cost, because the indirect costs arising from absence from work (absenteeism) and attending work while sick (presenteeism), are not taken into account. [15] Overall, the total costs of LBP were probably underestimated. As we see above, LBP is the condition with high prevalence and heavy burden globally, so it is important that preventive measures, management and treatment of LBP are given priority.
As shown in this study, the burden of LBP is higher in females than in males in 2019. This gender disparity of LBP burden is similar to what was reported in GBD study 2017, but contrary to what was reported in GBD study 2010. [10, 11] In fact, it is the expanded data coverage and improved statistical approach rather than a real change that results in the difference in gender disparity of LBP burden over this period. Interestingly, the similar gender trend has been reported in other musculoskeletal disorders, such as osteoarthritis and neck pain. [13, 16] Evidence has shown that female sex hormones play an essential role in the etiology and pathophysiology of various musculoskeletal degenerative diseases, and the prevalence of these diseases significantly increases after menopause. [17, 18] We speculate that menopause in females may be an explanation for the gender disparity of LBP burden. In addition to biological factors, psychological and sociocultural factors could also be the possible explanations for it. [11, 19] The trends of worldwide prevalent cases, incidence cases and YLDs in 2019 were similar, increasing with age and peaking at 45–54 years age for men and women. The trends of global prevalent rate, incidence rate and YLDs rate were also similar, increasing with age and peaking at 80–84 age group for both women and men in 2019. The similar age patterns of LBP burden were observed in the statistical data from GBD study 2010 and GBD study 2017. [10, 11] There are several factors that may contribute to the age pattern of LBP burden. Intervertebral disc degeneration is considered as one of important reasons for LBP and the degeneration degree of intervertebral disc increases with age, which may directly explain the age pattern in a certain extent. [20–22] On the other hand, aging is associated with pain, which can exist in different parts of the body and may restrict physical and social function, and further accelerate the deterioration of the musculoskeletal system and result in additional pain. [23] This vicious cycle may explain the age pattern in an indirect way. Thus, the 45–54 years age group especially the female group at this age should be targeted in an early science popularization education and prevention of LBP, which will be beneficial to the reduction of LBP burden.
Our analyses of the present study reveal that the developing level of countries is one of the important contributing factors for LBP burden, which has not been reported in previous studies. Interestingly, although there was an overall positive association between age-standardized YLD rate of LBP and SDI, the age-standardized YLD rate of LBP at the regional level displayed a decreasing trend with the increasing SDI during 1990–2019. Moreover, the high burden of LBP was not limited to countries with a high SDI level, but was also observed in countries with a middle and low SDI level. Possible explanations for this confusing phenomenon are likely to be complicated and may be owing to the differences among different countries and the different times of the identical country in the levels of aging, physical inactivity, occupation and obesity. For example, Vanuatu, which has a low SDI level and a high YLD rate of LBP, is accompanied by substantially increased prevalence of obesity and sedentary recreation in economic development. [24, 25] This discrepancy could, in part, contribute to the high burden of multiple disorders or diseases, including LBP, in this country. On the basis of the above association between age-standardized YLD rate of LBP and SDI, healthcare policy makers can establish precise preventive strategies for LBP by comparing the burden observed with the expected burden based on the SDI.
Although the burden of LBP is high worldwide, currently available guidelines recommended treatment methods, including physiotherapy, pharmacological therapy, interventional therapy, and surgery, cannot completely cure the pain, and there remains a lot of work to be done to reduce the LBP burden. [26] Early detection and control of risk factors could be good strategies to prevent LBP and reduce LBP burden. The risk factors for LBP are classified into 4 levels in GBD Study 2019. [27] Level 1 risk factors include environmental/occupational risks, behavioral risks and metabolic risks; Level 2 risk factors include occupational risks, tobacco and high body-mass index; Level 3 risk factors include occupational ergonomic factors and smoking. Unfortunately, the specific level 4 risk factors for LBP have not yet been evaluated in GBD study. The assessment of country specific patterns of risk factors for LBP should be conducted in future, which is crucial for policy makers in establishing management recommendations. But it is encouraging that some interventions, especially physical exercise, education and ergonomic modifications, have been shown to yield positive effects on prevention of LBP. [28] Clinical trials and systematic reviews have confirmed that physical exercise, and programs combining physical exercise and education are effective to reduce LBP severity and associated disabilities. [29–31] Therefore, it is suggested that policy makers strengthen education about ergonomic knowledge of postures and tobacco control to decrease risk of LBP, and increase investment of public sport stadium to encourage people to keep healthy body-mass index, which may serve as important prevention strategies for LBP.
Limitations of this study
One main limitation of this study is the incomplete availability of the primary data used in GBD Study 2019. When data are incomplete or not available in some regions and countries (e.g., the data are not released), the results rely on the modelled data from DisMod-MR 2.1 using covariates and borrowing strength across geography or time. While it is unlikely that data in a country in a certain year will suddenly and dramatically change, the modelled data should be interpreted with caution. Although the severity distributions of LBP are estimated using the analysis of the Medical Expenditure Panel Surveys (MEPS), the data might not have been collected using the preferred case definition of LBP, and recall bias might exist due to the long follow-up period. Moreover, the data of the health state experience for LBP derived from MEPS might not be representative globally. In addition, the instability in fixed effects between cycles due to collinearity is difficult to avoid, and the UIs around estimates could not be fully represented in the statistical modelling.
Conclusions and policy implications
LBP is a major public health problem globally, with great variation among countries. Although the age standardized prevalence, incidence and YLDs of LBP did not obviously change over the past thirty years, its burden remains high, with middle aged women particularly at risk. Increasing the awareness of population and policy makers about LBP and its risk factors, together with providing preventive and curative interventions for people living with LBP, is highly recommended for reducing the future burden of this condition.
Appendix A: Supplementary Material
Multimedia Component 1 (688K, pdf)
Multimedia Component 2 (461K, pdf)Acknowledgements
We thank the Institute for Health Metrics and Evaluation staff and its collaborators who prepared these publicly available data.
Declaration of competing interest
None declared.
Contributors
Conception and design of study: G.Z. Xiao, Z.W. Shao, H.L. Cao and S Chen; Acquisition of data: S Chen, M.J. Chen, X.H. Wu, S.X. Lin, C Tao; Analysis and/or interpretation of data: S Chen, M.J. Chen, H.L. Cao, Z.W. Shao, G.Z. Xiao; Drafting the manuscript: G.Z. Xiao, S Chen. Revising the manuscript critically for important intellectual content: G.Z. Xiao, S Chen. All authors take the responsibility for the integrity of the data analyses and approve the final version of the manuscript.
Funding
This work was supported, in part, by the National Key Research and Development Program of China Grants (2019YFA0906004), the National Natural Science Foundation of China Grants (81974352, 81991513, 82022047, 81630066) and the Guangdong Provincial Science and Technology Innovation Council Grant (2017B030301018).
References:
Vlaeyen J.W.S., Maher C.G., Wiech K., Van Zundert J., Meloto C.B., et al.
Low back pain.
Nat Rev Dis Primers. 2018;4:52Urits I., Burshtein A., Sharma M., Testa L., Gold P.A., Orhurhu V., et al.
Low back pain, a comprehensive review:
pathophysiology, diagnosis, and treatment.
Curr Pain Headache Rep. 2019;23:23Hartvigsen J, Hancock MJ, Kongsted A, Louw Q, Ferreira ML, Genevay S, Hoy D, Karppinen J et al.
What Low Back Pain Is and Why We Need to Pay Attention
Lancet. 2018 (Jun 9); 391 (10137): 2356–2367
This is the second of 4 articles in the remarkable Lancet Series on Low Back PainMaher C., Underwood M., Buchbinder R.
Non-specific low back pain.
Lancet. 2017;389:736–747GDaIIaP Collaborators.
Global, regional, and national incidence, prevalence, and years lived
with disability for 354 diseases and injuries for 195 countries and
territories, 1990–2017: a systematic analysis for the
Global Burden of Disease Study 2017.
Lancet. 2018;392:1789–1858Wu A., Dong W., Liu S., Cheung J.P.Y., Kwan K.Y.H., Zeng X., et al.
The prevalence and years lived with disability caused by low
back pain in China, 1990 to 2016: findings from
the global burden of disease study 2016.
Pain. 2019;160:237–245de David C.N., Deligne L.M.C., da Silva R.S., Malta D.C., Duncan B.B., et al.
The burden of low back pain in Brazil:
estimates from the Global Burden of Disease 2017 Study.
Popul Health Metrics. 2020;18:12Stanis?awska I., Mincewicz M., Cabak A., Kaczor R., et al.
Epidemiological aspects of low back pain.
Advances in Biomedicine. 2019:47–52Jin Z., Wang D., Zhang H., Liang J., Feng X., Zhao J., et al.
Incidence trend of five common musculoskeletal disorders from 1990
to 2017 at the global, regional and national level: results
from the global burden of disease study 2017.
Ann Rheum Dis. 2020;79:1014–1022Hoy, D, March, L, Brooks, P et al.
The Global Burden of Low Back Pain:
Estimates from the Global Burden of Disease 2010 study
Annals of Rheumatic Diseases 2014 (Jun); 73 (6): 968–974Wu A., March L., Zheng X., Huang J., Wang X., Zhao J., et al.
Global Low Back Pain Prevalence and Years Lived with
the Global Burden of Disease Study 2017
Annals of Translational Medicine 2020 (Mar); 8 (6): 299Vos T., Lim S.S., Abbafati C., Abbas K.M., Abbasi M., Abbasifard M., et al.
Global burden of 369 diseases and injuries in 204 countries and territories,
1990–2019: a systematic analysis for the Global Burden of Disease Study 2019.
Lancet. 2020;396:1204–1222Safiri S., Kolahi A.A., Smith E., Hill C., Bettampadi D., Mansournia M.A., et al.
Global, regional and national burden of osteoarthritis 1990-2017:
a systematic analysis of the Global Burden of Disease Study 2017.
Ann Rheum Dis. 2020;79:819–828Dieleman JL, Cao J, Chapin A, et al.
US Health Care Spending by Payer and Health Condition, 1996-2016
JAMA 2020 (Mar 3); 323 (9): 863–884Alonso-Garcia M., Sarria-Santamera A.
The economic and social burden of low back pain in Spain:
a national assessment of the economic and social impact
of low back pain in Spain.
Spine (Phila Pa. 1976;45:E1026–E1032. 2020Safiri S, Kolahi AA, Hoy D, Buchbinder R, Mansournia MA, Bettampadi D, et al.
Global, Regional, and National Burden of Neck Pain in the
General Population, 1990-2017: Systematic Analysis of
the Global Burden of Disease Study 2017
British Medical Journal 2020 (Mar 26); 368: m791Wang Y.X.J.
Menopause as a potential cause for higher prevalence of
low back pain in women than in age-matched men.
J Orthop Translat. 2017;8:1–4Talsania M., Scofield R.H.
Menopause and rheumatic disease.
Rheum Dis Clin N Am. 2017;43:287–302Kikuchi R., Hirano T., Watanabe K., Sano A., Sato T., Ito T., et al.
Gender differences in the prevalence of low back pain associated with
sports activities in children and adolescents: a six-year annual
survey of a birth cohort in Niigata City, Japan.
BMC Muscoskel Disord. 2019;20:327Lyu F.J., Cheung K.M., Zheng Z., Wang H., Sakai D., Leung V.Y.
IVD progenitor cells: a new horizon for understanding
disc homeostasis and repair.
Nat Rev Rheumatol. 2019;15:102–112Ma K., Chen S., Li Z., Deng X., Huang D., Xiong L., et al.
Mechanisms of endogenous repair failure during intervertebral disc degeneration.
Osteoarthritis Cartilage. 2019;27:41–48Chen S., Liu S., Ma K., Zhao L., Lin H., Shao Z.
TGF-beta signaling in intervertebral disc health and disease.
Osteoarthritis Cartilage. 2019;27:1109–1117Blyth F.M., Noguchi N.
Chronic musculoskeletal pain and its impact on older people. Best practice & research.
Clin Rheumatol. 2017;31:160–168Dancause K.N., Dehuff C., Soloway L.E., Vilar M., Chan C., Wilson M., et al.
Behavioral changes associated with economic development
in the South Pacific: health transition in Vanuatu.
Am J Hum Biol. 2011;23:366–376van Horn A., Weitz C.A., Olszowy K.M., Dancause K.N., Sun C., Pomer A., et al.
Using multiple correspondence analysis to identify behaviour patterns
associated with overweight and obesity in Vanuatu adults.
Publ Health Nutr. 2019;22:1533–1544Foster NE, Anema JR, Cherkin D, Chou R, Cohen SP, et al.
Prevention and Treatment of Low Back Pain:
Evidence, Challenges, and Promising Directions
Lancet. 2018 (Jun 9); 391 (10137): 2368–2383
This is the third of 4 articles in the remarkable Lancet Series on Low Back PainMurray C.J.L., Aravkin A.Y., Zheng P., Abbafati C., Abbas K.M., et al.
Global burden of 87 risk factors in 204 countries and territories,
1990–2019: a systematic analysis for the Global Burden of Disease Study 2019.
Lancet. 2020;396:1223–1249Knezevic N.N., Candido K.D., Vlaeyen J.W.S., Van Zundert J., Cohen S.P.
Low back pain.
Lancet. 2021;398:78–92. 10294de Campos T.F., Maher C.G., Fuller J.T., Steffens D., Attwell S., Hancock M.J.
Prevention strategies to reduce future impact of low back pain:
a systematic review and meta-analysis.
Br J Sports Med. 2020;55(9):468–476Huang R., Ning J., Chuter V.H., Taylor J.B., Christophe D., Meng Z., et al.
Exercise alone and exercise combined with education both prevent episodes
of low back pain and related absenteeism: systematic review and network
meta-analysis of randomised controlled trials (RCTs)
aimed at preventing back pain.
Br J Sports Med. 2020;54:766–770Minghelli B., Nunes C., Oliveira R.
Back school postural education program: comparison of two types of
interventions in improving ergonomic knowledge about
postures and reducing low back pain in adolescents.
Int J Environ Res Publ Health. 2021;18
Return to LOW BACK PAIN
Return to GLOBAL BURDEN OF DISEASE
Since 4-16-2023
| Home Page | Visit Our Sponsors | Become a Sponsor |
Please read our DISCLAIMER |