

The State of US Health, 1990-2010:
Burden of Diseases, Injuries, and Risk FactorsThis section is compiled by Frank M. Painter, D.C.
Send all comments or additions to: Frankp@chiro.org


FROM: JAMA 2013 (Aug 14); 310 (6): 591–608 ~ FULL TEXT
OPEN ACCESS Christopher J L Murray, Charles Atkinson, Kavi Bhalla, Gretchen Birbeck, Roy Burstein, David Chou, et al.
Institute for Health Metrics and Evaluation,
2301 Fifth Ave., Suite 600,
Seattle, WA, 98121, USA

Importance: Understanding the major health problems in the United States and how they are changing over time is critical for informing national health policy.
Objectives: To measure the burden of diseases, injuries, and leading risk factors in the United States from 1990 to 2010 and to compare these measurements with those of the 34 countries in the Organisation for Economic Co-operation and Development (OECD) countries.
Design: We used the systematic analysis of descriptive epidemiology of 291 diseases and injuries, 1160 sequelae of these diseases and injuries, and 67 risk factors or clusters of risk factors from 1990 to 2010 for 187 countries developed for the Global Burden of Disease 2010 Study to describe the health status of the United States and to compare US health outcomes with those of 34 OECD countries. Years of life lost due to premature mortality (YLLs) were computed by multiplying the number of deaths at each age by a reference life expectancy at that age. Years lived with disability (YLDs) were calculated by multiplying prevalence (based on systematic reviews) by the disability weight (based on population-based surveys) for each sequela; disability in this study refers to any short- or long-term loss of health. Disability-adjusted life-years (DALYs) were estimated as the sum of YLDs and YLLs. Deaths and DALYs related to risk factors were based on systematic reviews and meta-analyses of exposure data and relative risks for risk-outcome pairs. Healthy life expectancy (HALE) was used to summarize overall population health, accounting for both length of life and levels of ill health experienced at different ages.
Results: US life expectancy for both sexes combined increased from 75.2 years in 1990 to 78.2 years in 2010; during the same period, HALE increased from 65.8 years to 68.1 years. The diseases and injuries with the largest number of YLLs in 2010 were ischemic heart disease, lung cancer, stroke, chronic obstructive pulmonary disease, and road injury. Age-standardized YLL rates increased for Alzheimer disease, drug use disorders, chronic kidney disease, kidney cancer, and falls. The diseases with the largest number of YLDs in 2010 were low back pain, major depressive disorder, other musculoskeletal disorders, neck pain, and anxiety disorders. As the US population has aged, YLDs have comprised a larger share of DALYs than have YLLs. The leading risk factors related to DALYs were dietary risks, tobacco smoking, high body mass index, high blood pressure, high fasting plasma glucose, physical inactivity, and alcohol use. Among 34 OECD countries between 1990 and 2010, the US rank for the age-standardized death rate changed from 18th to 27th, for the age-standardized YLL rate from 23rd to 28th, for the age-standardized YLD rate from 5th to 6th, for life expectancy at birth from 20th to 27th, and for HALE from 14th to 26th.
There is more like this at our
Global Burden of Disease PageConclusions and relevance: From 1990 to 2010, the United States made substantial progress in improving health. Life expectancy at birth and HALE increased, all-cause death rates at all ages decreased, and age-specific rates of years lived with disability remained stable. However, morbidity and chronic disability now account for nearly half of the US health burden, and improvements in population health in the United States have not kept pace with advances in population health in other wealthy nations.
Glossary of Terms Disability-adjusted life-years (DALYs)
a summary metric of population health. DALYs represent a health gap and, as such, measure the state of a population's health compared to a normative goal. The goal is for individuals to live the standard life expectancy in full health. DALYs are the sum of 2 components: years of life lost (YLLs) and years lived with disability (YLDs).
Healthy life expectancy (HALE)
the number of years that a person at a given age can expect to live in good health, taking into account mortality and disability.
Years lived with disability (YLDs)
computed as the prevalence of different disease sequelae and injury sequelae multiplied by disability weights for that sequela. Disability weights are selected on the basis of surveys of the general population about the health loss associated with the health state related to the disease sequela.
Years of life lost due to premature mortality (YLLs)
computed by multiplying the number of deaths at each age by a standard life expectancy at that age. The standard selected represents the normative goal for survival and has been computed based on the lowest recorded death rates across countries in 2010.
From the FULL TEXT Article:
Introduction
Years lived with disability are calculated from the prevalence of a sequela multiplied by the disability weight for that sequela, which reflects its severity on a continuum between no loss of health (which has a disability weight of 0) and complete loss of health (which has a weight of 1.0). The meaning of disability in the GBD differs from that in US legislation such as the Americans with Disabilities Act; in the GBD, disability refers to any short- or long-term health loss. DALYs are the sum of YLLs and YLDs. The GBD uses another indicator, healthy life expectancy (HALE), to summarize overall population health in a single number accounting for both length of life and levels of ill health experienced at different ages. [27]
Estimation of prevalence for each sequela began with a systematic analysis of published studies and data sources providing information on prevalence, incidence, remission, and excess mortality, such as the National Health and Nutrition Examination Surveys, [36] State Inpatient Databases, [37] the National Ambulatory Medical Care Survey, [38, 39] the National Hospital Ambulatory Medical Care Survey, [40] the Medical Expenditure Panel Survey, [41] the National Comorbidity Survey, [42] the National Epidemiological Survey on Alcohol and Related Conditions, and disease surveillance reports from the Centers for Disease Control and Prevention. For most sequelae, estimates were made using a Bayesian metaregression tool developed for the GBD 2010 (DisMod-MR). The DisMod-MR program estimates a generalized negative binomial model with nested random effects for regions and countries and fixed effects (see Vos et al [25] for details on the equations and estimation procedure). Source code for DisMod-MR is available at http://ihmeuw.org/dismod_mr. eTable 1 in the Supplement provides the estimated prevalences for the 1160 sequelae for the United States in 2010.
For the GBD 2010, disability weights were measured for 220 unique health states that cover the 1160 disease and injury sequelae. [26] Disability weights were generated using data from more than 30 000 respondents contacted through population-based, random-sample surveys in the United States, Peru, Tanzania, Bangladesh, and Indonesia and through an open Internet survey. The US survey, conducted using computer-assisted telephone interviews, consisted of 3,323 respondents, and the Internet survey consisted of 7,180 self-selecting respondents from the United States. Results from population surveys in developing countries and the United States were highly consistent, suggesting a common construct of health; likewise, the results from the well-educated respondents to the Internet survey were highly consistent with the population-based samples. For example, the correlation between results from the United States and from the combined sample was 0.97. [26] The 220 disability weights used in this study and the lay descriptions used to elicit choices from survey respondents are published elsewhere. [26] Uncertainty in the disability weight for each sequela was propagated into the estimates of YLDs for each disease and injury using standard simulation methods. [43] Information on age-specific mortality rates and on overall age-specific YLDs per person was combined into an overall measure of HALE, using a standard approach to extending the life table to capture adjustments for nonfatal health outcomes. [27]
We estimated the deaths or DALYs related to the 67 risk factors or clusters of risk factors (eTables 7 and 8 in the Supplement) following the conceptual framework for risk factors developed for the GBD, which identifies 3 layers of factors in a causal web: distal socioeconomic, proximal behavioral and environmental, and physiological and pathophysiological causes. [44] Computation follows 3 key steps.
In the first step, risk-outcome pairs were included when evidence met the criteria for “convincing” or “probable” evidence. [45] As defined by the World Cancer Research Fund grading system, convincing evidence is evidence from epidemiological studies showing consistent associations between exposure and disease, with little or no evidence to the contrary. The evidence must come from a substantial number of studies including prospective observational studies and, when relevant, randomized controlled trials of sufficient size, duration, and quality showing consistent effects. The association should be biologically plausible, such as the effect of salt on fluid retention, increases in blood pressure, and ultimate effect on cardiovascular diseases. Probable evidence is defined as evidence based on epidemiological studies showing fairly consistent associations between exposure and disease but for which there are perceived shortcomings in the available evidence or some evidence to the contrary, which preclude a more definite judgment; for example, the effects of diets low in seafood omega-3 fatty acids on ischemic heart disease mortality. Shortcomings in the evidence may be any of the following: insufficient duration of trials (or studies), insufficient trials (or studies) available, inadequate sample sizes, or incomplete follow-up. Laboratory evidence is usually supportive and the association must again be biologically plausible. Relative risks of mortality and morbidity were estimated based on meta-analyses of the scientific literature. [31] eTable 2 in the Supplement provides the published relative risks used for each of the risk factors used in the analysis.
In the second step, the distribution of each risk factor exposure ineach country,age, and sex group was estimated from published and unpublished data sources. [31]
In the third step, deaths or DALYs associated with risk factors were estimated by comparing the current distribution of exposure with a theoretical minimum risk exposure distribution (TMRED) of exposure selected for each risk factor. The TMRED is a feasible distribution of exposure that would minimize population health risk. For example, the theoretical minimum risk distribution for tobacco is that no one has smoked in the past; for systolic blood pressure, it is a distribution with a mean of 110 to 115 mm Hg and a standard deviation of 6 mm Hg. The TMRED for each risk factor is the same for all populations; Lim et al [31] provides detail on these distributions for dichotomous and continuous risk factors. TMREDs have been defined for each of the 14 subcomponents of diet. The overall relationship of diet with health outcomes assumes the contribution of each component is multiplicative; that is, that the individual dietary contributions are independent.
Each risk factor or cluster of risk factors was analyzed separately such that the sum of attributable fractions (see eTable 2 in the Supplement) for a disease or injury can be greater than 100%. For example, a behavioral risk factor, such as some components of diet, may operate in part through reducing blood pressure. We included only risks for which there was convincing or probable evidence for pairs of risk factors and specific outcomes and that had sufficient epidemiological data to estimate risk factor–specific effect sizes, eg, relative risks. These risks included a range of behavioral, environmental, and metabolic risk factors, but distal socioeconomic factors were excluded because much of the literature on these risk factors focuses on all-cause mortality and morbidity outcomes.
Using simulation methods, [46, 47] we took 1000 draws (unbiased random samples) from the uncertainty distribution of the relative risks, prevalence of exposure estimates, theoretical minimum risk distributions, and background outcome rates. Uncertainty intervals for burden related to a risk factor were based on computation of the results for each of the 1000 draws; the lower bound of the 95% uncertainty interval for the final quantity of interest is the 2.5 percentile of the distribution and the upper bound is the 97.5 percentile of the distribution. These uncertainty intervals reflect all sources of uncertainty, including sampling error and model parameter uncertainty, from each component of the analysis.
For outcomes measured for specific age groups (deaths, YLLs, YLDs, and DALYs), we directly computed age-standardized rates using the World Health Organization's age standard. [48] For each disease, injury, or risk factor, we ranked countries in 1990 and 2010 by the age-standardized rates for each outcome measure. We compared US outcomes with those of the 34 countries that are members of the OECD. These OECD members have been used in other comparative studies for the United States. [49] For a given country and disease, injury, or risk, we tested whether a country was significantly above the mean of all OECD countries, indistinguishable from the mean, or below the mean; we used a 1–sided test at the P<.05 significance level.
Results
Years of Life Lost

Table 1 Table 1 shows, for the 30 leading diseases and injuries contributing to premature mortality in the United States in 2010, the number of deaths and YLLs and their rates of change from 1990 to 2010. Table 1 also shows the change in the age-standardized death rate to distinguish changes relating to population growth and aging from changes in age-specific rates. Ischemic heart disease and stroke were the first and third leading diseases contributing to premature death in 2010, but both are declining in terms of the number of YLLs and age-standardized rates. Despite declines, 15.9% of YLLs were related to ischemic heart disease and 4.3% of YLLs were related to stroke, highlighting the continued dominance of cardiovascular diseases in premature death. Lung cancer and chronic obstructive pulmonary disease (COPD) were the second and fourth leading diseases contributing to YLLs, respectively. Both diseases are increasing in absolute terms but have declining age-standardized rates; declines in COPD are notably slower than those in lung cancer. Road injury (which includes bicycle, motorcycle, motor vehicle, and pedestrian injury) and self-harm are the fifth and sixth leading diseases or injuries contributing to YLLs; in men, they are ranked third and fourth and in women, eighth and 16th, respectively.
The next 3 leading diseases contributing to YLLs, diabetes, cirrhosis and Alzheimer disease, all increased in rank and the number of YLLs from 1990 to 2010. Colorectal cancer (10th), breast cancer (13th for both sexes combined and fifth in women), and pancreatic cancer (18th) are in the top 20 diseases and injuries contributing to premature death. Other large increases in premature mortality were seen for drug use disorders (moving from 44th to 15th), chronic kidney disease (CKD) (from 21st to 16th), kidney cancer (from 35th to 24th), and poisonings (from 31st to 26th); falls (from 33rd to 29th) and liver cancer (from 39th to 30th) also increased. The increase in YLLs associated with liver cancer may be related to a hepatitis C cohort effect.50 Among the 30 leading diseases and injuries contributing to YLLs in 1990, declines of 25% or more were seen for interpersonal violence, preterm birth complications, congenital anomalies, HIV/AIDS, and sudden infant death syndrome. The YLLs related to HIV decreased by 64% and declined in rank from seventh to 23rd. eTables 3 and 4 in the Supplement provide estimates of deaths and YLLs, respectively, for all 223 diseases and injuries.
Years Lived With Disability
Figure 1
Table 2
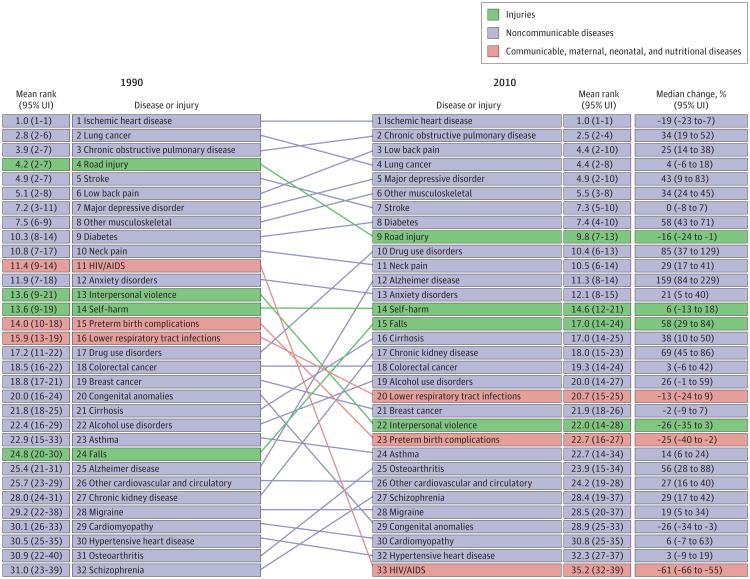
Figure 2
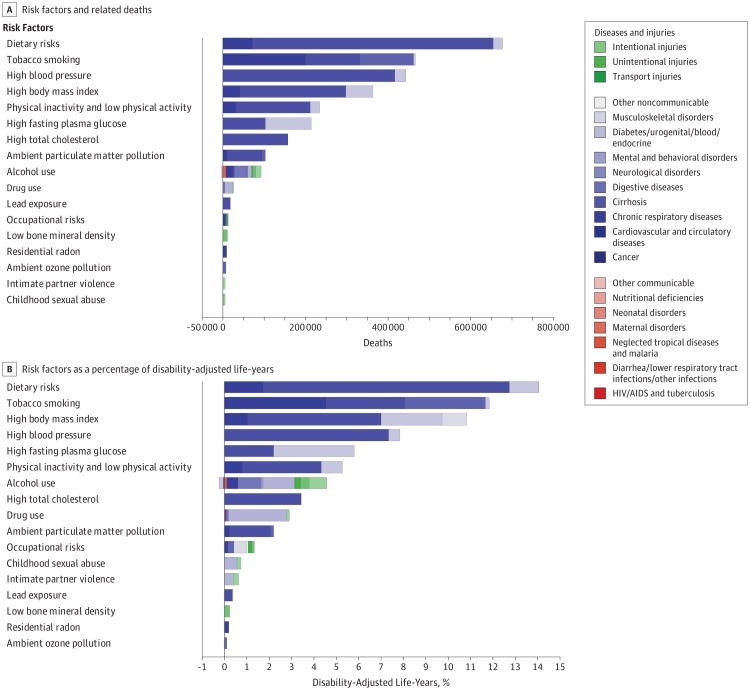
Figure 3 Cardiovascular diseases, cancers, and chronic respiratory diseases are all related to YLDs, but the largest contributors are the mental and behavioral disorders and the musculoskeletal disorders (Figure 1). Table 2 provides details on the 30 leading diseases and injuries contributing to YLDs in 2010. The number of YLDs from the top 18 diseases and injuries increased between 1990 and 2010, driven mostly by the population increase and aging of the US population, as age-standardized rates have largely remain unchanged (Table 2). Of these 18 causes, age-standardized rates increased significantly (P < .05) only for stroke. The top 8 conditions were the same in 1990 and 2010: low back pain, major depressive disorder, other musculoskeletal disorders, neck pain, anxiety disorders, COPD, drug use disorders, and diabetes. Four more mental and behavioral disorders are in the top 20 YLDs: alcohol use disorders, schizophrenia, bipolar disorder, and dysthymia. Age-standardized rates increased by 20% or more from 1990 to 2010 for drug use disorders, stroke, and eating disorders (eTable 5 in the Supplement provides detailed estimates of YLDs for the 267 diseases and injuries).
Disability-Adjusted Life-Years
Combining YLLs and YLDs into DALYs provides a summary metric of the leading contributors to health loss. In 1990, 40% of DALYs were due to YLDs increasing to 45% in 2010. Figure 2 shows the rank of the leading diseases and injuries contributing to DALYs in 1990 and2010. Communicable, maternal, neonatal, and nutritional disorders are red, noncommunicable causes are blue, and injuries are green. Diseases and injuries are connected by lines between 1990 and 2010. The top 15 diseases and risk factors contributing to DALYs are a complex mix of cardiovascular diseases (ischemic heart disease and stroke), musculoskeletal disorders (low back pain, other musculoskeletal disorders, and neck pain), 1 cancer type (lung), mental and behavioral disorders (major depressive disorder, drug use disorder, and anxiety), COPD, diabetes, and 3 injury types (road injury, self-harm, and falls) (Figure 2). Of the 30 leading diseases and injuries contributing to DALYs, 10 (COPD, major depressive disorders, other musculoskeletal, diabetes, drug use disorders, Alzheimer, falls, cirrhosis, CKD, and osteoarthritis) increased by more than 30% from 1990 to 2010 (eTable 6 in the Supplement provides detail for the 272 diseases and injuries). Other disorders contributing to DALYs not in the top 30 that have also increased by more than 30% in the past 2 decades include liver cancer, atrial fibrillation, kidney cancers, eating disorders, and poisoning.
Figure 3 shows the number of deaths and the percentage of DALYs related to the 17 risk factors or risk factor clusters in 2010 each of which was associated with more than 0.1% of DALYs. The largest cluster of risk factors was the composition of diet, which was associated with 26% of deaths and 14% of DALYs (Figure 3). The overall composition of diet is made up of an analysis of 14 components of diet (eTables 7 and 8 in the Supplement provide further details for risks or clusters of risks for DALYs and associations with deaths, respectively). The most important dietary risks in the United States are diets low in fruits, low in nuts and seeds, high in sodium, high in processed meats, low in vegetables, and high in trans fats.
Although the DALYs related to tobacco, including secondhand smoke, declined by 9% from 1990 to 2010, tobacco remains the second leading risk factor after diet. In terms of DALYs, body mass index (BMI, calculated as weight in kilograms divided by height in meters squared) greater than 21.0–23.0 is the third ranked risk factor, associated with 14% deaths and 11% of DALYs. High blood pressure (greater than 110–115 mm Hg), high fasting plasma glucose level (greater than 88–95 mg/dL [4.9–5.3 mmol/L]), and physical inactivity or low activity are the next leading risk factors. DALYs related to high cholesterol levels (greater than 145–155 mg/dL [3.8–4.0 mmol/L]) declined by 36%, decreasing from the fifth to the eighth leading risk factor. In contrast, the burden associated with drug use disorders increased by 64%. Ambient particulate matter pollution remains in the top 10 risk factors associated with DALYs in the United States but declined by 35% since 1990.
Comparison With OECD Countries
Table 3
Table 4
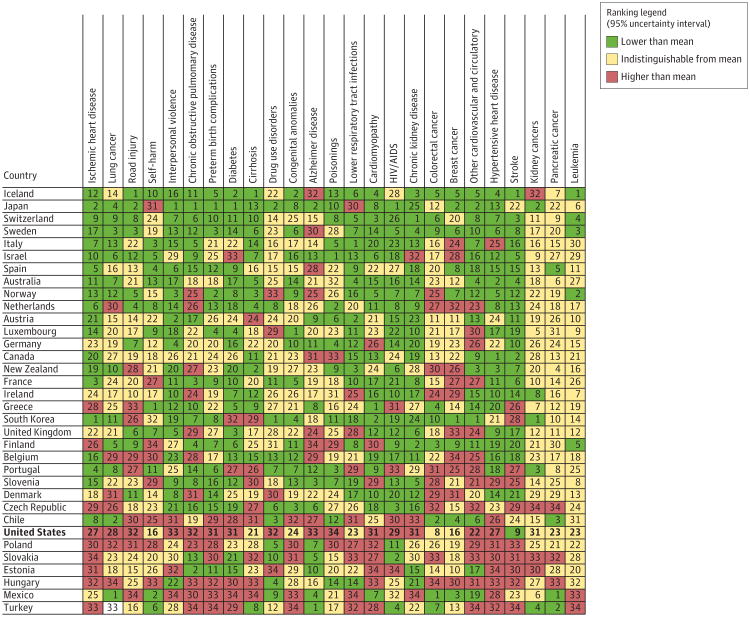
Figure 4 Health outcomes and health progress in the United States, compared with Organisation for Economic Co-operation and Development (OECD) countries, are shown in Table 3 and Table 4, which include multiple summary metrics: age-standardized death rates, age-standardized YLL rates, age-standardized YLD rates, life expectancy at birth, and HALE at birth. For all mortality-based metrics, the US rank declined between 1990 and 2010 to 27th or 28th among the 34 OECD countries. Citizens living in countries with a substantially lower gross domestic product and health expenditure per capita, such as Chile, Portugal, Slovenia, and South Korea, have lower mortality rates than those in the United States. In contrast, the United States ranks toward the top for YLDs, fifth in 1990 and sixth in 2010, but wide uncertainty intervals mean that some countries have rates that are statistically indistinguishable from the United States. Relatively high mortality and low disability rates nevertheless translated into a comparatively poor HALE rank of 26 in 2010 because of the comparatively smaller variation in YLD rates than in YLLs across the OECD countries.
The rank of the age-standardized YLL rates across OECD countries for the 25 leading diseases and risk factors related to premature mortality in the United States in 2010 is shown in Figure 4. Countries are ordered from the lowest age-standardized YLL rate to the highest at the bottom. For 15 of 25 causes, mortality in the United States is significantly above the OECD mean (Figure 4). The 3 diseases and injuries contributing to YLL with the greatest potential to reduce premature deaths compared with other OECD countries and with higher than mean rates are ischemic heart disease, lung cancer, and road injury. Other examples of higher than mean rates with substantial potential to reduce YLLs include interpersonal violence, COPD, preterm birth complications, and diabetes, followed by drug use disorders, Alzheimer disease, and poisonings.
The same comparative analysis for YLDs confirms that the United States performs much better on age-standardized YLDs than on age-standardized YLLs. The leading diseases and injuries with the potential to reduce YLDs are COPD, other musculoskeletal disorders, drug use disorders, and sickle cell disorders. The higher prevalence of sickle cell disorders in the United States is also likely related to a higher birth prevalence than in other OECD countries. The eFigure in the Supplement shows the same benchmarking analysis for risk factors across the OECD countries. Although the mean value for high blood pressure related to DALYs in the United States is lower than the mean of all OECD countries, blood pressure is seventh on the list of potential targets for reducing disease burden in the population. The biggest potential for burden reduction is high BMI, followed by tobacco use, dietary risks, alcohol use, and high fasting glucose levels. For each of these risk factors, the United States has a greater associated burden than the OECD mean.
Discussion
Overall, population health in the United States improved from 1990 to 2010. Life expectancy at birth and HALE increased and all-cause death rates at all ages decreased. Although life span has increased, age-specific YLD rates have remained relatively stable, so the sharply increasing age gradient of YLD means that the overall volume of YLDs has increased in an aging US population, with an increase in the number of years lived with disability for the average American. The gap between life expectancy and HALE, a measure of the expected number of healthy years that an individual loses to disability–increased from 9.4 years to 10.1 years. In other words, individuals in the United States are living longer but are not necessarily in good health.
Morbidity and chronic disability now account for nearly half of the health burden in the United States. The key contributors to this burden, however, are not the same as the major diseases and injuries contributing to premature mortality. Mental and behavioral disorders, musculoskeletal disorders, vision and hearing loss, anemias, and neurological disorders all contribute to the increases in chronic disability. Research and development has been much more successful at finding solutions for cardiovascular diseases and some cancers and their associated risk factors than for these leading causes of disability. These conditions receive less National Institutes of Health funding than cardiovascular diseases and cancers. [21] The progressive and likely irreversible shift in the disease burden profile to these causes also has implications for the type of resources needed in the US health system.
Diet, BMI, and Disease Burden
In this analysis, the aggregate of the 14 subcomponents of diet is a more important factor associated with disease burden than either physical inactivity or high BMI. The effect sizes for dietary components were based on meta-analyses of observational cohort studies and for selected dietary components, on intervention studies. [31, 52, 53] The results for diet are limited by difficulties in measurement, various levels of conflicting evidence, and potential influence of unmeasured confounders and mediators. In addition, because each component of diet is analyzed separately, the complex relationships among components of diet may not be fully considered or understood, which might overestimate the effects of each component. For example, individuals who consume large amounts of fruit also may consume less sodium. Yet, most studies used in the meta-analyses of each dietary component controlled for BMI and other key behaviors such as physical activity and tobacco use.
Also, the individual dietary component effect sizes are consistent with overall dietary pattern studies; for example, the recent PREDIMED [54] trial reported significant benefits of healthful diet patterns on clinical cardiovascular events, and the magnitudes of benefits in that trial are highly consistent with our predicted risk estimates (D. M., unpublished data, March 2013). Furthermore, randomized feeding study results are consistent with significant benefits to blood pressure and cholesterol. [55, 56] Another limitation of the evidence on diet is that many studies have limited periods of follow-up, whereas the chronic diseases related to diet develop over decades. To the extent that some diet components may also contribute to energy imbalance and ultimately to elevated BMI, the full relationships between diet and health outcomes are not captured in our analysis of the composition of diet. [57]
Between 1990 and 2010, DALYs related to elevated BMI independent of diet composition increased by 45%. Detailed analysis of BMI suggests that increases are even larger in some parts of the United States, such as the Southeast. These same assessments suggest that levels of physical activity may be improving at the same time that overweight and obesity rates are increasing. [58] Rising obesity rates are a potentially unique challenge for the United States and the world. There is some controversy, however, surrounding the BMI level corresponding to the lowest relative risks. Flegal et al [59] reported a systematic review of published studies and argued that excess mortality is only observed for a BMI over 35. However, this study did not incorporate the standardized analyses based on the large pooling projects that were the basis for the GBD 2010, which included more than 11 million person-years of observation. [60–62] These pooling studies reported a stronger and more consistent relationship across a range of BMI values than did the Flegal meta-analysis, with excess mortality increasing steadily beginning at a BMI of 21.0 to 23.0. [63–65] The risks of diet composition, physical inactivity and low activity, and high BMI are highly intertwined; currently, more effective strategies [66, 67] are available for modifying diet and physical inactivity than for lowering high BMI.
Diabetes, Kidney Disease, and Neurological Disorders The increase in disease burden from diabetes and CKD is particularly noteworthy. We estimate in this study that in 2010, 23.5% of CKD and 76.0% of diabetes DALYs were related to BMI, increases from 18.1% and 64.3% in 1990, respectively. The increase in CKD-related mortality was larger than the increase in mortality related to diabetes, which suggests that other causes of CKD may also be increasing. Given the costs associated with long-term management of diabetes and CKD, these trends are likely to continue to increase health costs. [68] Improved survival among persons with diabetes by effective management of major cardiovascular and renal risks such as hyperglycemia, hypertension, and high cholesterol may improve overall population health but will likely increase costs as well. Recent data indicate improvements in the quality of care for diabetes. [69] Evidence that diabetes can be substantially prevented or postponed in people with prediabetes through focused lifestyle or drug therapy has accumulated over the past few years. [70]
Neurological conditions increased from 2.0% of DALYs in 1990 to 3.0% in 2010. Both Alzheimer disease and Parkinson disease are associated with large increases in DALYs. Although the increase in Alzheimer disease may be confounded by changes in ascertainment and coding practice, these increases suggest an important trend. Migraine and epilepsy are also ranked 14th and 30th as diseases contributing to YLDs, respectively. Both aging and increasing age-standardized prevalence rates are contributing to a growing challenge of neurological disease.
Road Injury
Road injury YLLs declined by 33% from 1990 to 2010. Nevertheless, road injuries remained the second and fifth disease or injury contributing to YLLs for males and females, respectively, in 2010. Age-standardized YLLs related to road injuries in the United States are exceeded only by those of South Korea, Greece, and Mexico. Compared with Sweden and Iceland, which have the lowest road injury death rates in the OECD, mortality from this cause in the United States is 3–fold greater; although exposure in terms of miles driven per capita may be higher in the United States. Sweden is pursuing Vision Zero, which seeks to eliminate all road injury deaths through a range of interventions. [71]
Interventions to reduce road injury deaths work. In 1990, age-standardized YLL rates from road injury in Spain were nearly identical to those in the United States; concerted public action, [72] however, has led to a 62% decline in Spain over the past 20 years. Given the critical role of road injury as a contributor to US premature mortality, a more concerted intervention approach, drawing on lessons from other countries, would seem to be a key US public health priority. [73] Such interventions include more stringent anti– drunk driving measures, such as ignition interlocks for persons convicted of driving while intoxicated, increased use of sobriety checkpoints, and greater enforcement of underage drinking laws; increased use of motorcycle helmets; increased enactment of primary seat belt laws together with enhanced enforcement programs; and greater use of graduated driver licensing for teen drivers. [74]
Comparison With OECD Countries
From 1990 to 2010, improvements in population health in the United States did not keep pace with advances in population health in other wealthy nations. Compared with other OECD nations, the US rank for various measures of mortality declined by between 5 and 9 ranks, depending on the metric. In contrast, the United States ranks high overall for age-standardized YLD rates compared with OECD countries, although age-standardized YLD rates are measured with wider uncertainty intervals than age-standardized YLL rates. Relative to other OECD nations, the United States has below-average age-standardized DALY rates for low back pain, stroke, falls, and colorectal cancer. It has higher than OECD mean rates for a number of leading diseases and injuries, such as COPD, road injury, diabetes, Alzheimer disease, and interpersonal violence.
In 2010, the United States had age-standardized rates above the mean for OECD countries for 16 of the top 30 diseases and injuries contributing to YLLs. At the same time, the US rates were below the mean in men for stroke, colorectal cancer, and falls and in women for stroke. The United States also had lower mean rates in 1990 for a longer list of diseases and injuries contributing to YLLs including stroke, self-harm, lower respiratory tract infections, colorectal cancer, congenital anomalies, cirrhosis, and stomach cancer. How much of the US advantage for these conditions is related to risk factors and how much is related to health care cannot be determined from the GBD data alone. Five-year survival for breast cancer and colorectal cancer are higher in the United States than in many OECD countries. [75] Although the number of conditions for which the United States has below-average age-standardized rates is small, it does point out that poor health outcomes in the United States are not preordained. There are potential roles for public health programs, access to high-quality medical care, and policy and legislation in addressing both diseases and risk factors.
Limitations
A study of this scope has many limitations, including most of those of the GBD 2010. [3, 19, 25–27, 29–31] First, there are inherent limitations of the data used to determine prevalence estimates and disability weights across countries. For some of the 1160 disabling sequelae, there are no data for some, or even many, countries. As detailed elsewhere, Bayesian statistical models have been used to estimate prevalence for these conditions in each country and by age, sex, andyear. [25] Comparisons of YLDs are influenced by the disability weights derived from the general population; to the extent that the general population did not understand the lay descriptions used to elicit judgments about levels of health, disability weights may be biased. Although Salomon et al [26] found little evidence of variation in disability weights as a function of population or educational status, it is possible that disability weights may vary across different populations or across socioeconomic or race and ethnicity groups within populations. To highlight differences in epidemiology, cross-country comparisons should use a common set of weights. However, if disability weights are found to vary, local weights could be used for within-country studies. The ongoing assessment of the burden of disease for the United States would benefit from a systematic evaluation of where the data are most limited. Important sources of data may not have been identified or been available or these data may not have been collected.
Second, there are limitations related to the extent, quality, and consistency of some information used in the analyses and estimates in this study. The reporting of 95% uncertainty intervals that incorporate both sampling error and error from model estimation provides some information on the extent and quality of the information available for the United States. Uncertainty could be underestimated for a range of reasons, such as unrecognized bias in published studies. However, the nature of the estimation process both for causes of death and the prevalence of sequelae more generally exaggerate uncertainty intervals in a high-income country such as the United States. These wide uncertainty intervals limit the ability to determine whether a country is above or below the OECD mean for YLDs. Country ranks across age-standardized YLL rates could still be affected by differences in national death certification practice, although after careful and detailed examination of the cause-of-death data, we have not identified any reason to suspect that this is a major problem in the United States.30 However, some of the increase in Alzheimer disease from 1990 to 2010 may be related to changes in certification and coding. [72]
Concerns have been raised that in some countries, variable implementation of the World Health Organization's definition of a live birth may affect comparisons of early neonatal death rates [76] across countries; because early neonatal deaths account for only 0.5% of deaths and 2.6% of YLLs, these considerations are unlikely to affect the comparisons shown here. However, the same problems related to how countries define and count diseases, injuries, and risk factors could affect estimates of other diseases included in these analysis.
Third, the analysis of risk factors in this study focused on behavioral, environmental, and metabolic risks and did not evaluate the social determinants of health. The important role of social determinants of health [5, 6] was not quantified in the GBD 2010, largely because of the study requirement that evidence meet the World Cancer Research Fund criteria of convincing or probable evidence and that epidemiological data be available to estimate effect sizes for a risk factor on specific causes of death or disability. Much of the substantial body of evidence on the important influence of socioeconomic factors relates determinants such as income, education, and inequality to all-cause outcomes. The World Cancer Research Fund criteria emphasize consistency of evidence whether across trials or cohort studies. However, given the complex pathways through which socioeconomic factors influence health in different communities, effect sizes often vary. [18, 44, 78, 82]
In some cases, intervention studies for income and education have yielded results that are not entirely consistent with those of observational studies. [80, 81] Authoritative reviews [18, 44, 78, 82] nevertheless support the critical importance of these factors in determining population health. The absence of these in this current assessment should not be taken as implying that they are less important than the more proximal factors studied here. Despite their omission, the evidence suggests that interventions to reduce behavioral, environmental, and metabolic risks can have substantial benefits across diverse socioeconomic groups. [70, 83, 84]
Conclusion
Overall, population health in the United States has improved from 1990 to 2010. Life expectancy at birth and HALE have in-creased and all-cause death rates at all ages have decreased. Although life span has increased, rates of age-specific YLDs have remained stable, and morbidity and chronic disability now account for nearly half of the health burden in the United States. However, improvements in population health in the United States have not kept pace with advances in population health in other wealthy nations. Regular assessments of the local burden of disease and matching information on health expenditures for the same disease and injury categories could allow for a more direct assessment of how changes in health spending have affected or, indeed, not affected changes in the burden of disease and may provide insights into where the US health care system could most effectively invest its resources to obtain maximum benefits for the nation's population health. In many cases, the best investments for improving population health would likely be public health programs and multisectoral action to address risks such as physical inactivity, diet, ambient particulate pollution, and alcohol and tobacco consumption.
Supplementary Material
Supplement (4.9M, pdf ~ 179 pages)
Glossary
DALYs = disability-adjusted life-years
HALE = healthy life expectancy
YLDs = years lived with disability
YLLs = years of life lost due to premature mortality
Funding/Support:
This study is supported in part by the Intramural Program of the National Institutes of Health, the National Institute of Environmental Health Sciences, and in part by the Bill and Melinda Gates Foundation.
Role of the Sponsors:
The sponsors of the study had no role in the design and conduct of the study; collection, management, analysis, and interpretation of the data; preparation, review, and approval of the manuscript; or decision to submit the manuscript for publication.
Conflict of Interest Disclosures:
All authors have completed and submitted the ICMJE Form for Disclosure of Potential Conflicts of Interest. Dr Benjamin reports consulting fee/honoraria from Circulation as associate editor. Dr Couser reports fees for data safety monitoring board participation from Lilly and travel/meeting expenses from the International Society of Nephrology. Dr Dellavalle reports royalties from UpToDate and the Journal of the American Academy of Dermatology. Dr Gillum reports consultancy as an associate editor for Elsevier. Dr Lopez reports consultancy for IHME. Dr McDermott reports consulting fee from Ironwood Pharmaceuticals. Dr Mensah reports stock/stock options in PepsiCo, travel/meeting expenses from Chevron, and an honorarium from Elsevier. Dr Moffitt reports board membership with Nuffield Foundation. Dr Ostro reports consultancy for the World Bank and grants/grants pending from the US EPA. Dr Schwebel reports consultancy for ORCAS Inc, IRIS, and Marshfield Clinics, expert testimony for Carr and Carr, and grants/grants pending from Carr and Carr, Morris Animal Foundation, and Blue Dog Foundation, payment for lectures/speakers bureau from various university and government entities, and royalties from Erlbaum. Dr D. Singh reports payment for lectures/speakers bureau from Bristol Myers. Dr Moran reports travel/meeting expenses from the Institute for Health Metrics and Evaluation. Dr J. Singh reports consultancy for Savient, Takeda, URL, Novartis, Ardea, Allergan, and Regeneron and grants/grants pending from Takeda and Savient. He is on the steering committee of OMERACT. No other disclosures were reported
Disclaimer:
Dr McDermott (senior editor of JAMA) and Dr Rivara (editor in chief of JAMA Pediatrics) were not involved in the editorial review of or decision to publish this article.
References:
Return to GLOBAL BURDEN OF DISEASE
Since 8-24-2021
| Home Page | Visit Our Sponsors | Become a Sponsor |
Please read our DISCLAIMER |