PLoS One 2025 (Jan 28); 20 (1): e0317663
Fig 3. Cumulative incidence of the occurrence of an opioid-related adverse event per patient in each cohort.
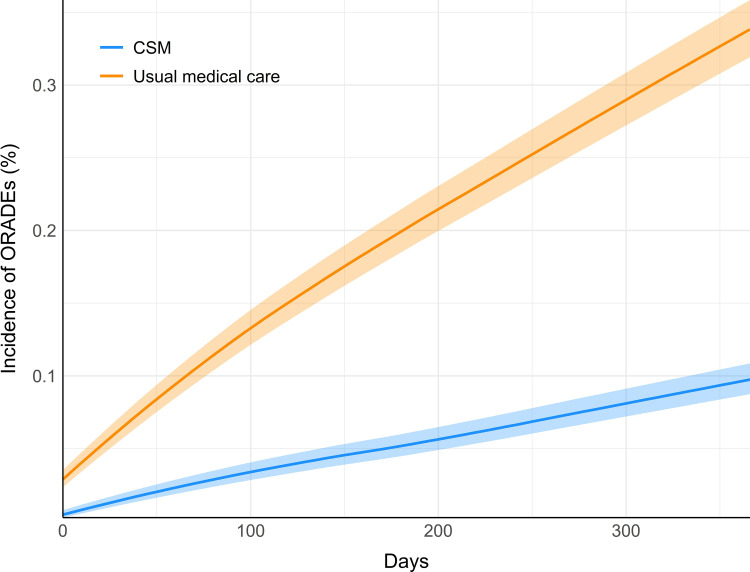
The incidence curve for the cohort receiving chiropractic spinal manipulation (CSM) is shown in orange, while that of the cohort receiving usual medical care is shown in blue, over the 365-day (one-year) follow-up window. Semi-transparent bands indicate 95% confidence intervals for each of the incidence curves in their respective colors.