J Athl Train 2021 (Apr 1); 56 (4): 427–436
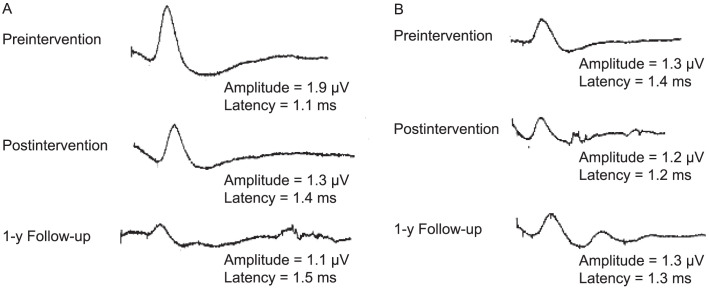
Skin sympathetic responses at each time point for A, the intervention group and B, the control group. Mean peak-to-peak amplitude (amplitude) and mean latency (latency) are provided.Figure 4.

J Athl Train 2021 (Apr 1); 56 (4): 427–436
Figure 4.

Skin sympathetic responses at each time point for A, the intervention group and B, the control group. Mean peak-to-peak amplitude (amplitude) and mean latency (latency) are provided.