

Association of Lumbar Spine Radiographic Changes
With Severity of Back Pain-Related Disability
Among Middle-aged, Community-Dwelling WomenThis section is compiled by Frank M. Painter, D.C.
Send all comments or additions to: Frankp@chiro.org


FROM: JAMA Network Open 2021 (May 3); 4 (5): e2110715 ~ FULL TEXT
OPEN ACCESS Lingxiao Chen, MBBS, MMed; Romain S. Perera, PhD; Maja R. Radojcic, PhD; Paula R. Beckenkamp, PhD, et. al
Institute of Bone and Joint Research,
The Kolling Institute, Northern Clinical School,
Faculty of Medicine and Health,
University of Sydney,
Sydney, New South Wales, Australia.
Importance: Previous studies, using mostly cross-sectional data, provide conflicting evidence of an association between lumbar spine radiographic changes and the severity of back pain-related disability. Such conflicting evidence may be associated with widely unnecessary diagnostic imaging of the lumbar spine.
Objective: To examine both cross-sectional and longitudinal associations between lumbar spine radiographic changes and the severity of back pain-related disability among middle-aged, community-dwelling women.
Design, setting, and participants: This population-based prospective cohort study used data from the Chingford 1000 Women Study. Analyses included data collected from year 6 (1994–1996; physical activity was measured), year 9 (1997–1999; treated as baseline), and year 15 (2003–2005), with a total length of follow-up for longitudinal analyses of 6 years. Data were analyzed from April 17 to November 3, 2020.
Exposures: Primary exposure was lumbar spine radiographic changes, defined using the Kellgren-Lawrence (K-L) grade. Secondary exposures were defined using presence of osteophytes and disc space narrowing. The composite score combined the number of lumbar spine segments with definite changes detected on radiographic images (ie, radiographic changes) (K-L grade ≥2, which means at least definite osteophyte and possible narrowing of disc space are present; osteophyte and disc space narrowing grade ≥1, which means at least mild or definite changes are present).
Main outcomes and measures: Self-reported back pain-related disability measured in years 9 and 15 assessed by the St Thomas disability questionnaire.
Results: Among 650 women (mean [SD] age, 61.3 [5.9] years) in cross-sectional analyses and 443 women (mean [SD] age, 60.6 [6.0] years) in longitudinal analyses, there was no evidence to support an association between higher number of lumbar segments with radiographic changes (K-L grade, osteophytes, and disc space narrowing) and more severe back pain-related disability (eg, cross-sectional analyses using the K-L grade; 1 segment vs 0 segment: adjusted odds ratio, 1.22 [95% CI, 0.76–1.96]). No interactions were found of an association between lumbar spine radiographic changes and the severity of back pain-specific disability with age, body mass index, or smoking status.
Conclusions and relevance: In this cohort of middle-aged, community-dwelling women, there was no evidence to support an association between a higher number of lumbar segments with radiographic changes (K-L grade, osteophytes, and disc space narrowing) and more severe back pain-related disability cross-sectionally or over time. These findings provide further evidence against routinely using diagnostic imaging of the lumbar spine.
From the FULL TEXT Article:
Introduction
Low back pain (LBP) is a highly prevalent condition in the general population worldwide and has been the leading cause of disability for nearly 3 decades, according to the Global Burden of Disease Study 2017. [1, 2] Among all musculoskeletal problems, LBP is also the most common reason for patients to seek primary care. [3] Current guidelines for treatment of LBP do not recommend routinely using diagnostic imaging, except when patients either present with severe, progressive neurologic deficits or with signs or symptoms indicative of a serious or specific underlying condition (eg, fracture or cancer). [4–6] Nonetheless, diagnostic imaging is still widely used in clinical practice for LBP, with a recent meta-analysis indicating that more than 15% of patients in primary care and approximately 25% in emergency care receive a referral for simple imaging (mainly radiograph). [7]
Moreover, nearly 10% of patients with LBP in primary care and emergency care also receive a referral for complex imaging (mainly computed tomography scan and magnetic resonance imaging). [7] There has also been a 53% relative increase in referrals for complex imaging from 1995 to 2017, with no change observed during that period for the rate of referrals for simple imaging. [7] Unnecessary diagnostic imaging not only wastes limited medical resources but is also associated with poorer health outcomes, such as iatrogenic disease from techniques that use ionizing radiation. [8] In addition, patients who undergo unnecessary diagnostic imaging might be labeled with a pseudodisease, which may be associated with unnecessary subsequent interventions that may have adverse effects. [9]
Possible explanations for the unwarranted prevalence of imaging referrals for LBP are(1) the patient’s expectation that imaging results could provide valuable information on the cause and, consequently, the appropriate management of her or his condition and
(2) the clinician’s desire to reassure the patient of the absence of any underlying pathologic condition. [10–12]Previous studies have confirmed that imaging does not improve clinical outcomes for patients with LBP. [9, 13] However, the definition of normal or abnormal imaging diagnostic findings is still debatable. Currently, the presence of osteophytes and disc space narrowing are the most frequent changes detected on radiographs (hereafter referred to as radiographic changes) that may be indicative of spinal pathologic conditions, and the Kellgren-Lawrence (K-L) grade is the tool commonly used to assess the severity of osteoarthritis. [14]
A study including elderly women who lived in rural South Korea showed a positive association of the presence of osteophytes (grade ≥2), disc space narrowing (grade ≥2), and K-L grade (grade ≥2) with the severity of disability, measured by a validated Korean version of the Oswestry Disability Index. [15] However, a study conducted in Sri Lanka including patients with LBP concluded that neither disc space narrowing nor the presence of osteophytes was associated with the severity of disability (also measured with the Modified Oswestry Disability Index). [16] Both studies are cross-sectional and failed to adjust their analyses for important confounders, including smoking status, level of participation in physical activity, and medication use.
Past studies have also failed to identify whether the number of affected lumbar segments is associated with the severity of back pain–related disability. Therefore, the role of radiographic findings as a potential prognostic factor of the clinical course of LBP is still unclear and needs to be fully explored in population-based cohort studies. Previous studies of radiographic changes in knee osteoarthritis have indicated that the presence of osteophytes may be used to diagnose the condition and that the presence of joint space narrowing may be used to assess both the diagnosis and the progression of osteoarthritis. [17, 18] This is still to be elucidated among patients with LBP.
The aim of this study was to examine both cross-sectional and longitudinal associations between lumbar radiographic changes and the severity of back pain–related disability among middle-aged, community-dwelling women using composite scores that combined the number of segments and type of changes in terms of K-L grade, disc space narrowing, and osteophytes. We hypothesized that a higher number of segments with lumbar radiographic changes would be associated with more severe back pain–related disability.
Methods
Study Design, Data Sources, and Study Population
From an age and sex register of a large practice of more than 11,000 patients in Chingford in east London, UK, all 1,353 women in the age range of 45 to 64 years were invited to participate in a population study assessing musculoskeletal diseases. A total of 1,003 women were examined between 1989 and 1991 (year 1; baseline visit for original cohort); 6 died, 66 had moved away, and 278 refused to participate or did not respond. All the women lived within 8 km (5 miles) of the general practice, and 98% of the women were white. Women from this general practice are similar to the UK general population in terms of weight, height, and body mass index (BMI). In the data analyses, and given their availability, we included data on physical activity collected in year 6 (1994–1996 [ie, prebaseline]) and imaging data, all other covariates, and the outcome for cross-sectional analyses collected in year 9 (1997–1999 [ie, baseline for our study]). The outcome for longitudinal analyses was obtained in year 15 (2003–2005). We followed the Strengthening the Reporting of Observational Studies in Epidemiology (STROBE) reporting guideline. [19, 20] The Waltham Forest and Redbridge local research ethics committee approved the study, and all participants provided written informed consent to participate in the study.
Exposures
Lateral lumbar spine radiographs at year 9 were taken by 1 radiographer, centered on the L3 vertebra, with the participants in the left lateral recumbent position. A single trained observer (a rheumatologist) blinded to patient identity and chronologic order read all of the radiographs. Within-observer variation was assessed by test-retest analysis of 40 randomly selected radiographs from the study. Good within-observer reproducibility (κ = 0.78–0.89) was found. [21] At each lumbar spine segment (L1–L2, L2–L3, L3–L4, and L4–L5), disc space narrowing and osteophytes (both anterior and posterior) were assessed through the semiquantitative method reported by Lane et al, [22] withgrade 0 corresponding to normal,
grade 1 to mild narrowing and osteophytes,
grade 2 to moderate narrowing and osteophytes, and
grade 3 to severe narrowing and osteophytes.
The Kellgren-Lawrence (K-L) grade was summarized asgrade 0 indicating normal;
grade 1 indicating doubtful narrowing of disc space and possible osteophytic lipping;
grade 2 indicating definite osteophyte and possible narrowing of disc space;
grade 3 indicating moderate multiple osteophytes, definite narrowing of disc space, some sclerosis, and possible deformity of bone contour; and
grade 4 indicating large osteophytes, marked narrowing of disc space, severe sclerosis, and definite deformity of bone contour.Considering that the number of lumbar spine segments with radiographic changes detected and the various types of radiographic changes might be associated with the results, we generated 3 composite scores: a K-L grade–based score, an osteophyte grade–based score, and a disc space narrowing grade–based score; at each segment, a binary exposure variable of 1 (K-L grade ≥2, which means at least definite osteophyte and possible narrowing of disc space are present; disc space narrowing and osteophyte grade ≥1, which means at least mild or definite changes are present) vs 0 (K-L grade 0 or 1; disc space narrowing and osteophyte grade 0) was used. The composite score was then calculated as the final L1–L2 score + L2–L3 score + L3–L4 score + L4–L5 score, with values ranging from 0 to 4 (where 0 indicates no lumbar spine segments with radiographic changes detected and 4 indicates 4 lumbar spine segments with radiographic changes detected). The K-L grade–based score was defined as the primary exposure. Osteophyte and disc space narrowing grade–based scores were set as secondary exposures.
Outcomes
Back pain–related disability was assessed at year 9 and year 15 using a back pain questionnaire (St Thomas disability questionnaire), which correlated well with the Oswestry Disability Questionnaire (r = 0.77; P < .001). [23]
The outcome was defined by questions at 2 levels.At the first level, women were asked whether they had any back pain for at least 1 day at any time in the last 12 months.
At the second level, those who answered yes to the first-level question were asked 8 questions related to the disability due to back pain (corresponding to the previous year’s status):walking around the house;
standing for 15 minutes;
getting up from a low chair;
getting out of a bath;
getting in and out of a car;
going up and down stairs;
putting on socks, stockings, or tights; and
cutting toenails.Each question was summarized as grade 0 indicating no difficulty, grade 1 indicating difficult but possible, and grade 2 indicating impossible. We built a composite score based on the aforementioned 8 questions; values ranged from 0 to 16, with higher values corresponding to more severe disability. We assumed the composite score as 0 if women answered “no” to the first-level question. In case of missing data for any of the 8 questions, we kept the data if the women responded to at least 6 questions and calculated the composite score as [(total score)/(number of questions answered)] × 8.
Covariates
Causal diagram through DAGitty, version 3.024 was used to choose the minimal sufficient adjustment sets for estimating the total association of the exposure with the outcome. [25] Age, BMI, smoking status, back pain status, bisphosphonate use, and physical activity were included in the final model (details in eFigure 1 in the Supplement). All covariates, except physical activity, which was measured in year 6, were measured in year 9.
Statistical Analysis
Data were analyzed from April 17 to November 3, 2020. Owing to the skewed distribution of back pain–related disability (eFigure 2 in the Supplement), ordinal logistic regression, which holds a proportional odds assumption, was performed. [26] Considering that physical activity was measured at a different time point (ie, year 6) compared with other covariates (ie, year 9) and with potential measurement error, we established a stepped modeling framework: step 1, unadjusted analyses; step 2, analyses adjusted for age, BMI, back pain status, bisphosphonate use status, and smoking status (additionally adjusted for year 9 back pain–related disability for the longitudinal analysis); and step 3, analyses further adjusted for physical activity.
Separate analyses were conducted for cross-sectional and longitudinal data. For the longitudinal analyses, data on lumbar spine radiographic changes collected in year 9 were treated as the exposure, and back pain–related disability data collected in year 15 were treated as the outcome. In addition to the confounders mentioned, data on back pain–related disability collected in year 9 were included in the longitudinal analysis as a strong prognostic factor to adjust. [27] Based on the recommendation from Modern Epidemiology, [28] the exposures were modeled as unordered categorical variables and trend test. [26]

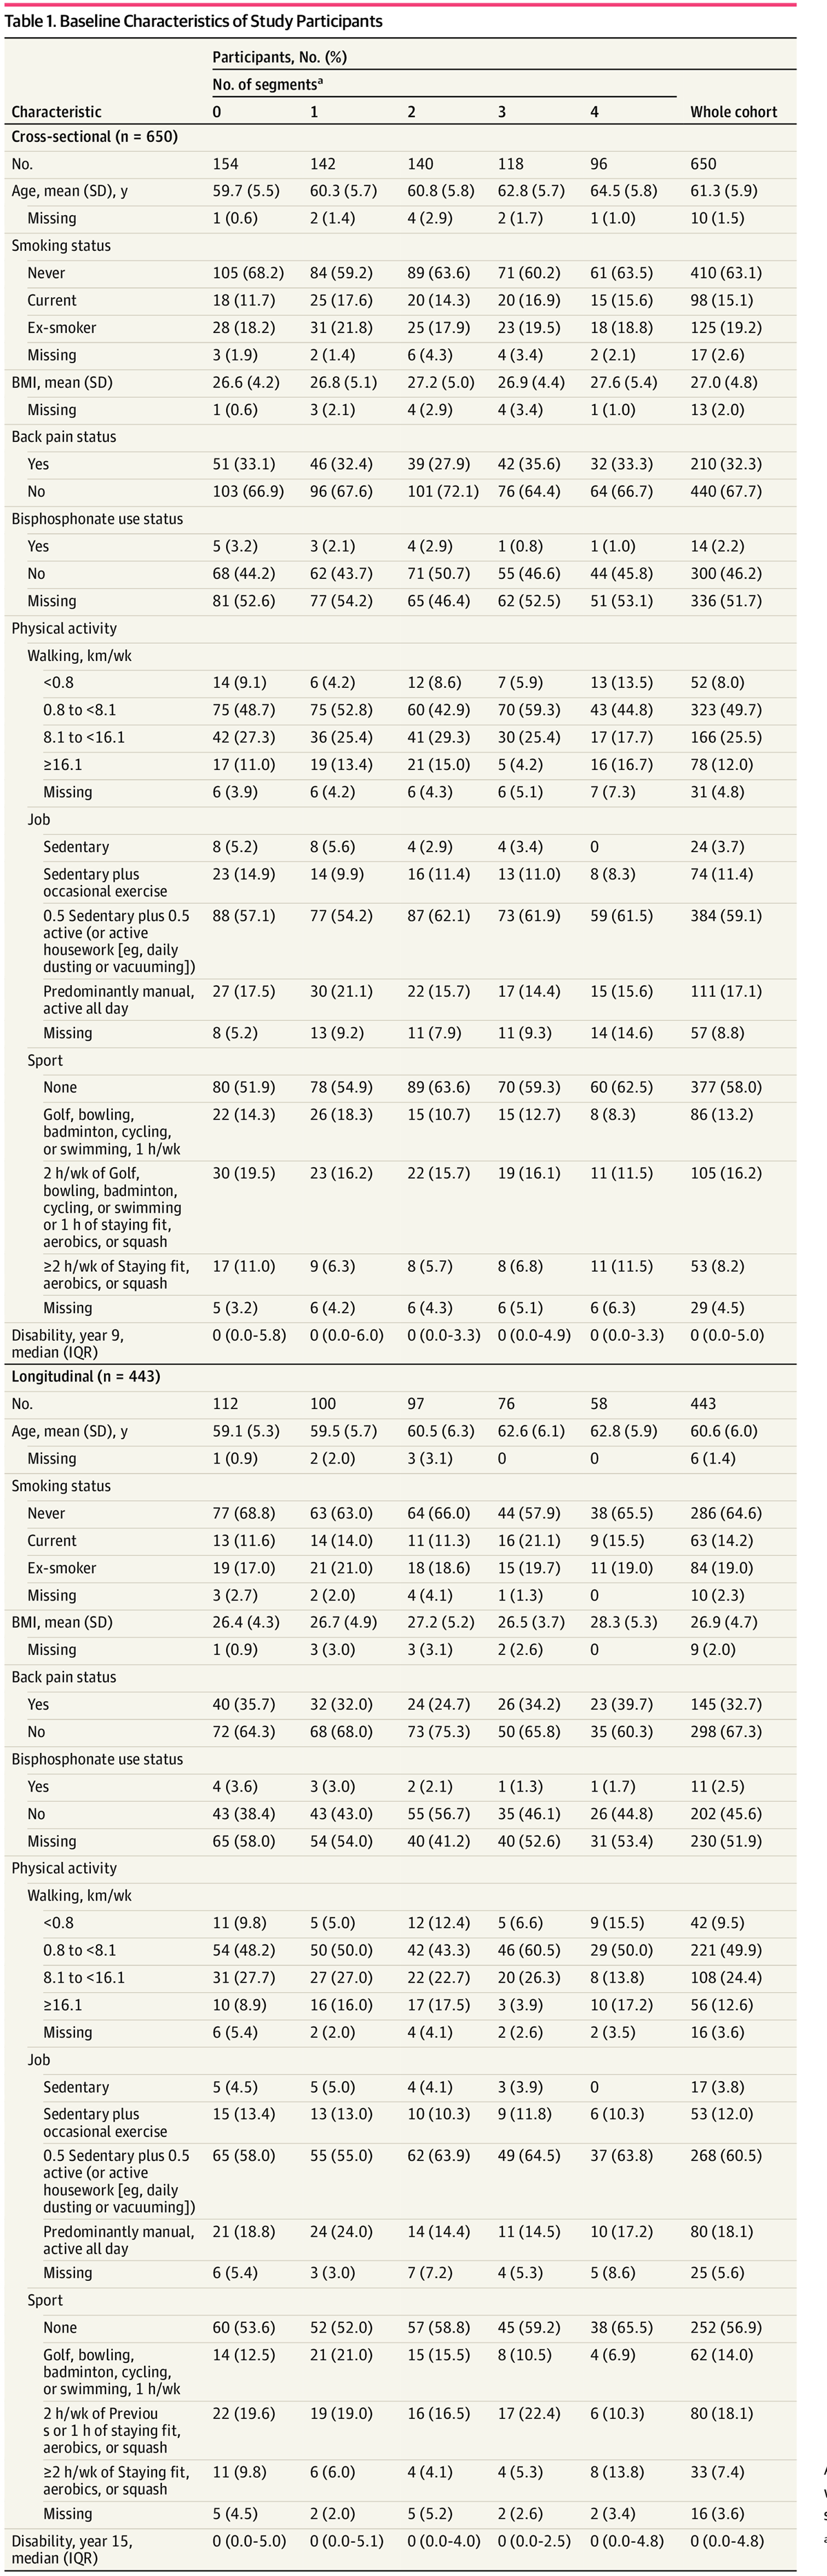
Table 1 The proportion of missing data in each covariate is provided in Table 1. Missing data were handled through multiple imputation, which holds a missing-at-random assumption. [26] The assumption was graphically tested (eFigure 3 in the Supplement). No additional variables were used; all covariates in the minimal sufficient adjustment sets were used. Flexible additive models with 10 imputed data sets were used. [29] We did not impute data for the exposure variables. The relative risk was presented as adjusted proportional odds ratios (ORs) with 95% CIs. Extensive sensitivity analyses were performed (eAppendix 1 in the Supplement). All statistical analyses were performed with rms, Hmisc, and tidyverse packages in R, version 3.6.2 (R Group for Statistical Computing). Details of the statistical methods are provided in eAppendix 2 in the Supplement.
Results
Participant Characteristics
A total of 650 women (mean [SD] age, 61.3 [5.9] years) were included in cross-sectional analyses, and a total of 443 women (mean [SD] age, 60.6 [6.0] years) were included in longitudinal analyses (Table 1; Figure). Most study participants were classified as either never smokers or ex-smokers (Table 1). The median score of back pain–related disability was 0 (interquartile range, 0.0–5.0 in cross-sectional analyses and 0.0–4.8 in longitudinal analyses) in both cross-sectional and longitudinal analyses. The distribution of each lumbar spine radiographic change at each lumbar spine segment is listed in eTable 1 in the Supplement. Redundancy analyses were performed to assess whether 1 exposure could be estimated from any 2 other exposures, at each lumbar spine segment. [26] No exposure was redundant (eTable 2 in the Supplement).
K-L Grade–Based Score
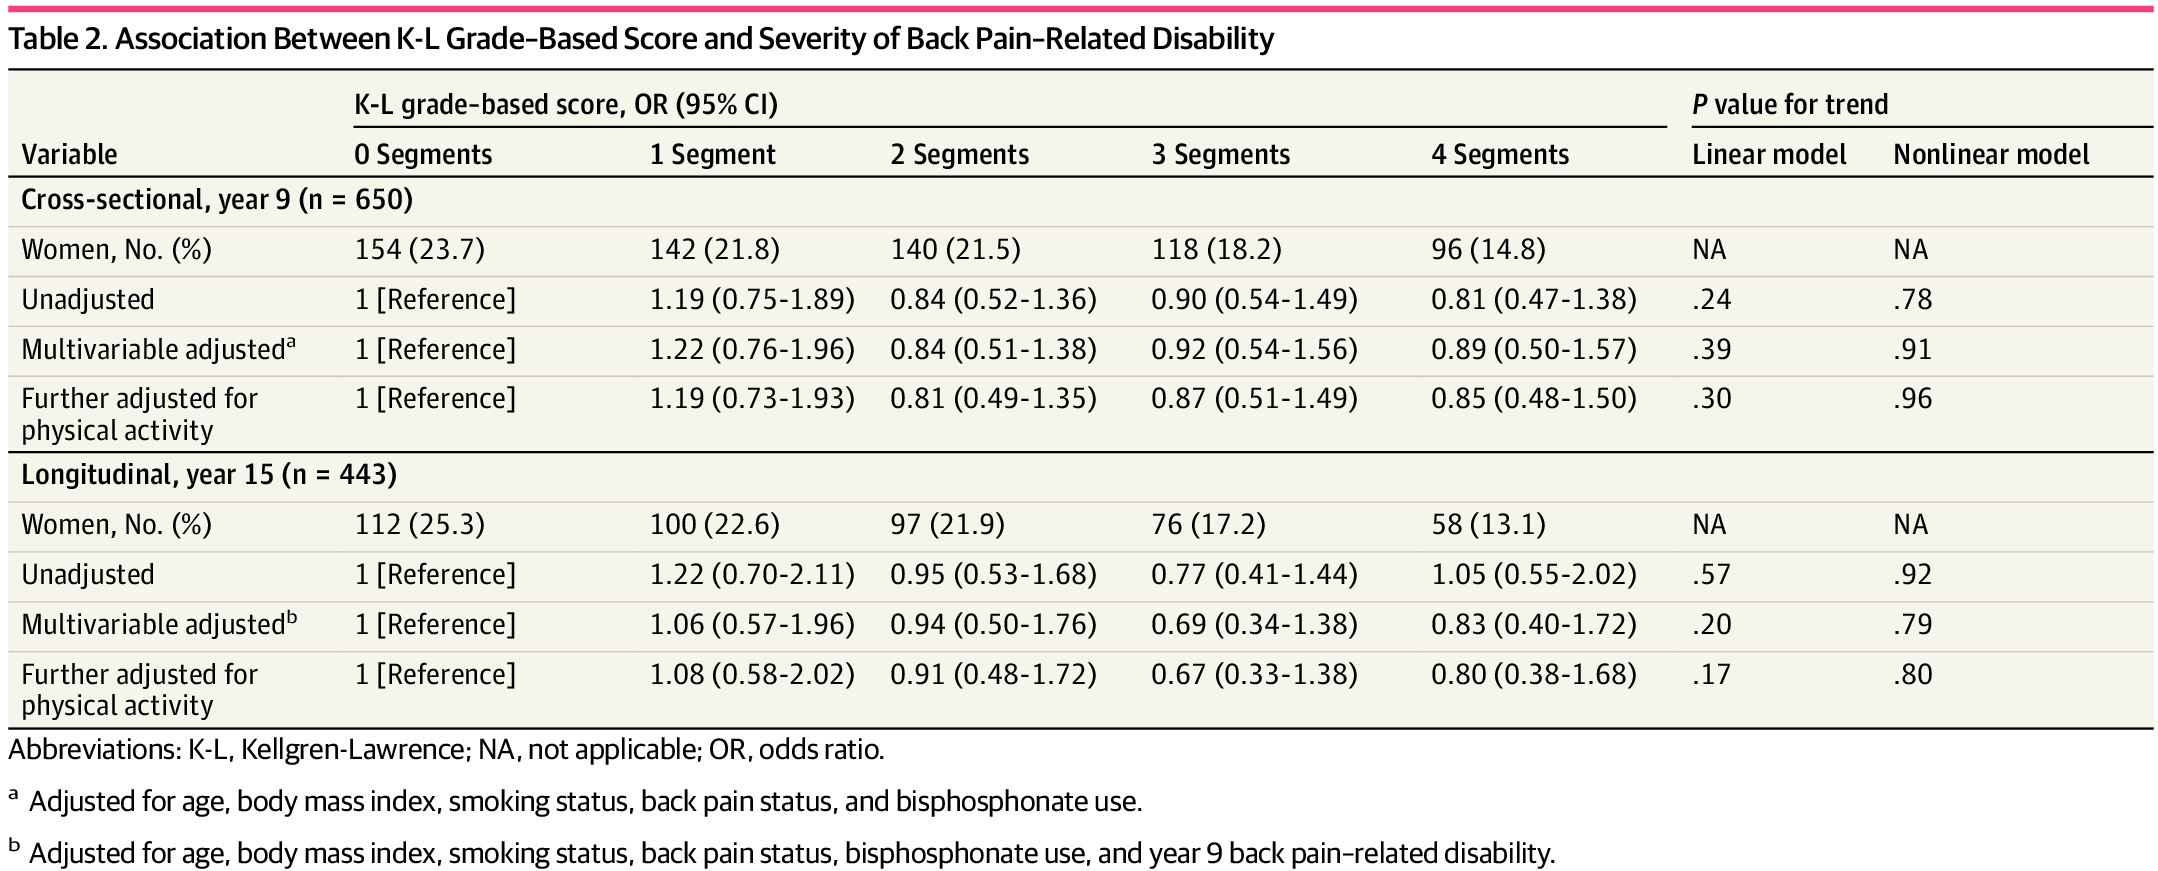
Table 2 Using a multivariable ordinal logistic regression model, we found that women who had 1 or more segments with lumbar spine radiographic K-L grade–based changes were not statistically more likely to report more disability compared with women with no observed changes in both cross-sectional (eg, 1 segment vs 0 segments; step 2 model; OR, 1.22 [95% CI, 0.76–1.96]) and longitudinal analyses (Table 2). When further adjustment was made for physical activity, the results were similar (OR, 1.19 [95% CI, 0.73–1.93]). No evidence was found to support a linear or nonlinear trend between number of segments with lumbar spine radiographic changes and the severity of back pain–related disability.
Osteophyte Grade–Based Score and Disc Space Narrowing Grade–Based Score
Table 3 For osteophyte grade–based score, no statistically significant association was found between the number of lumbar segments with radiographic changes and the severity of back pain–related disability in both cross-sectional (eg, 1 segment vs 0 segment; step 2 model; OR, 0.83 [95% CI, 0.57–1.22]) and longitudinal analyses (Table 3). Similar results were observed when further adjustments were made in the models to account for participation in physical activity in both cross-sectional and longitudinal analyses. In the longitudinal analysis, a greater number of affected segments were linearly associated with less severe back pain–related disability (step 2 model).
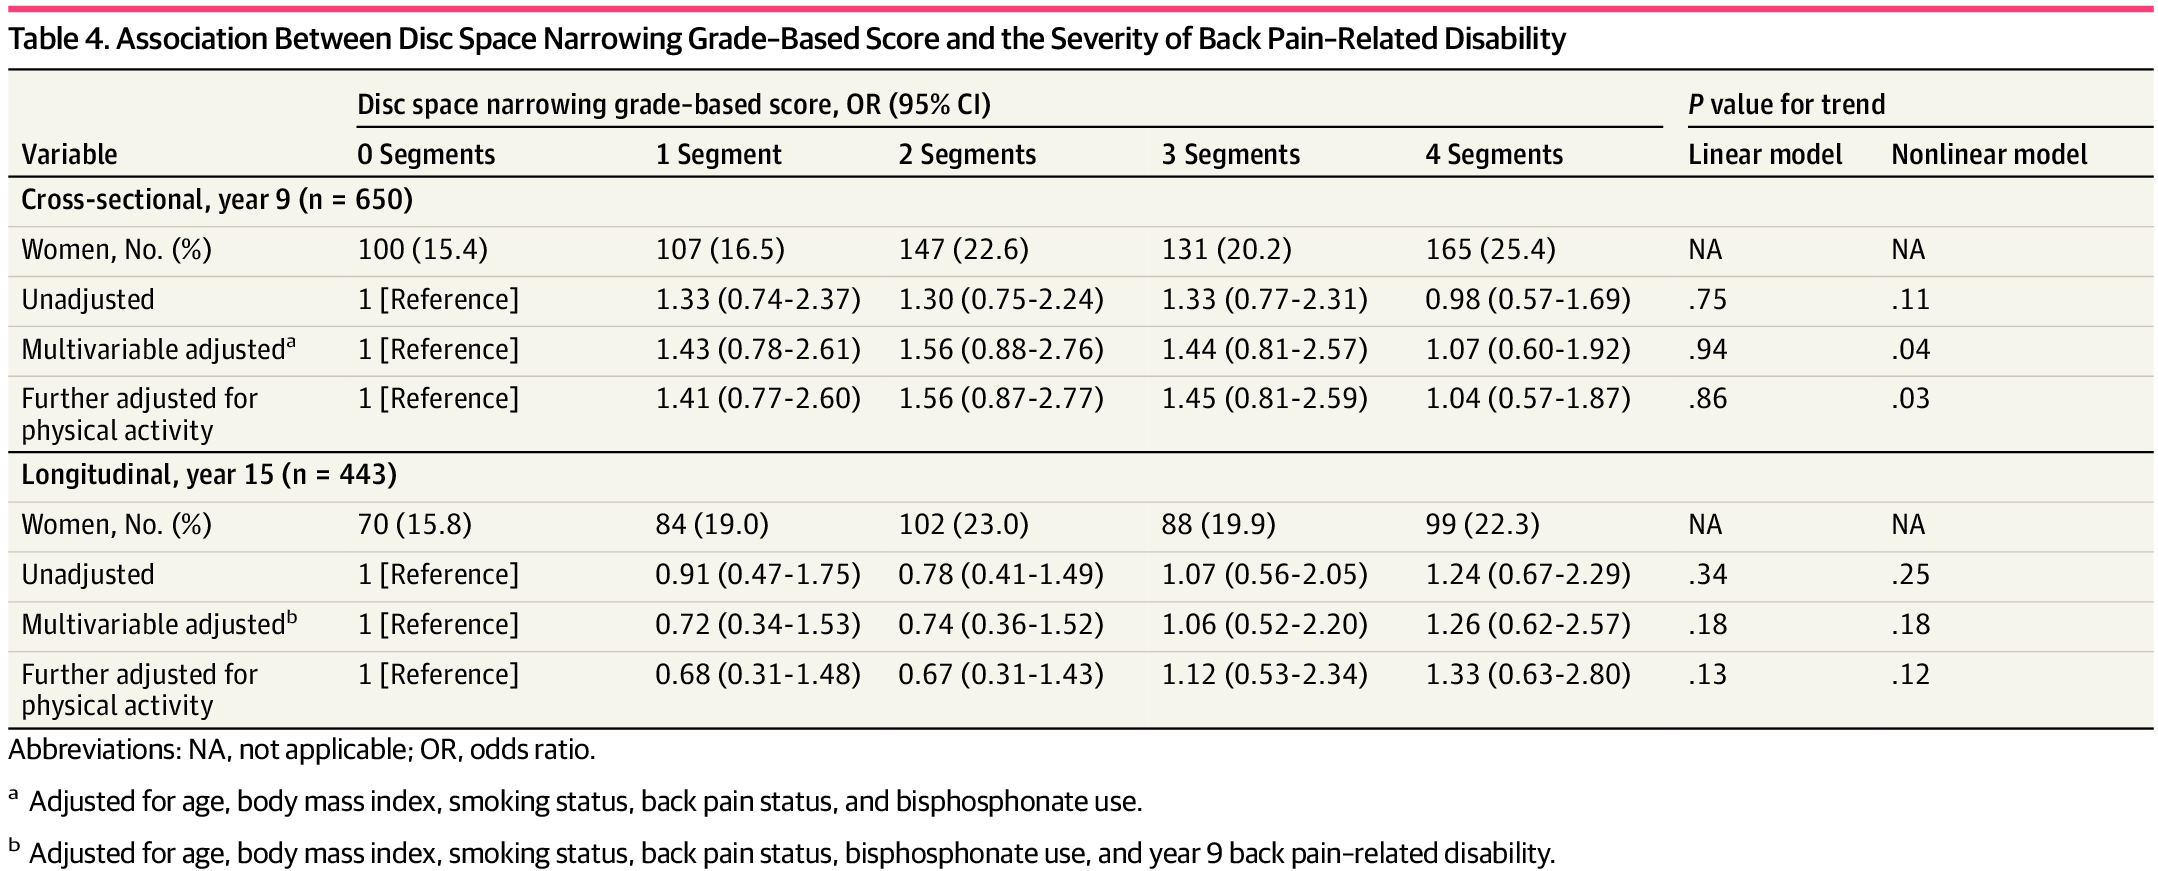
Table 4 For the disc space narrowing grade–based score, no statistically significant association was observed between the number of lumbar segments with radiographic changes and the severity of back pain–related disability in both cross-sectional (eg, 1 segment vs 0 segment; step 2 model; OR, 1.43 [95% CI, 0.78–2.61]) and longitudinal analyses (Table 4). Results were similar when we further adjusted for physical activity (OR, 1.41 [95% CI, 0.77–2.60]). For the cross-sectional analyses, a higher number of segments of lumbar spine radiographic characteristics were nonlinearly associated with less severe back pain–related disability (step 2 model).
Exploratory and Sensitivity Analyses
We did not find interactions with age, BMI, or smoking status (eTable 3 in the Supplement) between lumbar spine radiographic changes and the severity of back pain–related disability. Overall, our results remained similar under extensive sensitivity analyses (eAppendices 3–8 and eTables 4–25 in the Supplement). All E-values are listed in eTable 26 in the Supplement.
Discussion
Key Results
In this cohort of middle-aged women from Chingford in east London, UK, no evidence was found to support an association between a higher number of segments with lumbar radiographic changes (K-L grade, osteophyte, and disc space narrowing) and more severe back pain–related disability. Our results remained unchanged after including potential interactions with important confounders, such as age, BMI, and smoking status, and after extensive sensitivity analyses.
Comparison With Previous Studies
For K-L results, our findings contradict those of Lee et al, [15] who found that K-L grades were significantly associated with the Oswestry Disability Index. The main reason for such a discrepancy in results may be the design features of the study by Lee et al, [15] which only included cross-sectional analyses with insufficient adjustment for important confounders (eg, physical activity, smoking status, and BMI). For osteophyte results, the results from the cross-sectional analyses are consistent with a previous cross-sectional study by Perera et al, [16] who identified that the presence of osteophytes on radiographs was not associated with physical disability measured with the Oswestry Disability Index. However, results from our longitudinal analyses indicated that a greater number of affected segments were linearly associated with less severe back pain–related disability. One possible explanation is the biomechanical stability provided by spinal osteophytes, which have been proven to increase spinal resistance in compression. [30] Another explanation is that the results simply reflect large numbers of analyses completed, which need future studies to verify. For disc space narrowing results, our results are similar to those of Perera et al [16] but different than the findings of Lee et al. [15] Such differences could also be associated with the methodological limitations already described in the study conducted by Lee et al. [15] Overall, the prevalence of lumbar spine radiographic findings in our study is similar to that of previous studies that indicated that many imaging-based spinal radiographic changes are likely part of normal, asymptomatic aging. [31]
Strengths and Limitations
Our study has several strengths. To our knowledge, this is the first study to create a composite score that reflects the overall association of lumbar spine radiographic changes (ie, number of affected segments and severity of changes) with the severity of back pain–related disability. We used population-based data that contain a long-term follow-up with good recruitment and retention rates, and multiple potential confounders were measured. We also overcame some methodological limitations from previous studies; we included a cohort study design and incorporated a systematic way to select and control confounders, we have repeated measures of back pain–related disability that allow us to adjust for baseline disability, we assessed the potential interaction term, and we performed extensive sensitivity analyses to evaluate the robustness of the results.
Limitations also need to be considered. First, the Chingford 1,000 Women Study included middle-aged women in a specific area of the UK. We must exercise caution when generalizing the results to men, other age groups, other racial/ethnic groups, or other countries. Second, as with most studies, there is the potential for residual confounding (eg, participation in physical activity was measured 3 years before baseline). Third, the labeling of the images may have introduced potential bias in our results, given that there was only 1 observer and that lumbar spine levels were decided by the clinical experience. Fourth, owing to data unavailability, we could not establish whether there was any association between other radiologic changes, including spondylolisthesis or vertebral body height (ie, osteoporotic fractures), and severity of functional limitation. Fifth, although our outcome correlated well with the Oswestry Disability Questionnaire, it lacked strict validation. Sixth, although we aimed to focus on LBP–related disability, we only had a back pain variable, which might be slightly different from LBP.
Implications for Practice and Research
Clinicians may use the results of this study to educate patients and their colleagues that lumbar radiographic findings cannot provide prognostic information on back pain–related disability, further adding to the evidence supporting the urge to reduce unnecessary imaging referrals. Future studies should include participants of both sexes and larger sample sizes and should include multiple centers to increase external validity. The association between the findings of complex imaging (eg, computed tomography scans, magnetic resonance imaging, or nuclear bone scans) and symptom severity in people with LBP needs to be further explored, considering the increasing use of such imaging.
Conclusions
In this cohort of middle-aged, community-dwelling women, there was no evidence to support an association between a higher number of lumbar segments with radiographic changes (K-L grade, osteophytes, and disc space narrowing) and more severe back pain–related disability cross-sectionally or over time. The findings suggest that the changes detected on lumbar radiographs provide limited value for decision-making regarding back pain management in this population.
Open Access:
This is an open access article distributed under the terms of the CC-BY License. © 2021 Chen L et al. JAMA Network Open.
Author Contributions:
Drs Chen and Perera had full access to all of the data in the study and take responsibility for the integrity of the data and the accuracy of the data analysis. Drs Arden and M. L. Ferreira contributed equally as co–senior authors.
Concept and design: Chen, Perera, Radojcic, Beckenkamp, P.H. Ferreira, Spector, Arden, M. L. Ferreira.
Acquisition, analysis, or interpretation of data: Chen, Perera, Beckenkamp, Hart, Arden, M. L. Ferreira.
Drafting of the manuscript: Chen, Beckenkamp, Spector, Arden.
Critical revision of the manuscript for important intellectual content: Chen, Perera, Radojcic, Beckenkamp, P. H. Ferreira, Hart, Arden, M. L. Ferreira.
Statistical analysis: Chen, Spector.
Obtained funding: Hart.
Administrative, technical, or material support: Chen, Perera, Hart.
Supervision: Beckenkamp, P. H. Ferreira, Arden, M. L. Ferreira.
Funding/Support:
Arthritis Research UK (now Versus Arthritis) and the Oxford NIHR Musculoskeletal Biomedical Research Unit provided funding support to the study.
Conflict of Interest Disclosures:
Dr Spector reported serving as a scientific consultant for Zoe Global Ltd. Dr Arden reported receiving personal fees from Pfizer/Lilly and Bristows LLP and grants from Merck outside the submitted work. No other disclosures were reported.References:
GBD 2017 Disease and Injury Incidence and Prevalence Collaborators. Global, regional, and national incidence, prevalence, and years lived with disability for 354 diseases and injuries for 195 countries and territories, 1990-2017: a systematic analysis for the Global Burden of Disease Study 2017 . Lancet. 2018;392(10159):1789-1858
Hartvigsen J, Hancock MJ, Kongsted A, Louw Q, Ferreira ML, Genevay S, Hoy D, Karppinen J et al.
What Low Back Pain Is and Why We Need to Pay Attention
Lancet. 2018 (Jun 9); 391 (10137): 2356–2367
This is the second of 4 articles in the remarkable Lancet Series on Low Back PainJordan KP, Kadam UT, Hayward R, Porcheret M, Young C, Croft P.
Annual consultation prevalence of regional musculoskeletal problems in primary care: an observational study.
BMC Musculoskelet Disord. 2010;11:144Chou R, Qaseem A, Owens DK, Shekelle P?;
Clinical Guidelines Committee of the American College of Physicians.
Diagnostic imaging for low back pain: advice for high-value health care
from the American College of Physicians.
Ann Intern Med. 2011;154(3):181-189Foster NE, Anema JR, Cherkin D, Chou R, Cohen SP, et al.
Prevention and Treatment of Low Back Pain:
Evidence, Challenges, and Promising Directions
Lancet. 2018 (Jun 9); 391 (10137): 2368–2383
This is the third of 4 articles in the remarkable Lancet Series on Low Back PainNational Institute for Health and Care Excellence (NICE):
Low Back Pain and Sciatica in Over 16s: Assessment and Management (PDF)
NICE Guideline, No. 59 2016 (Nov): 1–1067Downie A, Hancock M, Jenkins H, et al.
How common is imaging for low back pain in primary and emergency care? systematic review
and meta-analysis of over 4 million imaging requests across 21 years.
Br J Sports Med. 2020;54(11):642-651Wall BF, Kendall GM, Edwards AA, Bouffler S, Muirhead CR, Meara JR.
What are the risks from medical X-rays and other low dose radiation?
Br J Radiol. 2006;79(940):285-294Chou R, Fu R, Carrino JA, Deyo RA.
Imaging strategies for low-back pain: systematic review and meta-analysis.
Lancet. 2009;373(9662):463-472Rhodes LA, McPhillips-Tangum CA, Markham C, Klenk R.
The power of the visible: the meaning of diagnostic tests in chronic back pain.
1999;48(9):1189-1203Schers H, Wensing M, Huijsmans Z, van Tulder M, Grol R.
Implementation barriers for general practice guidelines on low back pain: a qualitative study.
Spine (Phila Pa 1976). 2001;26(15):E348-E353Taylor S, Bishop A.
Patient and public beliefs about the role of imaging in the management of
non-specific low back pain: a scoping review.
Physiotherapy. 2020;107:224-233Jarvik JG, Gold LS, Comstock BA, et al.
Association of early imaging for back pain with clinical outcomes in older adults.
JAMA. 2015;313(11):1143-1153Kellgren JH, Lawrence JS.
Radiological assessment of osteo-arthrosis.
Ann Rheum Dis. 1957;16(4):494-502Lee SY, Cho NH, Jung YO, Seo YI, Kim HA.
Prevalence and risk factors for lumbar spondylosis and its association with
low back pain among rural Korean residents.
J Korean Neurosurg Soc. 2017;60(1):67-74Perera RS, Dissanayake PH, Senarath U, Wijayaratne LS, Karunanayake AL, Dissanayake VHW.
Associations between disc space narrowing, anterior osteophytes and disability
in chronic mechanical low back pain: a cross sectional study.
BMC Musculoskelet Disord. 2017;18(1):193Bartlett SJ, Ling SM, Mayo NE, Scott SC, Bingham CO III.
Identifying common trajectories of joint space narrowing over two years in knee osteoarthritis.
Arthritis Care Res (Hoboken). 2011;63(12):1722-1728Felson DT, Gale DR, Elon Gale M, et al.
Osteophytes and progression of knee osteoarthritis.
Rheumatology (Oxford). 2005;44(1):100-104Vandenbroucke JP, von Elm E, Altman DG, et al;
STROBE initiative. Strengthening the Reporting of Observational Studies in
Epidemiology (STROBE): explanation and elaboration.
Ann Intern Med. 2007;147(8):W163-94von Elm E, Altman DG, Egger M, Pocock SJ, Gřtzsche PC, Vandenbroucke JP?;
STROBE Initiative. The Strengthening the Reporting of Observational Studies
in Epidemiology (STROBE) statement: guidelines for reporting observational studies.
Ann Intern Med. 2007;147(8):573-577Hassett G, Hart DJ, Manek NJ, Doyle DV, Spector TD.
Risk factors for progression of lumbar spine disc degeneration: the Chingford Study.
Arthritis Rheum. 2003;48(11):3112-3117Lane NE, Nevitt MC, Genant HK, Hochberg MC.
Reliability of new indices of radiographic osteoarthritis of the hand and hip
and lumbar disc degeneration.
J Rheumatol. 1993;20(11):1911-1918Co YY, Eaton S, Maxwell MW.
The relationship between the St. Thomas and Oswestry Disability Scores and
the severity of low back pain.
J Manipulative Physiol Ther. 1993;16(1):14-18DAGitty.net.
DAGitty—draw and analyze causal diagrams.
Accessed April 7, 2021.
http://www.dagitty.net/Textor J, van der Zander B, Gilthorpe MS, Li?kiewicz M, Ellison GT.
Robust causal inference using directed acyclic graphs: the R package “dagitty”.
Int J Epidemiol. 2016;45(6):1887-1894Harrell FE Jr.
Regression Modeling Strategies: With Applications to Linear Models, Logistic
and Ordinal Regression, and Survival Analysis.
Springer; 2015Brookhart MA, Schneeweiss S, Rothman KJ, Glynn RJ, Avorn J, Stürmer T.
Variable selection for propensity score models.
Am J Epidemiol. 2006;163(12):1149-1156Rothman KJ, Greenland S, Lash TL.
Modern Epidemiology.
Lippincott Williams & Wilkins; 2008.Harrell FE Jr.
Package ‘Hmisc.’ CRAN2018.
Accessed July 22, 2020.
https://cran.uib.no/web/packages/Hmisc/Hmisc.pdfAl-Rawahi M, Luo J, Pollintine P, Dolan P, Adams MA.
Mechanical function of vertebral body osteophytes, as revealed by experiments on cadaveric spines.
Spine (Phila Pa 1976). 2011;36(10):770-777Brinjikji W, Luetmer PH, Comstock B, et al.
Systematic literature review of imaging features of spinal degeneration in asymptomatic populations.
AJNR Am J Neuroradiol. 2015;36(4):811-816
Return to RADIOLOGY
Return to LOW BACK PAIN
Since 5-24-2021

| Home Page | Visit Our Sponsors | Become a Sponsor |
Please read our DISCLAIMER |