PMC full text:
Published online 2020 Feb 24. doi: 10.1080/10669817.2020.1730056
Figure 1.
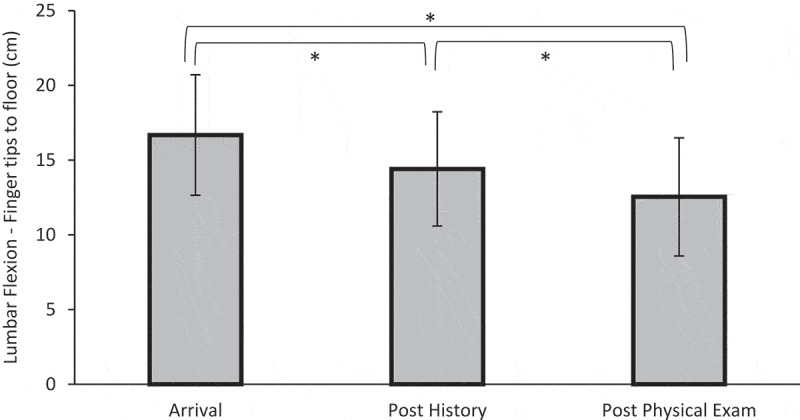
Means of lumbar flexion between each time point with 95% confidence interval bars. *p < 0.05 between arrival and post history, post history and post physical exam, and arrival and post physical exam