JAMA Netw Open 2019 (Jan 4); 2 (1): e186828
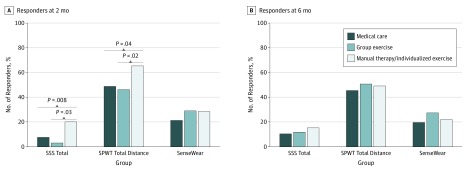
Figure 2. Responder Analyses (≥30% Improvement From Baseline) by Group and Time.

Logistic regression models were used to compare the between-group proportions, controlling for baseline SSS, SPWT, and age. Only the 4 significant 2-way contrasts at 2 months are depicted by the gray lines and P values. All other contrasts at 2 months and 6 months were not significant. SenseWear indicates physical activity; SPWT, self-paced walking test; SSS, Swiss Spinal Stenosis questionnaire.