

Prognosis and Course of Pain in Patients With Chronic Non-Specific
Low Back Pain: A 1-year Follow-Up Cohort StudyThis section is compiled by Frank M. Painter, D.C.
Send all comments or additions to: Frankp@chiro.org


FROM: European Journal of Pain 2015 (Sep); 19 (8): 1101–1110 ~ FULL TEXT
K Verkerk, P A J Luijsterburg, M W Heymans, I Ronchetti, A L Pool-Goudzwaard, H S Miedema, B W Koes
Rotterdam University of Applied Sciences,
The Netherlands.
2Spine & Joint Centre,
Rotterdam, The Netherlands.
3Department of General Practice,
Erasmus MC, University Medical Center,
Rotterdam, The Netherlands.
Background: It remains unclear to what extent patients recover from chronic non-specific low back pain (NSLBP).
The objective of this study was to determine(1) the course of chronic NSLBP in tertiary care and
(2) which factors predicted 5- and 12-month outcomes.Methods: This prospective study includes 1760 chronic NSLBP patients from a rehabilitation clinic (mean age 40.1 years, SD 10.6). After baseline measurement, patients followed a 2-month multidisciplinary therapy programme; evaluation took place at 2, 5 and 12 months post baseline. Recovery was defined as
(1) relative recovery [30% improvement on the pain, visual analogue scale (VAS) compared with baseline] and
(2) absolute recovery (VAS pain ≤ 10 mm). The multivariate logistic regression analysis included 23 baseline characteristics.Results: Patient-reported intensity of back pain decreased from 55.5 (SD 23.0) at baseline to 37.0 (SD 23.8), 35.3 (SD 26.1) and 32.3 (SD 26.9) at 2-, 5- and 12-month follow-up, respectively. Younger age, back pain at baseline, no psychological/physical dysfunction (Symptom Check List-90, item 9), and higher baseline scores on the physical component scale and mental component scale of quality of life (Short Form-36) were positively associated with recovery at 5 and 12 months. At 5-month follow-up, higher work participation at baseline was also a prognostic factor for both definitions of recovery. At 12-month follow-up, having co-morbidity was predictive for both definitions.
Conclusion: The results of this study indicate that in chronic NSLBP patients, bio-psychosocial prognostic factors may be important for clinicians when predicting recovery in back pain intensity during a 1-year period.
What’s already known about this topic?
Chronic back pain causing globally severe pain and disability.
Little information is available regarding course and predictors for improvement in back pain intensity after multidisciplinary treatment.
What does this study add?
Back pain intensity decreased during 12-month follow-up.
Younger age, back pain intensity, no psychological/physical dysfunction and higher baseline scores on quality of life were associated with low back pain intensity at 5 and 12 months.
From the FULL TEXT Article:
Introduction
A recent study in the Lancet [Vos et al., 2012] reported that low back pain (LBP) stands out as the leading musculoskeletal disorder because of a combination of similarly high prevalence and a greater disability weight associated with this health state. LBP was one of the four most common disorders in all regions, and was the leading cause of years lived with disabilities (YLDs) in all developed countries. Low back and neck pain accounted for 70% of all YLDs from musculoskeletal disorders, and for every YLD due to neck pain there were 2.5 YLDs related to LBP. The burden, as estimated in this study, is substantially higher than previously assessed 20 years ago. Across all countries surveyed, respondents consistently recorded high levels of health loss caused by pain. These findings combined with the 33.3% increase in YLDs from 1990 to 2010 driven largely by population growth and ageing have important implications for health systems.
Non-specific low back pain (NSLBP) is defined as pain and discomfort, localized below the costal margin and above the inferior gluteal folds, with or without leg pain [de Vet et al., 2002; Koes et al., 2004]. Because this pain often leads to medical consultations and/or sick leave, there is considerable medical and socio-economic impact on the individual, family and society [de Vet et al., 2002; Koes et al., 2004]. In the Netherlands, about 40–50% of the population experiences LBP during a 12-month period. Furthermore, about one-fifth of the adult population has reported chronic NSLBP, i.e., symptoms present for ≥3 months [RIVM, 2007], and about 14% of the registered disabled is incapacitated due to spine-related disorders [RIVM, 2007]. Therefore, the economic burden of chronic NSLBP is particularly high and is compounded by the psychological burden on patients. Given the high prevalence, it is important to study risk factors for development, as well as the course of chronic NSLBP and factors that influence its prognosis. Such information is important for patient education/management and to develop interventions for chronic NSLBP, especially if modifiable prognostic factors are identified. However, few data are available on the clinical course of chronic NSLBP and the prognostic factors related to outcomes at follow-up [Verkerk et al., 2012].
Therefore, this prospective cohort study aims to:(1) describe the course of back pain intensity in patients with chronic NSLBP after receiving multidisciplinary therapy; and
(2) develop a prognostic model predicting recovery in these patients at 5- and 12-month follow-up.
Methods
Study design and population
Patients were recruited (January 2003 to December 2008) in a multidisciplinary outpatient rehabilitation clinic, the ‘Spine & Joint Centre’ (SJC) in Rotterdam, the Netherlands. Patients were evaluated by means of physical examinations and/or questionnaires at baseline, and at 2 and 5 months at the SJC and postal at 12-month follow-up. The Medical Ethics Committee of SJC approved the study protocol and all patients provided informed consent. Details on the study design of this prospective cohort study and intervention are published elsewhere [Verkerk et al., 2011].
Patients with chronic NSLBP not recovering after primary and/or secondary care were referred by their general practitioner or specialist to the SJC for a diagnostic consultation. Inclusion criteria for this study were:(1) men and women aged ≥18 years;
(2) with chronic NSLBP (i.e., duration of LBP for ≥3 months);
(3) previous and insufficient treatment in primary and/or secondary care (e.g., physiotherapy); and
(4) signed informed consent.Exclusion criteria were insufficient knowledge of the Dutch language; signs indicating radiculopathy, asymmetric Achilles tendon reflex and/or (passive) straight leg raise test restricted by pain in the lower leg; positive magnetic resonance imaging findings for disc herniation; recent (<6 months) fracture, neoplasm or recent previous surgery (<6 months) of the lumbar spine, the pelvic girdle, the hip joint or the femur; specific causes such as ankylosing spondylitis and systemic disease of the locomotor system; and being pregnant or ≤6 months post-partum at the moment of consultation.
Outcome measures and defining recovery
The outcome pain intensity is one of the five outcomes (back pain intensity, disability due to back pain, work participation, quality of life and patients’ perceived recovery) measured in this prospective cohort study. The choice for the outcome pain intensity is due to its importance to the patient and also the most published outcome measurement in prognostic studies [Verkerk et al., 2012], but the main objective of the rehabilitation programme is normal behaviour of movements [vanWingerden, 2009; Verkerk et al., 2011]. To determine the course of back pain intensity in patients with chronic NSLBP, the visual analogue scale (VAS) was used (range 0 mm = no back pain to 100 mm = unbearable back pain). Recovery was defined in two ways based on a minimally clinical important change in LBP as described by Ostelo et al. [2008] and Helmhout et al. [2010] for intensity of LBP. First, ‘relative recovery’ was defined as a 30% or more improvement compared with baseline (considered a clinically relevant difference) on the VAS back pain at follow-up measurements [Ostelo and de Vet, 2005; Ostelo et al., 2008]. Second, ‘absolute recovery’ was defined as a VAS score of ≤10 mm at follow-up measurement.
Potential prognostic factors
Initially, 47 prognostic factors were considered relevant for inclusion in the analyses. However, to comply with the rule of at least 10 events per variable in the analysis, we had to restrict the number of potential prognostic factors [Peduzzi et al., 1996]. The choice for eligible factors was made using the policy of Delphi procedure in which the factors were independently scored (on a 4-point Likert scale ranging from 1 = very important to 4 = not important) by eight experts [Verhagen et al., 1998; Snyder-Halpern, 2001; Verkerk et al., 2012]. The panel has experience in the treatment (or management) of patients with chronic NSLBP by research and/or working in the field; we consider them as experts. There were three rounds and each time the responses were aggregated, tabulated, summarized and returned to the experts. In the third round, the experts were asked to decide whether to keep or remove the factor from the list through consensus meeting. The final list consisted of 23 potential factors that were included by at least 80% consensus [Verkerk et al., 2011].
The following continuous variables (measured at baseline) were used in the analysis: age, duration of back pain in years, present back pain intensity (VAS: 0–100 mm), degree of present fatigue (VAS 0–100 mm), Quebec Back Pain Disability Scale (QBPDS: 0–100), Tampa Scale for Kinesiophobia (TSK: 17–68), Short Form Health Survey-36 [SF- 36, physical component scale (PCS) and mental component scale (MCS)], Symptom Checklist-90 (SCL-90; item 9; psychoneurosis), work participation (0–100%) and the B200 Isostation (strength of back extension in newton).
The following categorical variables (split into ≥2 categorical variables) were included: body mass index (BMI; ≤24.9, 25–29.9, ≥30 kg/m2), cause of back pain (accident movement; after physical load; during pregnancy or after delivery; unknown; surgery pelvis/back or herniated nucleus pulposus), pain in the previous 3 months (stable; increased; decreased), and the duration of walking, sitting and standing (0–15, 16–30, 31–60, 61 min) during daily activities. Dichotomized variables were gender, co-morbidity (none vs. having one of more co-morbidities), level of education (
Treatment at the SJC
The multidisciplinary treatment at the SJC centre used a bio-psychosocial approach consisting of 16 sessions of 3 h each during a 2-month period (total of 48 h). Patients were coached by a multidisciplinary team (e.g., a physical therapist, physician, health scientist, psychologist) [Verkerk et al., 2011]. After this 2-month period, patients are encouraged to continue the training programme independently for at least 3 months, twice a week, in a local, regular health centre located near their home environment.
Data analysisCourse of pain Descriptive statistics were used to describe the patients’ course of back pain intensity at baseline, and at 2-, 5- and 12-month follow-up. The percentage of patients with chronic NSLBP defined as recovered based on a 30% improvement of the back pain intensity and absolute recovery (VAS pain ≤ 10 mm) at 2-, 5- and 12-month follow-up was calculated.
Model development Data from all patients with chronic NSLBP receiving a multidisciplinary treatment were used to develop a prognostic model for back pain intensity recovery at 5 and 12 months.Step 1. Using a correlation matrix, eligible prognostic factors were identified which were highly correlated (r > 0.8). This was the case for the B200 Isostation (strength in flexion, extension, lateroflexion, rotation) and the SCL-90 (items 1–8). Only the B200 extension and the total score item 9 of the SCL-90 were included in the analysis [Harrell, 2001].
Step 2. The continuous factors were checked for linearity using spline regression curves; this revealed a non-linear relationship between BMI and the score on VAS pain for back pain. Therefore, BMI was changed into a categorical variable [Altman et al., 2009].
Step 3. Imputation of missing values in the data was carried out by multiple imputation. A total of five imputed datasets were used [Steyerberg et al., 2004; Donders et al., 2006; Altman et al., 2009]. To develop our prognostic model, a multivariable logistic regression analysis was performed [Harrell, 2001; Moons et al., 2009a,b; Royston et al., 2009]. The results of the analysis (parameters of the prognostic model) were compared when using 40 imputed datasets. The alternative option of 40 imputed datasets was tested because 40% of the patients were missing at 12-month follow-up. We decided to perform the analyses with the five imputed datasets because of similar results. Because the results were similar, five imputed datasets were used as primary analysis method. We also compared the results with complete case analysis (CCA), i.e., all patients with missing data were excluded from the analyses [Harrell, 2001; Steyerberg et al., 2004; Donders et al., 2006].
Step 4. The most important prognostic variables were selected using a multivariable logistic regression analysis (stepwise method, backward likelihood ratio, p < 0.157) [Harrell, 2001; Steyerberg et al., 2013]. The selection of variables was performed over all the imputed datasets using Rubin’s rules [Wood et al., 2008]. To assess whether the level of significance influenced the final prognostic model for all models, the selection of variables was repeated with p-values of 0.05 and 0.157.
Step 5. A sensitivity analysis was also performed using VAS cut-off values of ≤20 mm for absolute recovery and the same p-values [Ostelo and de Vet, 2005; Kamper et al., 2010a,b,c].
Missing data and the impact of non-response at 12-month follow-up were analysed by comparing the baseline characteristics of participants responding at 12 months with those who did not respond. All analyses were done using SPSS version 18.0 (SPSS Inc., Chicago, IL, USA) and R software (R Foundation for Statistical Computing, Vienna, Austria).Performance of the prognostic model We checked the performance of the model with regard to the goodness of fit (Hosmer–Lemeshow test), the explained variation and the discriminative ability of the model. The explained variation is the extent to which the outcome can be predicted by (the predictors in) the model in current dataset(s). The discriminative ability is reflected by the area under the receiver operating characteristics curve (AUC). The AUC represents the ability of the prognostic model to identify the patient who will recover from back pain intensity in two patients with different outcomes, and ranges from 0.5 (chance) to 1.0 (perfect discrimination) [Harrell et al., 1996]. Bootstrapping techniques were used to internally validate our models, i.e., to simulate the performance with respect to the explained variance and the AUC in comparable patient datasets [Vergouwe et al., 2002; Heymans et al., 2007; Moons et al., 2009a,b; Royston et al., 2009].
All analyses were done with SPSS version 18.0 and R software.
Results
Population

Table 1 A total of 1,760 patients [mean age 40.1 (10.6) years; 74.3% women] with chronic NSLBP participated in the study. Of these, 1,695 (96.3%) completed the 2-month multidisciplinary treatment, 1564 (88.9%) completed the 5-month follow-up, and 960 (54.5%) completed the 12-month follow-up. Table 1 presents the baseline characteristics of the 1760 patients and the distribution of the possible prognostic factors.
Responders at 12 months were likely to be female (77.0% vs. 70.9%), married or living with one adult (90.2% vs. 81.1%), and were more often working (53.1% vs. 46.2%) than non-responders There were no differences in baseline values of outcome measures between responders and non-responders at 12 months (see Supporting Information Appendix S1).
Course of chronic LBP
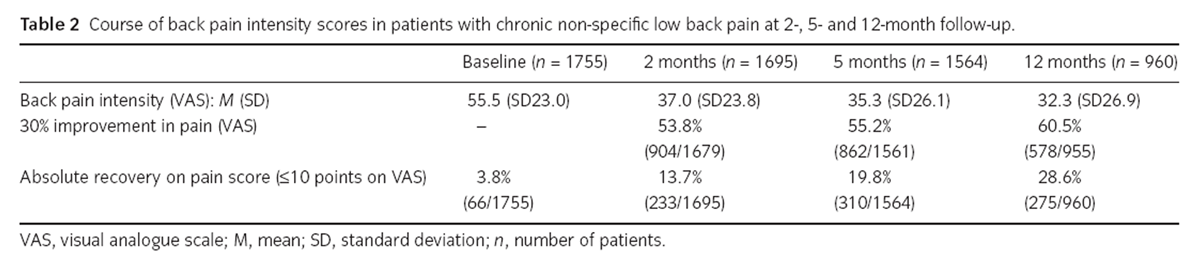
Table 2 At baseline, the participants (n = 1760) reported a mean back pain intensity of 55.5 (SD 23.0) on the 0–100 mm VAS; at the end of therapy (n = 1695), this had decreased to a mean of 37 (SD 23.8). At 5- and 12-month follow-up, the remaining patients reported mean scores of 35.3 (SD 26.1) and 32.3 (SD 26.9), respectively (Table 2).
Compared with baseline, after 2 months of therapy, a 30% (or more) improvement on the VAS was reported by 904 patients (53.8%); at 5- and 12-month follow-up, these data were 862 (55.2%) and 578 (60.5%) patients, respectively.
For absolute recovery from back pain, at baseline 66 patients (3.8%) had a score ≤10 on the VAS but were included in therapy for other outcomes, e.g., back pain disability, quality of life or work participation [Verkerk et al., 2011]. After 2 months of therapy, 233 patients (13.7%) scored ≤10 on the VAS; at 5 and 12 months, these data were 310 (19.8%) and 275 (28.6%) patients, respectively.
Relative recovery: prognostic models at 5- and 12-month follow-up
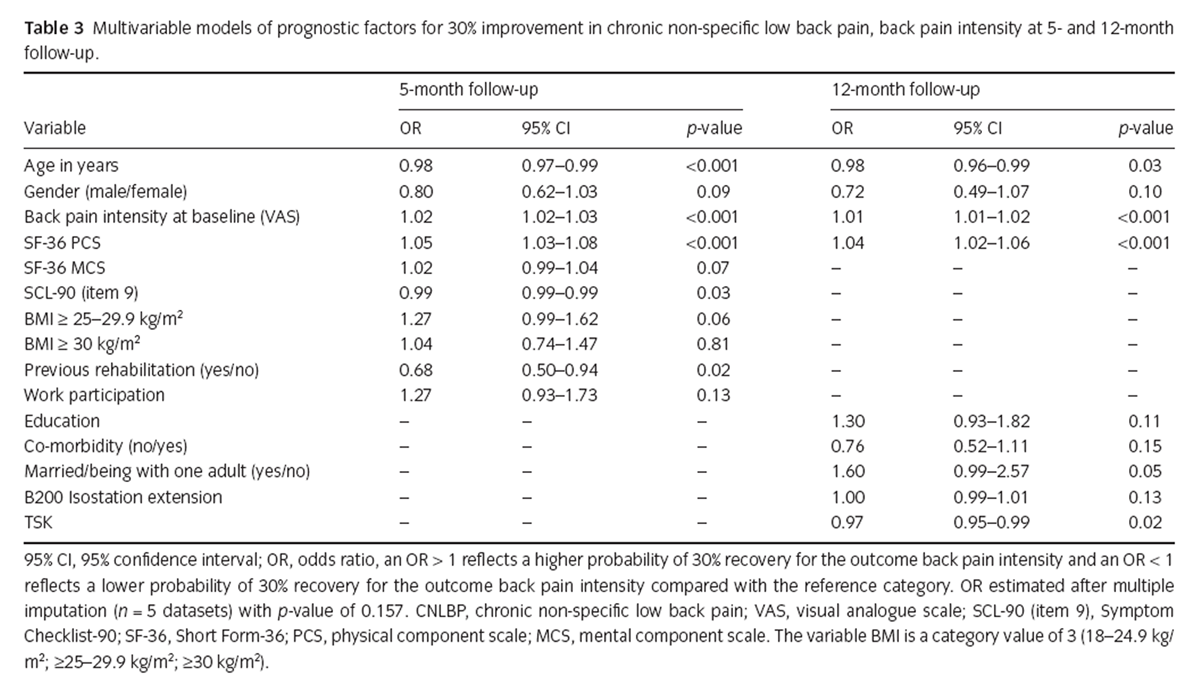
Table 3 At 5-month follow-up, multivariate analyses resulted in a final model (AUC = 0.66, 95% CI 0.64–0.69) which included nine prognostic factors, together explaining 11% of the variation in outcome: younger age, female gender, a higher BMI > 25 kg/m2 at baseline, no previous rehabilitation treatment, more back pain intensity at baseline, no psychological/physical dysfunction (psycho-neuroticism) as measured with the SCL-90 (item 9), higher scores on the SF-36 PCS and MCS at baseline, and higher work participation at baseline (Table 3). The prognostic factor most strongly associated with improvement was a BMI of ≥25– 29.9 kg/m2 (OR 1.27, 95% CI 0.99–1.62) and a higher work participation at baseline (OR 1.27, 95% CI 0.93– 1.73).
At 12-month follow-up, the final multivariate regression model (AUC = 0.65, 95% CI 0.61–0.67) included nine prognostic factors, together explaining 10% variation in outcome: younger age, female gender, being married/living with one adult, higher level of education, no co-morbidity, more back pain intensity at baseline, higher strength at the extension direction with the B200 Isostation at baseline, no fear of movement at baseline, and higher scores on the PCS with the SF-36. Being married or living with one adult (OR 1.6, 95% CI 0.99–2.57) was the strongest prognostic factor associated with a 30% improvement in recovery (Table 3).
With regard to internal validation of the model, the explained variance was 11% and the AUC was 0.66 (95% CI 0.64–0.69) for the 5-month model compared with 10% and 0.66 (95% CI 0.61–0.67), respectively, for the 12-month model.Sensitivity analysis for relative recovery For the 5-month follow-up, sensitivity analysis of the 30% improvement with p-values of 0.05 or 0.157, and using a CCA or 5 or 40 imputed datasets, yielded similar results on six of the nine prognostic factors. Repeating the analyses at 12 months resulted in five of the nine factors. Because (overall) similar predictors were included, this indicates that the most important prognostic factors were selected. In the various models, these sensitivity analyses showed an AUC of 0.64–0.68 at 5- and 12-month follow-up, with an explained variance of 8–11% that included four to nine of the prognostic factors.
With regard to internal validation of the model, the explained variance was 10–11%. For all models, at 5 months the AUC was 0.66. At 12-month follow-up, the explained variance was 8–11% and the AUC was 0.64–0.66 (complete data can be obtained from the first author).
Absolute recovery: prognostic models at 5- and 12-month follow-up
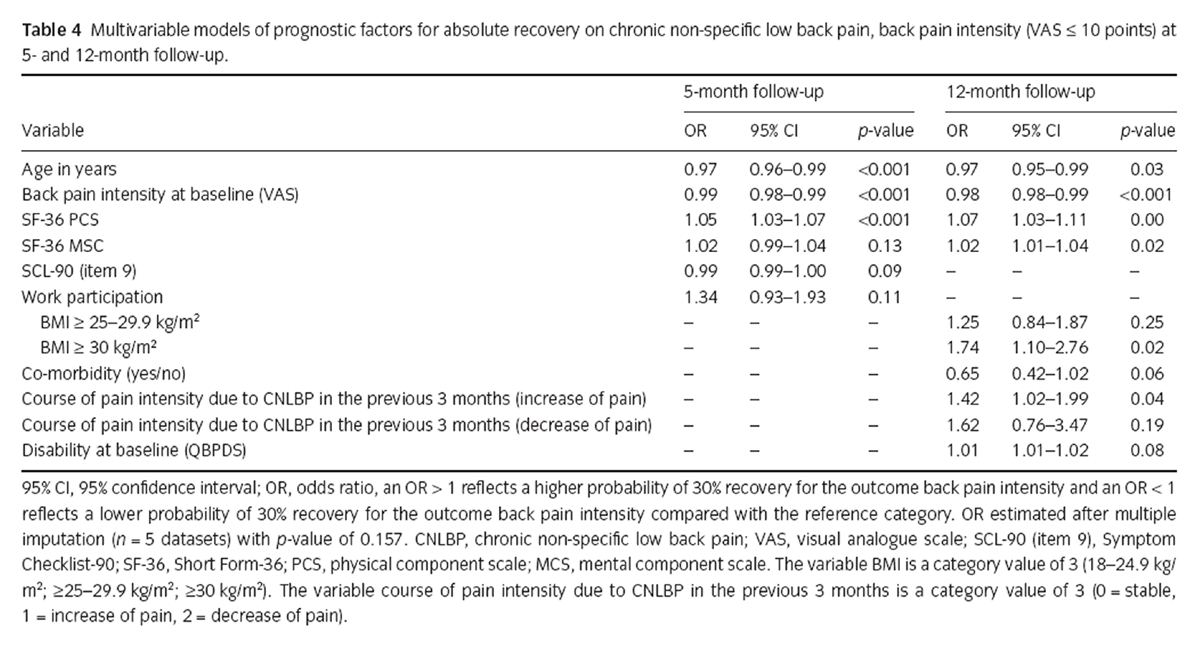
Table 4 The final multivariable model (AUC = 0.69, 95% CI 0.66–0.72) for 5-month follow-up consisted of six prognostic factors with an explained variance of 11% (Table 4): younger age, lower score on back pain at baseline, no psychological/physical dysfunction [psycho-neuroticism on SCL-90 (item 9)], higher scores on the SF-36 PCS/MCS at baseline, and more work participation at baseline. Work participation (OR 1.34, 95% CI 0.93–1.93) was the strongest prognostic factor in the model associated with absolute recovery.
The final prognostic model for 12-month follow-up consisted of eight factors: younger age, a higher BMI ≥ 30 kg/m2 at baseline, no co-morbidity, less back pain at baseline, higher scores on the SF-36 PCS and MCS at baseline, higher disability score at baseline, and having stable or more back pain intensity due to chronic NSLBP in the previous 3 months. The strongest prognostic factors associated with absolute recovery were stable or more back pain intensity due to chronic NSLBP in the previous 3 months (OR 1.42, 95% CI 1.02–1.99) and BMI ≥ 30 kg/m2 (OR 1.74, 95% CI 1.10–2.76). The explained variance was 18% with an AUC of 0.73 (95% CI 0.71–0.76).
With regard to internal validation of the model, at 5 months the explained variance was 11% and the AUC was 0.69 (95% CI 0.66–0.72); at 12-month follow-up this was 18% and 0.73 (95% CI 0.71–0.76), respectively (i.e., after the start of therapy and before/after analysing the internal validation).Sensitivity analysis for absolute recovery Sensitivity analysis of the cut-off for the VAS ≤ 10 mm with p-values of 0.05 or 0.157 and/or 5 or 40 imputed datasets or CCA for the 5- and 12-month follow-up resulted in similar prognostic factors. In the various models, multivariate analyses showed an AUC of 0.68–0.76 for the 5- and 12-month follow-up that included 4–12 prognostic factors, together explaining 10–15% of the variation.
With regard to internal validation of the model, at 5 months the explained variance was 10–12% and the AUC was 0.68–0.69 for all models compared with 11–15% and 0.70–0.71 AUC at 12-month follow-up (complete data can be obtained from the first author).
Absolute recovery (VAS ≤ 20 mm) on back pain intensity Repeating the analysis with a cut-off point of ≤20 for absolute recovery with p-values of 0.05 or 0.157 and/or 5 or 40 imputed datasets or CCA for the 5- and 12-month follow-up resulted in similar prognostic factors. These analyses had an AUC of 0.70–0.73 for the 5- and 12-month follow-up that included six to nine prognostic factors with an explained variance of 15–20%.
For internal validation of the model, at 5 months the explained variance was 16% and the AUC was 0.70 for all models, compared with 20% and 0.73, respectively, for the 12-month follow-up (complete data can be obtained from the first author).
Discussion
The course of chronic NSLBP after 2 months of cognitive behaviour therapy shows a decline of back pain that continued up to 1-year follow-up. Back pain continued to decrease, albeit more slowly, between 5- and 12-month follow-up. The most important finding of this prospective cohort study is that there were similarities in prognostic factors between the two definitions of recovery (at least 30% improvement and VAS ≤ 10 mm) and also at the different moments of follow-up. Recovery at 5- and 12-month follow-up was associated with younger age, back pain intensity at baseline and higher baseline scores on the SF-36 PCS/MCS. For both definitions of recovery, at 5-month follow-up, a higher work participation rate at baseline and no psychological/physical dysfunction (psycho-neuroticism) measured with the SCL-90 (item 9) were prognostic factors, and at 12-month follow-up co-morbidity was prognostic.
The reported decrease in back pain intensity over a 1-year period is similar to other studies performed in the general population, primary or tertiary care [Enthoven et al., 2004; Tamcan et al., 2010; Menezes Costa et al., 2012]. Our study also showed that directly after the 2-month multidisciplinary cognitive behaviour therapy at the SJC rehabilitation centre, the patients experienced the greatest change in improvement compared with the baseline in all outcomes compared with 5- and 12-month follow-up. A similar pattern was reported in the first 4–6 weeks in a recent meta-analysis [Costa et al., 2012] and other studies [Guzmán et al., 2002; Dunn and Croft, 2004; Enthoven et al., 2004; Henschke et al., 2010; Tamcan et al., 2010] describing slowly advancing reductions in average pain and disability between 6 and 52 weeks. The duration of complaints in our study population was on average 7.7 years. Recent studies [Axen and Leboeuf-Yde, 2013; Dunn et al., 2013] report that most patients with back pain appear to follow a particular pain trajectory over longer time periods. It can be that a particular pain trajectory will have certain clinical characteristics. This could influence which prognostic factor is important as also the effect of a rehabilitation programme [Axen and Leboeuf-Yde, 2013].
Our systematic review on prognostic factors in chronic NSLBP patients showed no association between age and sex at ≤6 months of follow-up and smoking at ≥12 months of follow-up. [Verkerk et al., 2012] Conflicting evidence was found at ≤6 months of follow-up for fear of movement on back pain intensity; at ≥12 months of follow-up, conflicting evidence was found for the factors age, sex, work status and physical job demands, and limited evidence for no association between the outcome back pain intensity and the factor social work [Verkerk et al., 2012]. The present results are not in accordance with this latter review, with the exception that fear of movement has no association with back pain intensity at 5- and 12-month follow-up. The reason for these differences could be due to the quality of the studies included in the systematic review, i.e., the risk of bias was high in most studies and their statistical performance poorly described [Verkerk et al., 2012].
Recovery is a complex construct and although there is no consensus on how it should be defined or measured, there is consensus on which outcomes are relevant in the process of recovery [Bombardier et al., 2001; Ostelo and de Vet, 2005; Ostelo et al., 2007; Kamper et al., 2010a,b,c]. A commonly used definition of a ‘clinically meaningful improvement’ on back pain intensity is 30% improvement on a VAS score compared with baseline (15–20 mm) [Bombardier, 2000; Ostelo and de Vet, 2005]. This definition gives clinicians and patients a useful threshold for identifying clinically meaningful improvement during a follow-up period or therapy process compared with natural fluctuations. However, apart from a 30% improvement, patients are also interested in prognostic factors to reach absolute recovery. The cut-off point on the VAS scale that classifies patients as ‘absolutely’ recovered is not yet known. The choice of outcome definition does make an important difference.
Patients with severe back pain (high VAS score) at baseline are probably more likely to achieve a 30% change over time than to drop from a high baseline VAS score to a score of ≤10 mm. A systematic review by Kamper et al. [2010a,b,c] described three studies that reported the complete absence of pain, whereas three other studies fixed a cut-off score on the instrument (e.g., VAS ≤ 10/100 mm; NRS ≤ 1/10). Chronic NSLBP did not have a higher cut-off score for pain and disability than acute NSLBP [Kamper et al., 2010a,b,c]. Our study shows that the AUC and explained variance were higher for ≤20 mm than for ≤10 mm VAS, and five of six factors were similar. However, selecting a higher cut-off will improve the sensitivity: i.e., a greater proportion of patients who consider themselves recovered will be correctly classified.
Missing data for baseline assessment items ranged from 0.5% to 28%. At the 5- and 12-month evaluations, 10.8% and 45.5% of the patients, respectively, did not respond (mainly due to not returning the follow-up questionnaires). We expect that our data are ‘missing at random’, which is not uncommon in prognostic studies with a relatively long follow-up period. We chose to impute missing data by using known variables of the patients [Vergouw et al., 2012]; the multiple imputation procedure is assumed to be more valid than deleting participations with missing data from the analyses. Not using the full study sample, but only patients with complete data, can reduce the model’s validity [Vergouwe et al., 2002; Altman et al., 2009; Vergouw et al., 2012]. Furthermore, performing sensitivity analyses to compare the data with more imputated datasets (n = 40 and n = 5), level of p-values of 0.05 and 0.157, and CCA [Harrell et al., 1996; Harrell, 2001] showed little or no difference in the identified prognostic factors; this reduces the risk of bias. Finally, the chance of overfitting our models by including too many variables was avoided by using a ‘rule of thumb’ to calculate the maximum number of variables. Finally, less variables were included in the models than was possible [Wood et al., 2008].
In the current study, the prognostic models have typically c-index between 0.6 and 0.85 [Royston et al., 2009] and confidence interval for the validation model. The low explained variance (R2) is higher in other studies [Verkerk et al., 2012], but still recommending that other prognostic factors (e.g., physical parameters) may be of influence for the course of recovery. In addition to this, the c-index may give a general estimation of the discriminative ability of a prediction model, but is not directly meaningful for clinical purpose. In LBP, it is not uncommon for prognostic factors to show significant association with the outcome at group level, but it has to proof itself at individual level by external validation.
The generalizability of the results is somewhat limited because the patients were recruited from a rehabilitation centre for tertiary care and all had received multidisciplinary treatment. A strength of the current study is that data were collected prospectively from a cohort of patients in one daily clinical care centre where all the patients received the same intervention, so this may reduce the risk of confounding by indication. Comparing these results with other settings may vary because of the difference in spectrum of disease between the settings (e.g., rehabilitation clinics vs. primary care or other settings).
Further research is required to focus on the opportunity to identify patients at high risk of poor (or good) outcome entering a rehabilitation setting. Therefore, more research is needed to clarify the course of patients with chronic NSLBP and to establish whether our results are valid also in primary and secondary care. A study in which patients complete a global perceived effect which is then compared with back pain intensity (VAS) to determine when a patient experiences ‘complete’ recovery may provide more insight into the definition of ‘absolute recovery’. The next step is external validation of the prognostic models to enable clinicians to eventually apply these models in daily practice [Altman et al., 2009].
Author contributions
All authors contributed to the conception and design. K.V.,P.A.J.L., I.R. and M.W.H. participated in data acquisition, analysis and interpretation. K.V. drafted the article, and all authors revised it critically and gave the final approval of the version to be published.
References:
Altman, D.G., Vergouwe, Y., Royston, P., Moons, K.G. (2009).
Prognosis and prognostic research: Validating a prognostic model.
BMJ 338, b605. 1432–1435.Axen I, Leboeuf-Yde C.
Trajectories of Low Back Pain
Best Pract Res Clin Rheumatol. 2013 (Oct); 27 (5): 601–612Bombardier, C. (2000).
Outcome assessments in the evaluation of treatment of spinal disorders: Summary and general recommendations.
Spine (Phila Pa 1976) 25, 3100–3103.Bombardier, C., Hayden, J., Beaton, D.E. (2001).
Minimal clinically important difference. Low back pain: Outcome measures.
J Rheumatol 28, 431–438.Costa, L.C.M., Maher, C.G., Hancock, M.J., McAuley, J.H., Herbert, R.D, (2012).
The prognosis of acute and persistent low-back pain: A meta-analysis.
CMAJ 184, E613–E624.de Vet, H.C., Heymans, M.W., Dunn, K.M., Pope, D.P., van der Beek, A.J. (2002).
Episodes of low back pain: A proposal for uniform definitions to be used in research.
Spine (Phila Pa 1976) 27, 2409–2416.Donders, A.R., van der Heijden, G.J., Stijnen, T., Moons, K.G. (2006).
Review: A gentle introduction to imputation of missing values.
J Clin Epidemiol 59, 1087–1091.Dunn, K.M., Campbell, P., and Jordan, K.P.
Long-term Trajectories of Back Pain: Cohort Study With 7-year Follow-up
BMJ Open. 2013 (Dec 11); 3 (12): e003838Dunn, K.M., Croft, P.R. (2004).
Epidemiology and natural history of low back pain.
Eura Medicophys 40, 9–13.Enthoven, P., Skargren, E., Oberg, B. (2004).
Clinical course in patients seeking primary care for back or neck pain:
A prospective 5-year follow-up of outcome and health care consumption with subgroup analysis.
Spine (Phila Pa 1976) 29, 2458–2465.Guzmán, J., Esmail, R., Karjalainen, K., Malmivaara, A., Irvin, E. (2002).
Multidisciplinary bio-psycho-social rehabilitation for chronic low back pain.
Cochrane Database Syst Rev (1), CD000963.Harrell, F.E. Jr. (2001).
Regression Modelling Strategies
(New York: Springer).Harrell, F.E. Jr., Lee, K.L., Mark, D.B. (1996).
Multivariable prognostic models: Issues in developing models, evaluating assumptions and adequacy,
and measuring and reducing errors.
Stat Med 15, 361–387.Helmhout, P.H., Staal, J.B., Heymans, M.W., Harts, C.C., Hendriks, E.J. (2010).
Prognostic factors for perceived recovery or functional improvement in non-specific low back pain:
Secondary analyses of three randomized clinical trials.
Eur Spine J 19, 650–659.Henschke, N., Ostelo, R.W., van Tulder, M.W., Vlaeyen, J.W., Morley, S. (2010).
Behavioural treatment for chronic low-back pain.
Cochrane Database Syst Rev (7), CD002014.Heymans, M.W., van Buuren, S., Knol, D.L., van Mechelen, W. (2007).
Variable selection under multiple imputation using the bootstrap in a prognostic study.
BMC Med Res Methodol 7, 33.Kamper, S.J., Maher, C.G., Herbert, R.D., Hancock, M.J., Hush, J.M. (2010a).
How little pain and disability do patients with low back pain have to experience to feel that they have recovered?
Eur Spine J 19, 1495–1501.Kamper, S.J., Ostelo, R.W., Knol, D.L., Maher, C.G., de Vet, H.C. (2010b).
Global Perceived Effect scales provided reliable assessments of health transition in people with
musculoskeletal disorders, but ratings are strongly influenced by current status.
J Clin Epidemiol 63, 760–766 e1.Kamper, S.J., Stanton, T.R., Williams, C.M., Maher, C.G., Hush, J.M. (2010c).
How is recovery from low back pain measured? A systematic review of the literature.
Eur Spine J 20, 9–18.Koes, B.W., Sanders, R.J., Tuut, M.K. (2004).
[The Dutch Institute for Health Care Improvement (CBO) guideline for the diagnosis and treatment of
a specific acute and chronic low back complaints].
Ned Tijdschr Geneeskd 148, 310–314.Menezes Costa, L.D.C., Maher, C.G., Hancock, M.J., McAuley, J.H. (2012).
The prognosis of acute and persistent low-back pain: A meta-analysis.
CMAJ 184, E613–E624.Moons, K.G., Altman, D.G., Vergouwe, Y., Royston, P. (2009a).
Prognosis and prognostic research: Application and impact of prognostic models in clinical practice.
BMJ 338, b606. 1487–1490.Moons, K.G., Royston, P., Vergouwe, Y., Grobbee, D.E., Altman, D.G. (2009b).
Prognosis and prognostic research: What, why, and how?
BMJ 338, b375. 1317–1320.Ostelo, R.W., Deyo, R.A., Stratford, P., Waddell, G., Croft, P., Von Korff, M. (2008).
Interpreting change scores for pain and functional status in low back pain:
Towards international consensus regarding minimal important change.
Spine (Phila Pa 1976) 33, 90–94.Ostelo, R.W. I., Swinkels-Meewisse, J., Knol, D.L., Vlaeyen, J.W. (2007).
Assessing pain and pain-related fear in acute low back pain: What is the smallest detectable change?
Int J Behav Med 14, 242–248.Ostelo, R.W.G., de Vet, H.C.W. (2005).
Clinically important outcomes in low back pain.
Best Pract Res Clin Rheumatol 19, 593–607.Peduzzi, P., Concato, J., Kemper, E., Holford, T.R., Feinstein, A.R. (1996).
A simulation study of the number of events per variable in logistic regression analysis.
J Clin Epidemiol 49, 1373–1379.RIVM, C.V.P.Z. (2007).
Chronisch zieken; aspecifieke lage rugpijn: Oorzaak en gevolgen.
www.rivm.nl.Royston, P., Moons, K.G., Altman, D.G., Vergouwe, Y. (2009).
Prognosis and prognostic research: Developing a prognostic model.
BMJ 338, b604. 1373–1377.Snyder-Halpern, R. (2001).
Indicators of organizational readiness for clinical information technology/systems innovation: A Delphi study.
Int J Med Inform 63, 179–204.Steyerberg, E.W., Borsboom, G.J., van Houwelingen, H.C. (2004).
Validation and updating of predictive logistic regression models: A study on sample size and shrinkage.
Stat Med 23, 2567–2586.Steyerberg, E.W., Moons, K.G., van der Windt, D.A., Hayden, J.A. (2013).
Prognosis Research Strategy (PROGRESS) 3: Prognostic model research.
PLoS Med 10, e1001381.Tamcan, O., Mannion, A.F., Eisenring, C., Horisberger, B. (2010).
The course of chronic and recurrent low back pain in the general population.
Pain 150, 451–457.van Wingerden, J.P. (2009).
Functional anatomy in low back rehabilitation; balance in the biopsychosocial model.
Thesis.Vergouw, D., Heymans, M.W., van der Windt, D.A., Foster, N.E. (2012).
Missing data and imputation: A practical illustration in a prognostic study on low back pain.
J Manipulative Physiol Ther 35, 464–471.Vergouwe, Y., Steyerberg, E.W., Eijkemans, M.J., Habbema, J.D. (2002).
Validity of prognostic models: When is a model clinically useful?
Semin Urol Oncol 20, 96–107.Verhagen, A.P., de Vet, H.C., de Bie, R.A., Kessels, A.G., Boers, M. (1998).
The Delphi list: A criteria list for quality assessment of randomized clinical trials
for conducting systematic reviews developed by Delphi consensus.
J Clin Epidemiol 51, 1235–1241.Verkerk, K., Luijsterburg, P.A., Miedema, H.S., Pool-Goudzwaard, A., Koes, B.W. (2012).
Prognostic factors for recovery in chronic nonspecific low back pain: A systematic review.
Phys Ther 92, 1093–1108.Verkerk, K., Luijsterburg, P.A., Ronchetti, I., Miedema, H.S. (2011).
Course and prognosis of recovery for chronic non-specific low back pain:
Design, therapy program and baseline data of a prospective cohort study.
BMC Musculoskelet Disord 12, 252.Vos, T., Flaxman, A.D., Naghavi, M., Lozano, R., Michaud, st al. (2012).
Years Lived with Disability (YLDs) for 1160 Sequelae of 289 Diseases and Injuries
1990-2010: A Systematic Analysis for the Global Burden of Disease Study 2010
Lancet. 2012 (Dec 15); 380 (9859): 2163–2196Wood, A.M., White, I.R., Royston, P. (2008).
How should variable selection be performed with multiply imputed data?
Stat Med 27, 3227–3246.
Return to LOW BACK PAIN
Since 5-22-2020

| Home Page | Visit Our Sponsors | Become a Sponsor |
Please read our DISCLAIMER |