| PMC full text: | Published online 2013 May 20. doi: 10.1073/pnas.1301816110 |
Fig. 4.
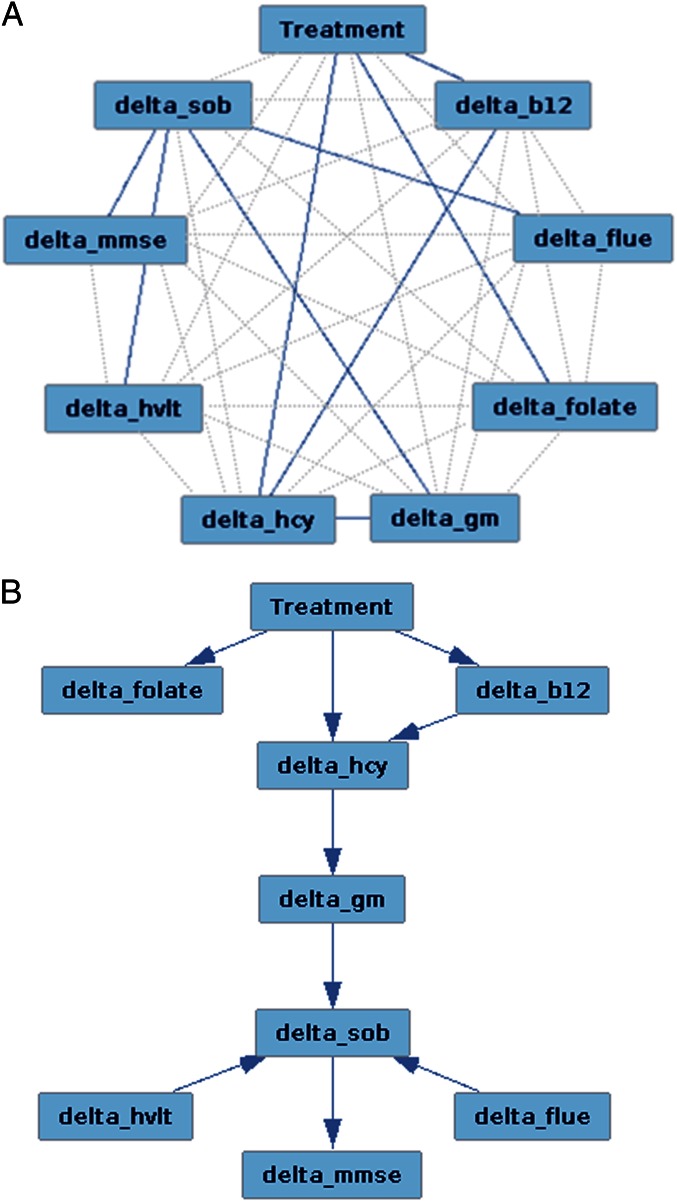
Directed acyclic graph analysis of treatment and changes (“delta”) in B vitamins, tHcy, GM volume, and cognitive performance over the 2-y period. Of all possible edges (gray, A), we found that the optimal Bayesian network explaining our data (with a very good model fit, χ2 P = 0.64; SI Methods) identified nine statistical dependencies between variables (A, blue) and causality for each of these edges as presented in B (rearranged for clarity of display): treatment increases B vitamins' “delta” concentration, with B12 lowering tHcy “delta” concentration, which in turn slows grey matter atrophy (“gm”), which then delays cognitive decline over time (“sob” for CDR-SOB, “hvlt” for HVLT-R delayed recall, “flue\x{201d} for category fluency).