Figure 5
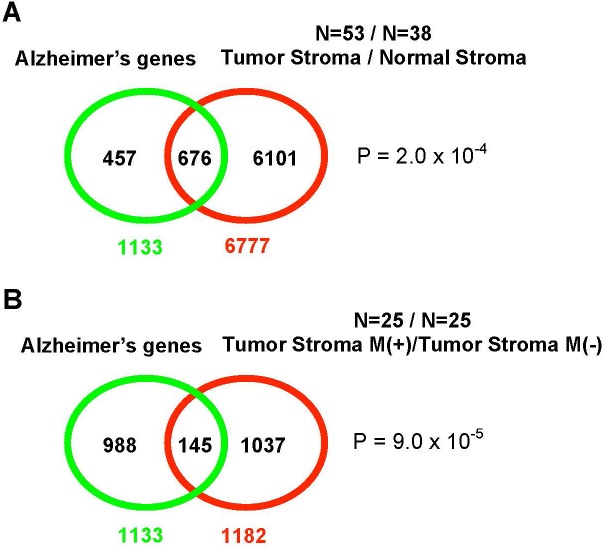
The overlap between the transcriptional profile of AD brains and gene expression in tumor stroma
A. A Venn diagram shows the overlap of the AD brain transcriptional profile (53 patients) with the gene expression profile of tumor stroma obtained from breast cancer patients (38 patients);
B. When the analysis is limited to the tumor stroma from metastatic cancer only (25 patients), the AD and tumor stroma transcriptional profiles show a slightly higher statistical significance in their overlap.
“M” stands for metastasis.
Reproduced and adapted from Pavlides S. et al. [52].