Figure 3
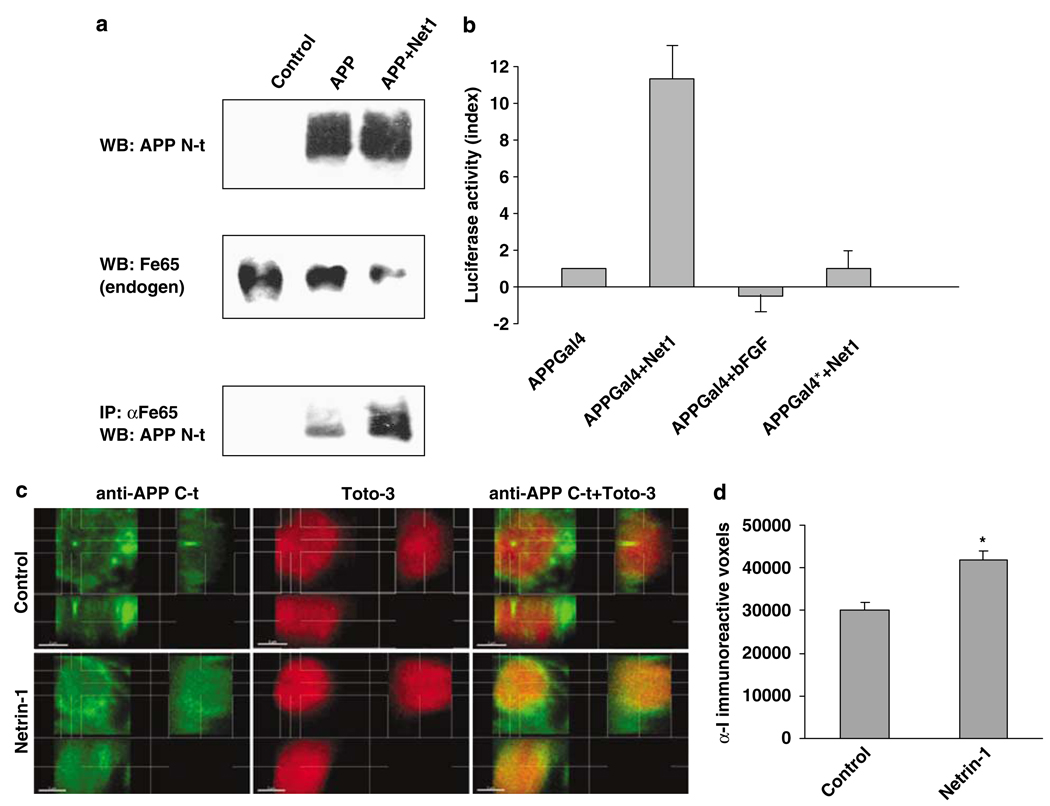
Netrin-1 activates APP signaling. (a) B103 cells were transiently transfected with APP and further incubated with (or without) netrin-1. Endogenous Fe65 was immunoprecipitated using anti-Fe65 antibody, and N-terminal anti-APP antibody was used to detect APP within the pull-down. The upper panels represent APP and Fe65 before the pull-down, the lower panel being APP detected in the immunoprecipitation. (b) HEK293T cells were cotransfected with APP-Gal4 or APP*-Gal4 together with a Gal4-luciferase reporters (pG5E1B-luc) construct in a 1:1 ratio. In all, 300 ng/ml of netrin-1 (or of bFGF) was added to the culture after 24 and 48 h after transfection; cells were collected and cell lysates were assessed for luciferase activity using the Promega luminescence measurement assay and a Victor biostation (Perkin-Almer). A histogram plot is presented. Standard deviations are indicated (n=5). (c and d) Primary neuronal cultures from E16.5 hAPP transgenic embryos (PDAPP(J20) in C57BL/6J background) were treated with vehicle (PBS) or with 300 ng/ml netrin-1 added to the culture media every 24 h for 3 days, starting 1.5 day after plating. Cultures were fixed, treated with RNAse, and stained with a 1:1000 dilution of an antibody specific for the C-terminal domain of APP (amino acids 649–664, antiserum I (R1155)37) followed by Alexa488-conjugated donkey antirabbit IgG (Invitrogen) and counterstained with TOTO-3 to visualize DNA. Stacks of images (z-step=250 nm) were acquired with a laser scanning confocal microscope (Nikon PCM-2000) at × 600 magnification and collected with SimplePCI (Compix Inc., Sewickley, PA, USA) software. For each condition, five separate fields were chosen in which individual cells were clearly distinguishable (avoiding clumps of neuronal bodies). A representative maximum intensity projection image of fields acquired for each condition is shown in Supplementary Figure 3b. Distribution of intensity of anti-I immunoreactivity across nuclei is shown in Supplementary Figure 3c. (c and d) Individual volumes (9 × 9 × 6 µ m) of single nuclei (control, n=53; netrin-1, n=51) were cropped from stacks of confocal images and analyzed separately using the Imaris Isosurface algorithm (Imaris Bitplane, Zurich, Switzerland). (c) Maximum intensity projections of stacks of control and netrin-1-treated neuronal nuclei. Representative images are shown. (d) Numbers of anti-I immunoreactive voxels in neuronal nuclei. A significant increase of APP C-terminal immunoreactive voxels was observed in nuclei of neurons and had been treated with netrin-1 (P<0.05, unpaired Student’s t-test)