| PMC full text: |
|
Figure 1.
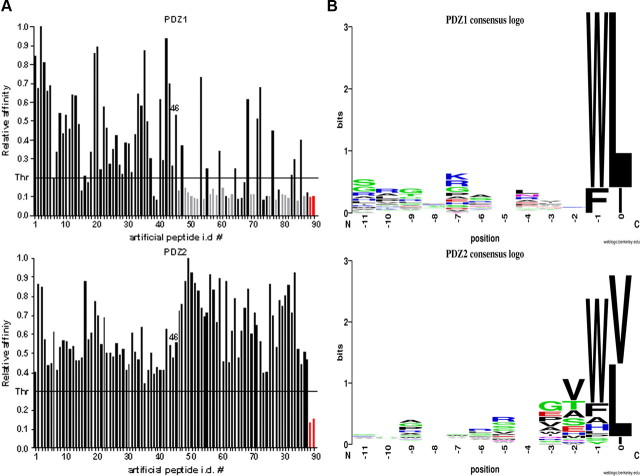
A, Histograms showing the binding profile of 88 artificial ligands to PDZ domains of Mint1. Axis X indicates identification (i.d.) numbers of individual artificial ligands (see A). Axis Y indicates the normalized relative affinity. For normalization, the values of slopes of individual ELISA kinetics were divided by the highest slope value in each of the two sets shown. The number 46 indicates the last peptide in the set of peptides isolated for PDZ-1. The gray bars indicate peptides containing Val at position “0.” The red bars indicate negative controls (phage library aliquots). A horizontal threshold line was drawn at the value equal to double the value of the highest negative control.
B, A graphical representation of an amino acid multiple sequence alignment (consensus logo) for either PDZ domain. The logos were generated using the WebLogo application at http://weblogo.berkeley.edu.