Figure 2
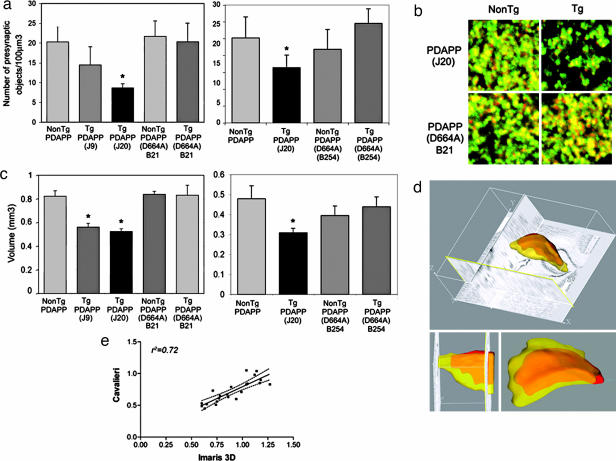
Effect of D664A mutation on synaptic loss and dentate atrophy. (a) Quantitation of presynaptic densities. (a Left) Quantitation of presynaptic densities in brains of 8- to 10-mo mice as described in Methods (n = 48). (a Right) Quantitation of presynaptic densities in sections from brains of 5-mo mice (n = 16). {Note that, because of dynamic range and total fluorescence variability from experiment to experiment, PDAPP(J20) results from early experiments [vs. PDAPP(D664A)(B21)] and later studies [vs. PDAPP(D664A)(B254)] were not pooled.} (b) CA1 stratum radiatum in hippocampal sections stained with α-synaptophysin antibodies. (c) Volume determinations. (c Left) DG volumes were determined by using imaris 3D and confirmed by Cavalieri analysis as described in Methods (n = 38). Cavalieri results are shown. (c Right) imaris 3D comparisons of J20 and B254. (d) Orthogonal, saggital, and coronal views of 3D surface reconstructions of DG molecular layers of representative PDAPP(J20) (red) and PDAPP(D664A)(B21) (yellow) mice. (e) Volumes derived by Cavalieri analysis and imaris 3D reconstructions were highly correlated (r2 = 0.72; P < 0.00001; n = 28). No significant difference was found in body or brain weight between strains or genotypes. Samples were coded to blind investigators with respect to strain and genotype. Data are expressed as mean ± SEM. ∗∗, significance (P < 0.05) was determined by ANOVA followed by the Kruskal–Wallis test. The Pearson correlation coefficient test, followed by the runs test, was used for regression analyses.