Nature Microbiology 2025 (Jul); 10 (7): 1630–1647
Extended Data Fig. 8. Proteomics results show effects of PFNA on abundance of proteins.
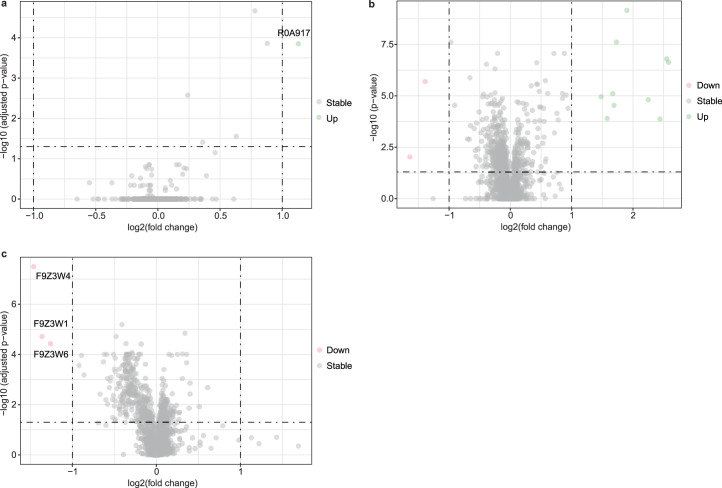
A-C. Results showing the proteins that are differentially abundant between (a) E. coli BW25113, (b) E. coli BW25113 ΔTolC, and (c) O. splanchnicus treated with 20 µM PFNA in comparison to DMSO. The green and the blue dots mark proteins with a log2 abundance ratio >1 or <−1 (that is, two-fold increase or decrease) and a multiple-testing corrected p-value of less than 0.05. n = 6 biological replicates (Supplementary Table 24).