Nature Microbiology 2025 (Jul); 10 (7): 1630¢1647
Extended Data Fig. 9. Effects of PFNA on abundance of metabolites in pellet and supernatant samples.
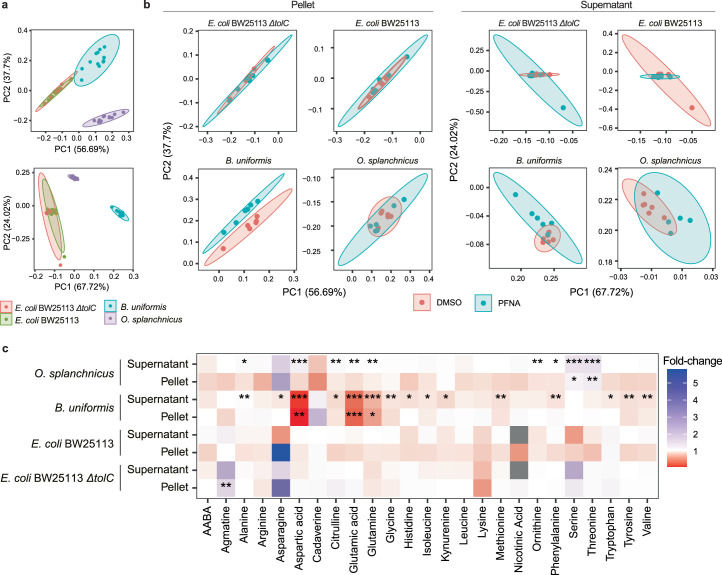
A. PCA analysis shows clear distinction between bacterial strains, with E. coli wild-type and TolC mutant overlapping. n = 6 biological replicates (Supplementary Table 26).
B. PCA analysis of pellet and supernatant samples shows clear distinction of PFNA and DMSO treated cells only for B. uniformis pellet samples (B. uniformis pellet PCA is a replicate of Fig.4d, added for completion). n = 6 biological replicates (Supplementary Table 26).
C. Metabolomics analysis show change in intra- and extracellular metabolites. Fold change of analysed metabolites in supernatant and pellet samples of 20 ┬ĄM PFNA exposed cells compared to control (DMSO) samples. Significance: * p<0.05, p<0.01, * p<0.001. P-values calculated using two-sided t-test and Benjamini-Hochberg correction for multiple testing. n = 6 biological replicates (Data and p-values provided in Supplementary Table 41).