PMC full text:
Published online 2006 Apr 6. doi: 10.1186/1746-1340-14-6
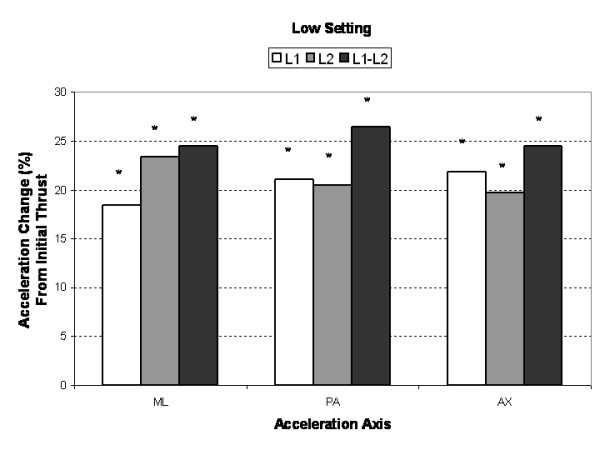
Figure 3

Mean percent change (maximum multi-impulse value compared to first impulse) in low force, segmental (L1, L2) and intersegmental (L1–L2) acceleration responses for the medial-lateral (ML), posterior-anterior (PA), and axial (AX) axes. Asterisks (*) indicate significant change from first impulse.
