| PMC full text: | Spine (Phila Pa 1976). Author manuscript; available in PMC 2016 Jun 15. Published in final edited form as: Spine (Phila Pa 1976). 2015 Jun 15; 40(12): E694–E700. doi: 10.1097/BRS.0000000000000891 |
Figure 2
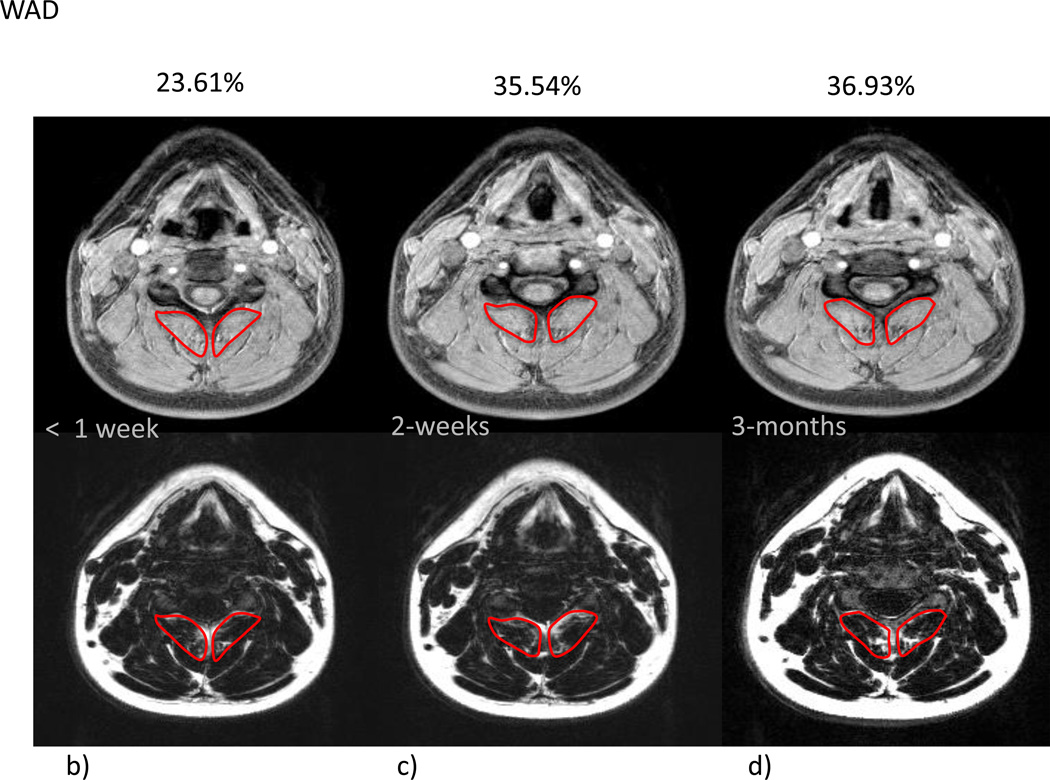
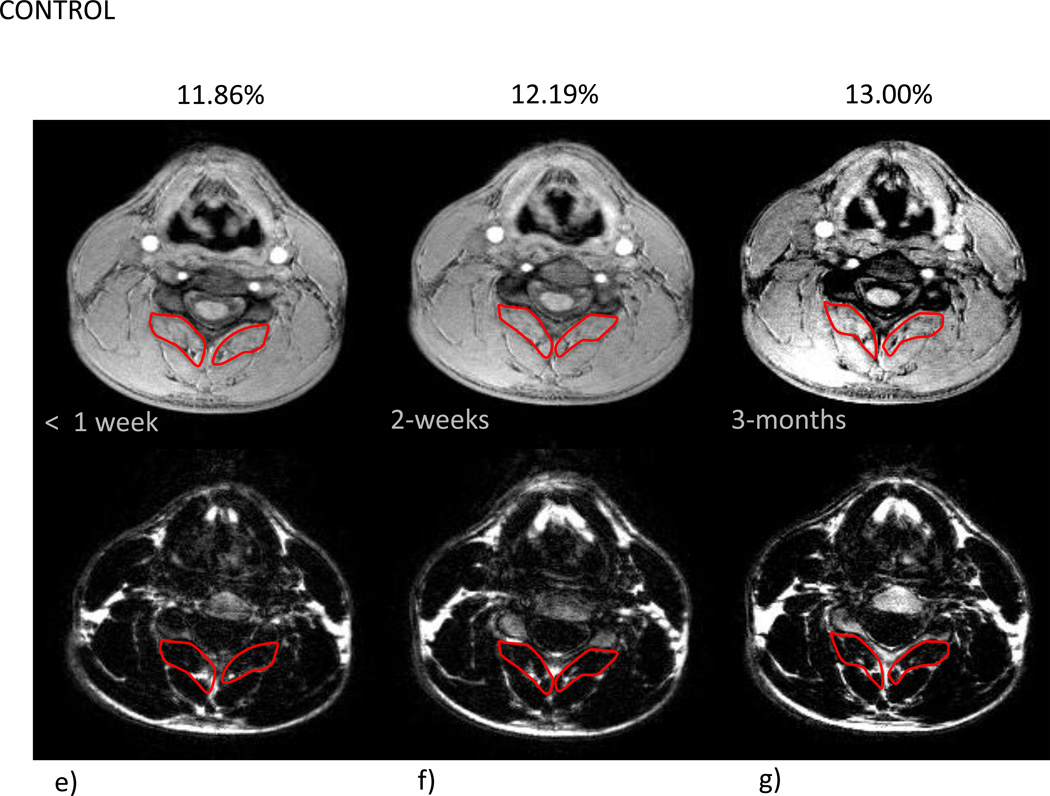
a–g- a) T2-weighted sagittal scan depicting location of corresponding axial slices for water-only (top row) and fat-only (bottom row) images (b–g) for a WAD (b–d) and a control subject (e–g) at the C5 vertebral level over the course of 3 time points (< 1 week, 2-weeks, and 3-months post MVC)

