| PMC full text: | Published online 2015 Aug 19. doi: 10.1186/s12891-015-0632-0
|
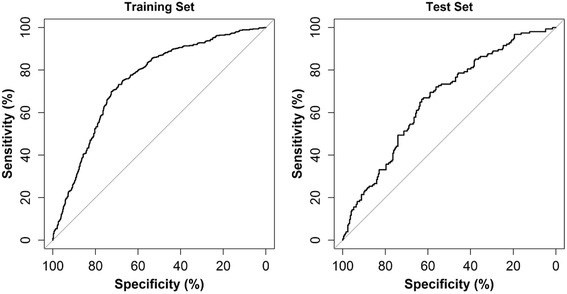
Fig. 3

Post-treatment model ROC curves. Receiver operating characteristic (ROC) curves for the final multivariate model for prediction of responders. The area under the curve (AUC) was 0.750 in the training set and 0.665 in the test set. Chance is shown by the diagonal line indicating AUC = 0.5