| PMC full text: | Published online 2016 Dec 1. doi: 10.1038/srep38107
|
Figure 8
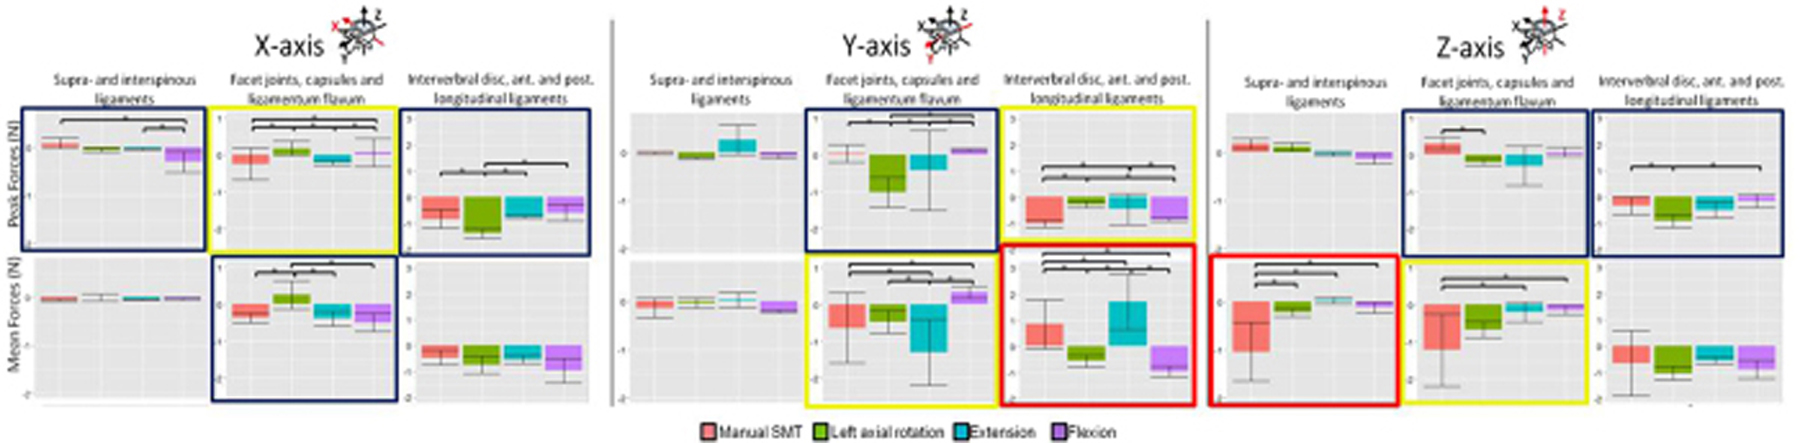
Average peak force and mean force experienced by specific spinal structures during the application of SMT and passive lumbar movements of flexion, extension and left axial rotation.
Each section corresponds to a particular axis of movement (x-, y-, and z-axis). Each row within an individual section displays outcome variables (peak and mean forces) experienced by supra- and interspinous ligaments, bilateral facet joints, capsules and ligamentum flavum and intervertebral disc, anterior and posterior longitudinal ligaments (indicated on top of each column). Red boxes indicate significant differences between SMT and all three passive motions. Yellow boxes indicate significant differences between SMT and 2 passive motions. Navy boxes indicate significant differences between SMT and 1 passive motion (*p < 0.05).