| PMC full text: | Published online 2014 Jan 13. doi: 10.1186/1472-6882-14-16
|
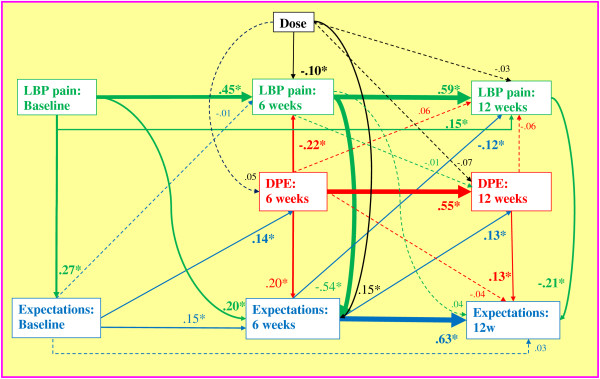
Figure 2

Path analysis diagram. Standardized path coefficients are presented. The absolute magnitude indicates the strength of the relationship between variables and the arrow points to the presumed direction of influence. Solid arrows indicate statistical significance (p < .05) and the width of solid arrows indicates the magnitude of the coefficient. Color of the arrow indicates variable of origin; green = pain, red = DPE, blue = expectations, black = treatment dose.