| PMC full text: | Published online 2016 May 21. doi: 10.1186/s12891-016-1071-2
|
Fig. 1

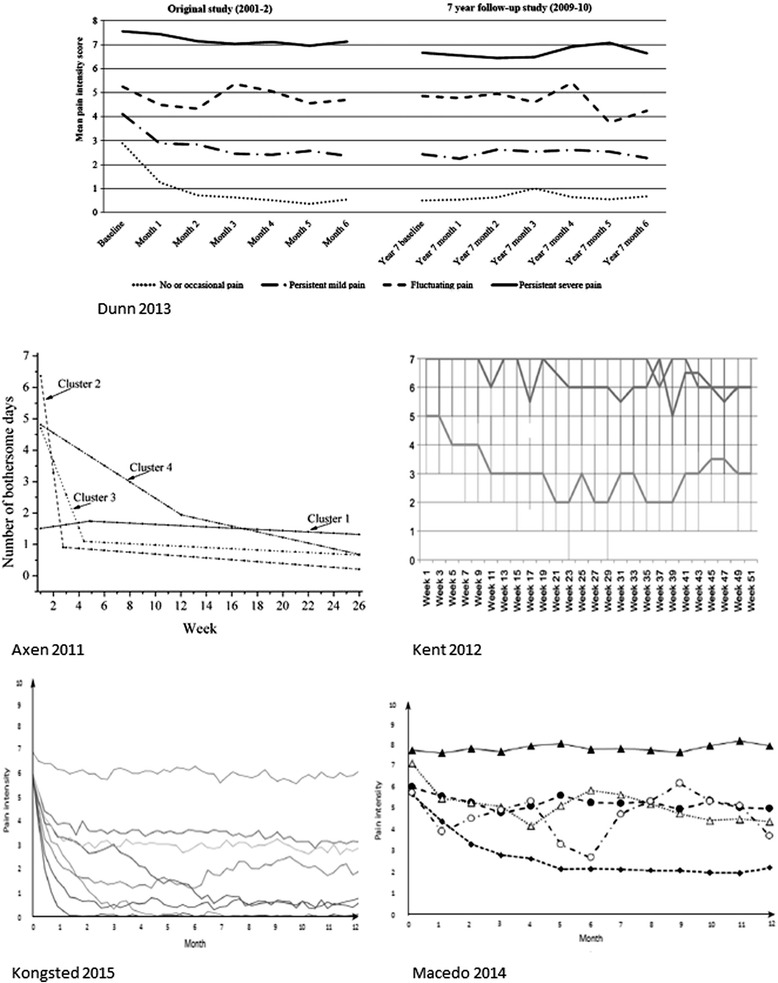
Illustrations of trajectories identified in five previously published studies. Each trajectory is represented by mean values of the subgroup. Dunn 2013 is from [10], Axen 2011 is from [12], Kent 2012 is from [15] and Kongsted 2015 is from [11]. These papers were published as open access and therefore the authors hold the copyrights of the reprinted illustrations. Macedo [16]: The illustration was not published in the original paper and was provided by the author