Science Translational Medicine 2022 (May 11); 14 (644): eabj9954
Figure 1. Differential expression of genes in study design contrasts.
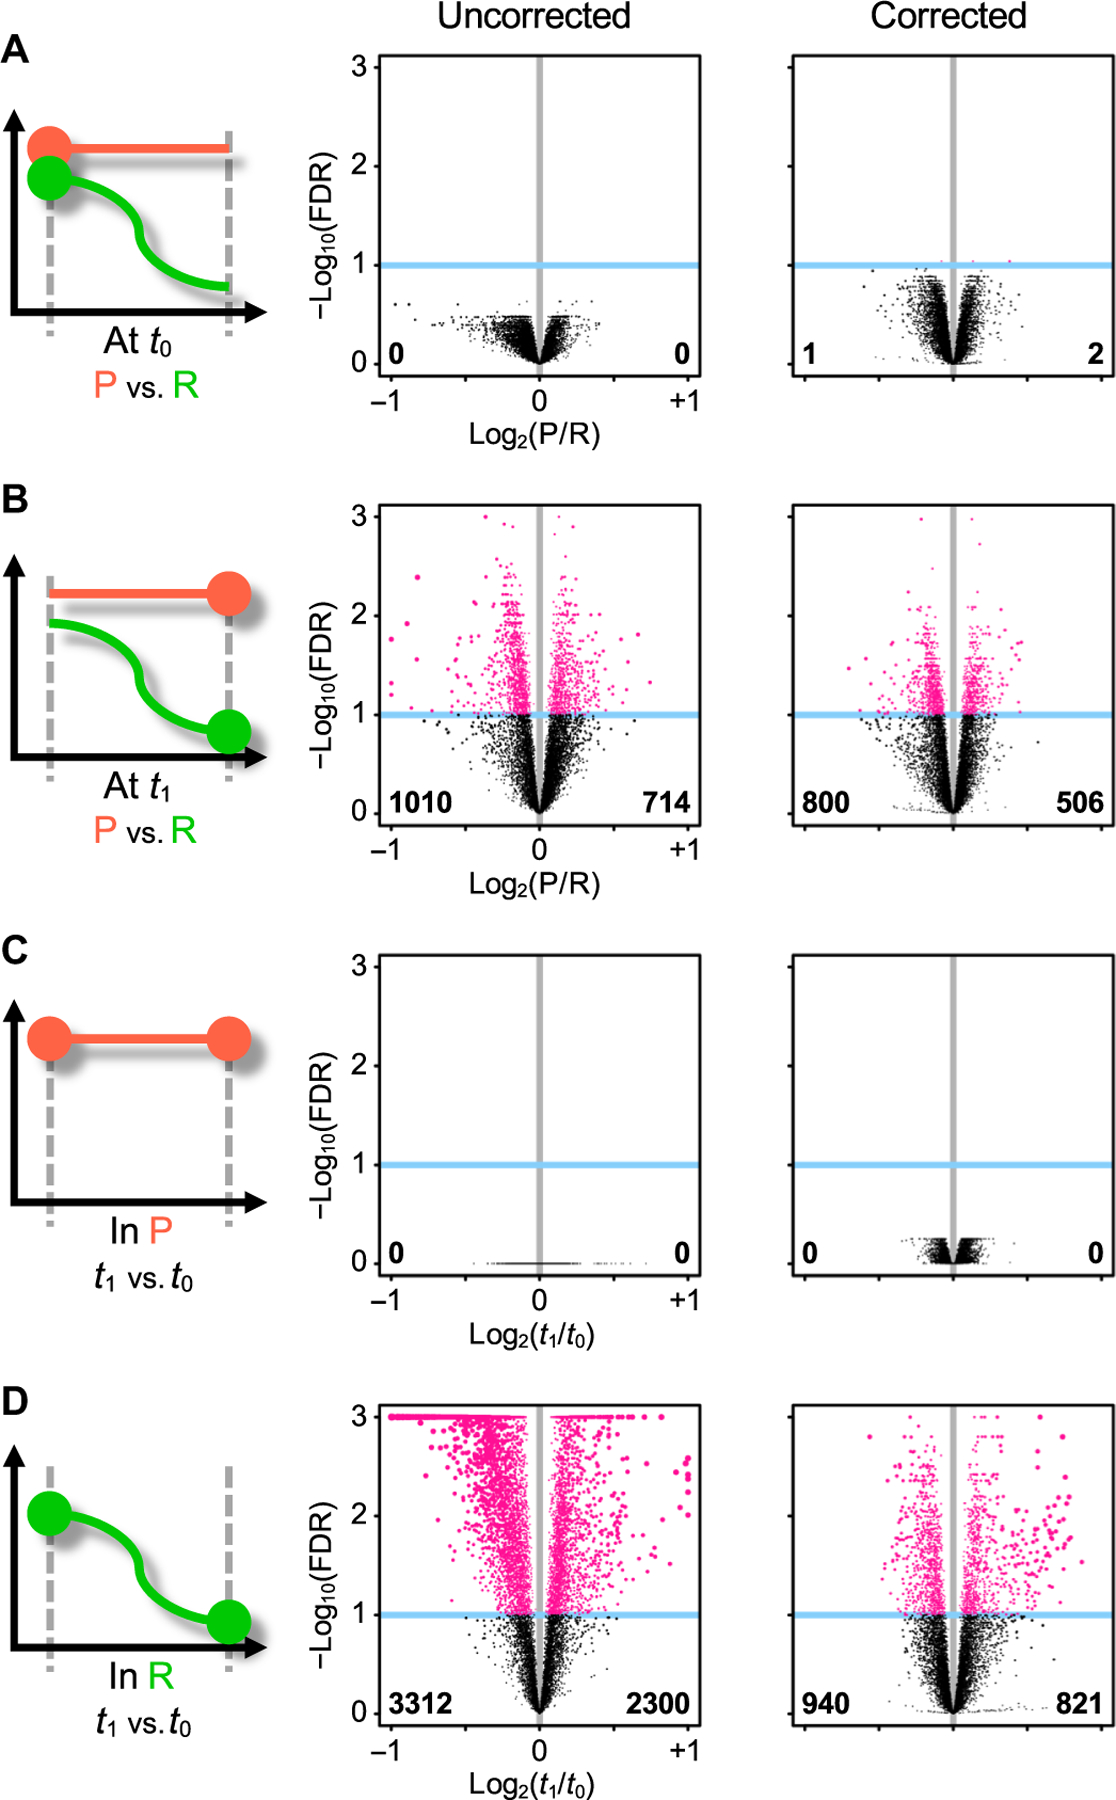
Study design pictograms (left) are juxtaposed to volcano plots (middle and right). The pictogram highlights the two contrasted conditions (large dots). The volcano plot shows statistical significance (y axis) as a function of fold change (x axis); each dot is a gene.
Genes that would end up outside of the plot are squeezed inside. Vertical gray line indicates null fold change. Genes reaching statistical significance at the FDR 10% level (blue horizontal line) are highlighted in pink.
Numbers in bold indicate counts of significantly differentially expressed genes that are down-regulated (lower left corner) or up-regulated (lower right corner).
Volcano plots are shown uncorrected (middle column) and corrected (right column) for blood cell-type fractions.
(A and B) Contrast between patients with persistent (P; orange) and resolved (R; green) pain outcomes
(A) at t0 or (B) at t1.
(C and D) Contrast between t1 and t0 in P patients (C) or in R patients (D).