Science Translational Medicine 2022 (May 11); 14 (644): eabj9954
Figure 2. Blood cell-type fraction trajectories in time, in subjects with persistent or resolved pain.
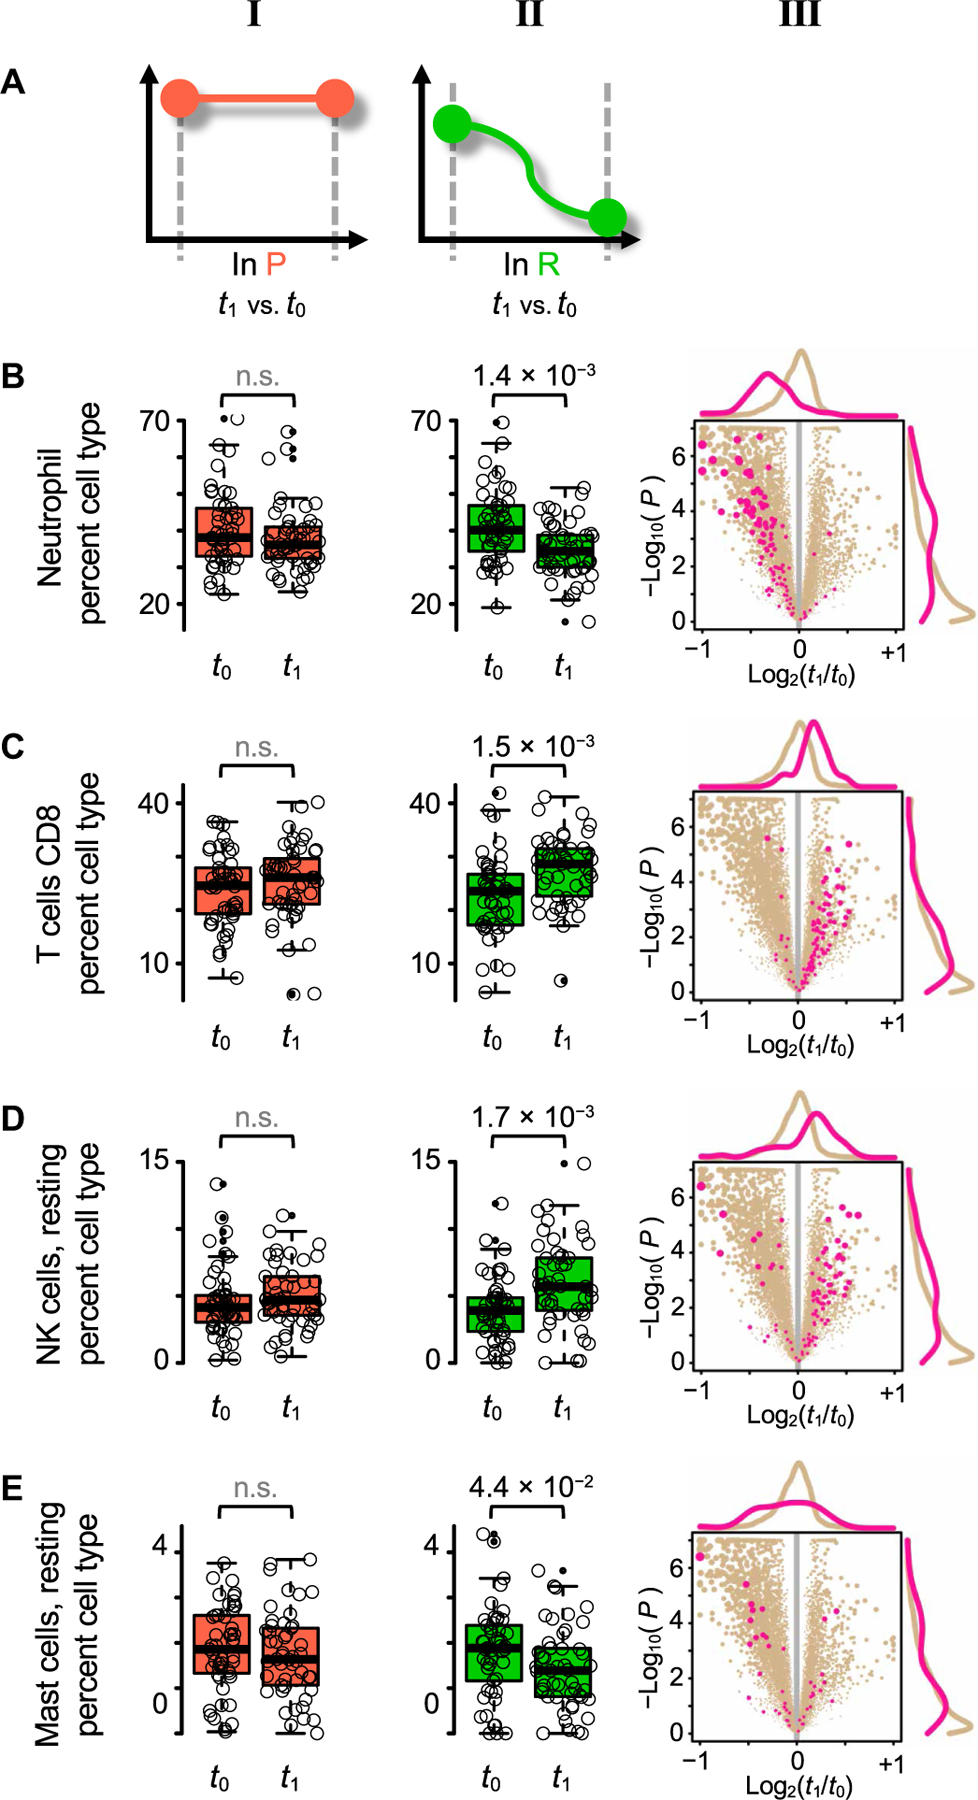
(A) Study design pictograms, showing contrasts in time in those with persistent pain (P; orange, column I), and in those with resolved pain (R; green, column II).
(B to E) Box-and-whisker plots (columns I and II) showing the distributions of percent cell-type fraction at t0 and at t1. Cell-type fraction estimates inferred by CIBERSORT from transcriptomics data. P value obtained from logistic regression between the two time points shown on top; not significant (n.s.) when P > 0.05. Volcano plots (column III) for R patients, showing genes highly expressed in the corresponding row’s cell type (pink) versus all other genes (tan).
(B) Neutrophils.
(C) CD8+ T cells.
(D) Natural killer (NK) cells, resting.
(E) Mast cells, resting.