Science Translational Medicine 2022 (May 11); 14 (644): eabj9954
Figure 3. Functional differences between the resolved and persistent pain groups.
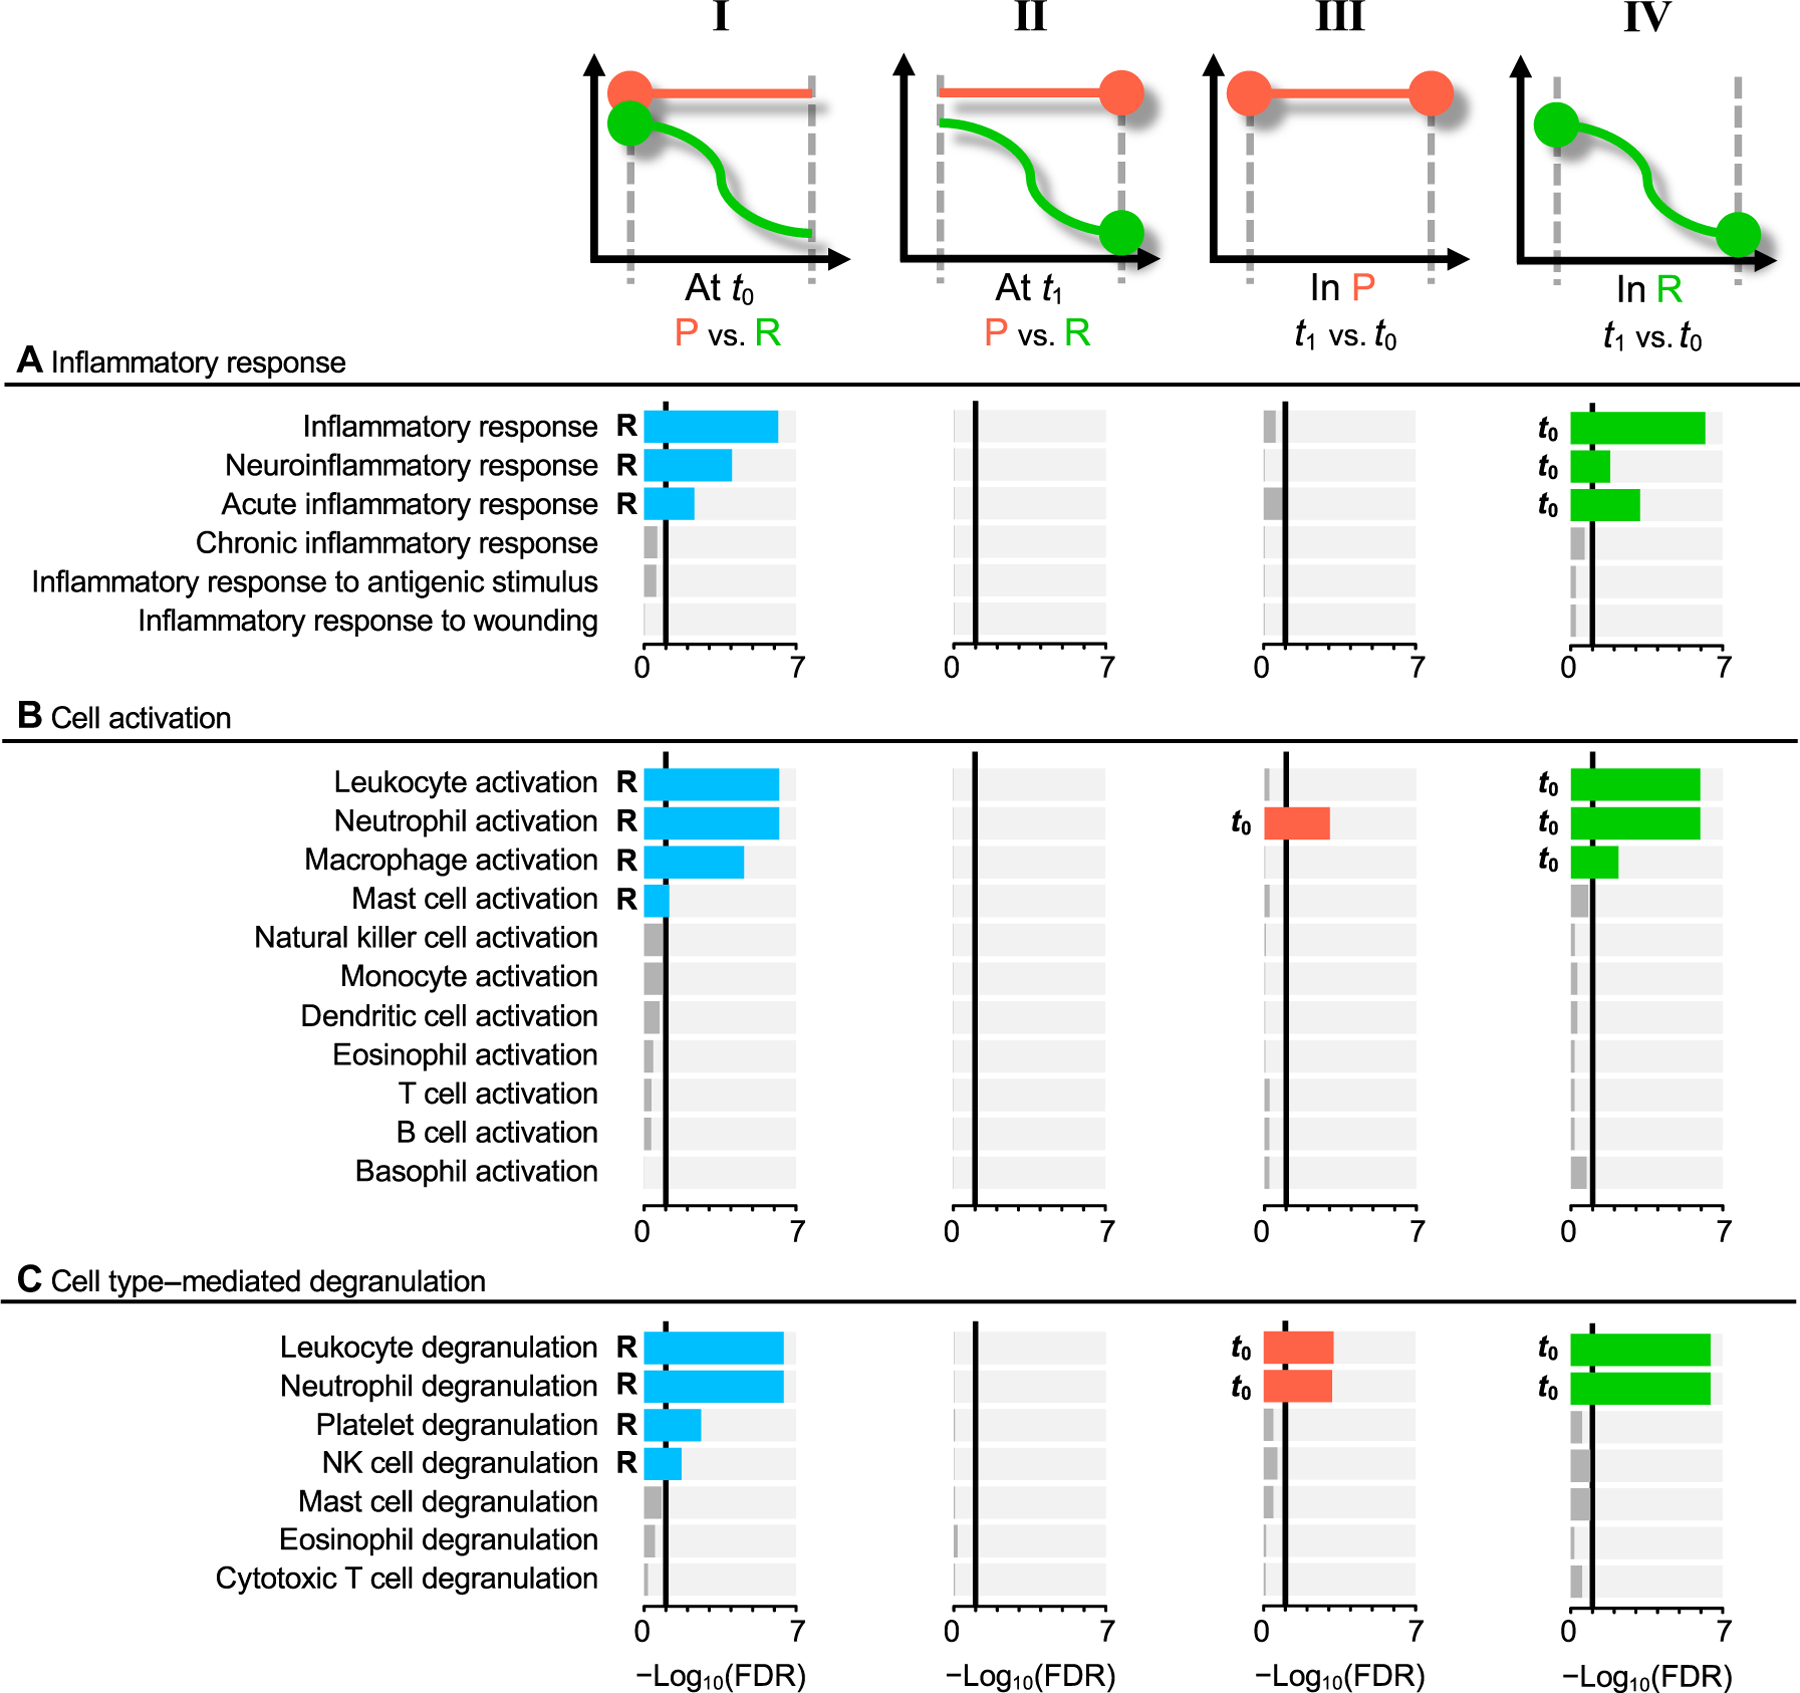
Functional differences assessed with selected pathways in Gene Ontology’s (GO) biological processes. Statistically significant pathways at the FDR 10% level are highlighted in nongray colors;
blue at t0 (column I),
orange for group P (column III),
and green for group R (column IV).
Assessment performed between the groups with resolved (R) and persistent (P) pain, at the first visit (column I), and at the second visit (column II). Functional trajectories between t0 and t1 are also shown for the P group (column III) and for the R group (column IV).
(A) Pathways under inflammatory response (GO:0006954).
(B) Pathways under leukocyte activation (GO:0045321). (C) Pathways under leukocyte degranulation (GO:0043299).