Fig 10
Radiographic position for unlinked rats.
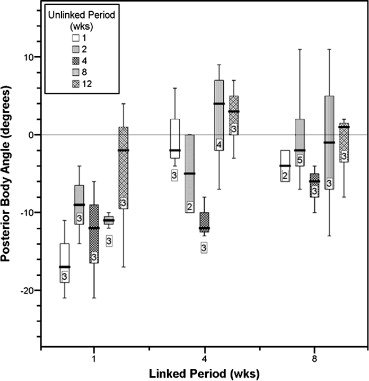
These boxplots report how readily the previously fixed L4-L6 motion segments were forced into extension when each unlinked euthanized rat was placed in the extension positioning jig. Previous to testing, these animals had been linked in a flexed or neutral configuration for either 1, 4, or 8 weeks (across clusters), which was followed by a 1-, 2-, 4-, 8-, or 12-week unlinked period (within clusters). Negative PBAs are located below the zero reference line. These indicate that the extension jig had successfully forced the L4 and L6 vertebrae into extension positions. Positive PBA values indicate that the vertebrae had retained their flexed positions despite the influence of the extension jig. Rats with flexed and neutral link configurations were pooled in this plot. Resisted extension as a function of weeks-linked can be seen across clusters. Resisted extension as a function of weeks-unlinked is suggested within the 1-week linked cluster, but not clearly in the 4- and 8-week linked clusters. The boxes report interquartile ranges with median values marked by horizontal bars. The whiskers represent the smallest and largest data values within 1.5 box lengths from the respective upper and lower borders of a box.