| PMC full text: | Published online 2016 Feb 18. doi: 10.1186/s12998-016-0085-z
| << PrevFig. 1Next >> |
Fig. 1
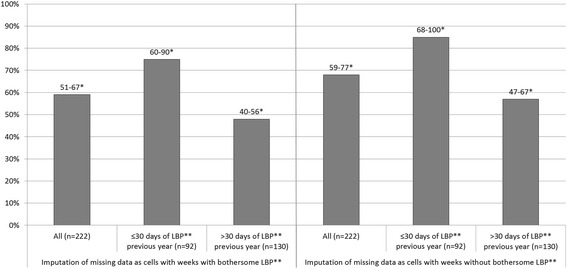
Sensitivity analysis comparing imputation of missing data as cells with or without weeks with bothersome pain in a best case and a worst case scenario. The Y-axis is displaying the percentage of the population with at least four consecutive weeks free from bothersome pain.
*CI, Confidence Interval