PMC full text:
Published online 2022 Nov 29.
Figure 2
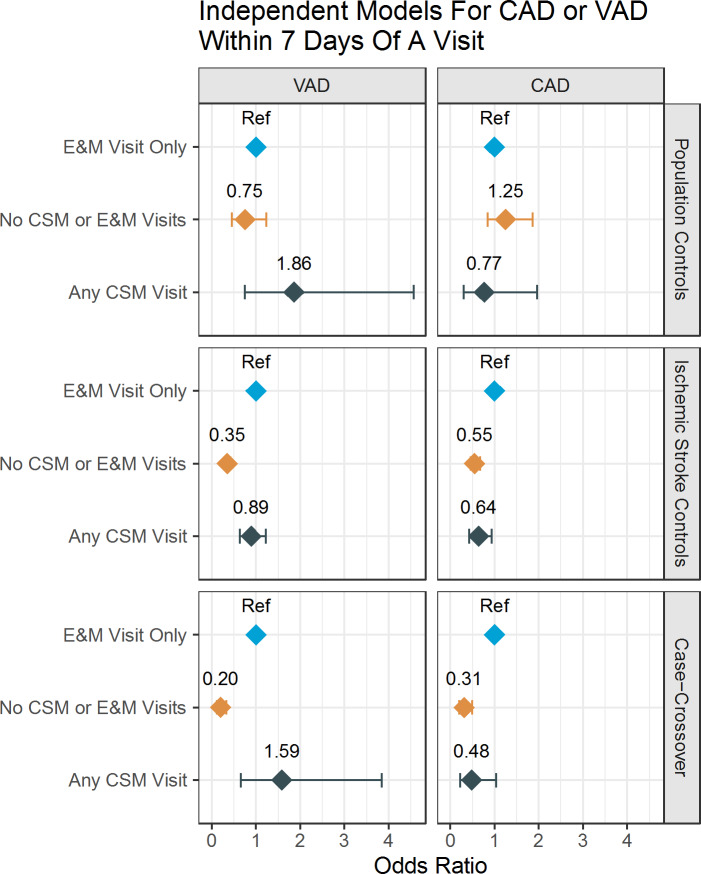
Association Of CeAD And encounter type by analytic approach. The Forest Plot displays odds ratios for the association of VAD and CAD with receiving - in the 7 days prior to diagnosis of CeAD - CSM, or neither CSM nor E&M, vs. E&M (referent group). The odds ratios are reported for three types of design: Medicare population case-controls, ischemic stroke controls, and case-crossover (the control is a 6 month look back in the case).