PLoS One 2025 (Dec 11); 20 (12): e0338730
Figure 2. The first point shows the difference between the groups after the intervention, and the second point shows the difference after the follow-up period.
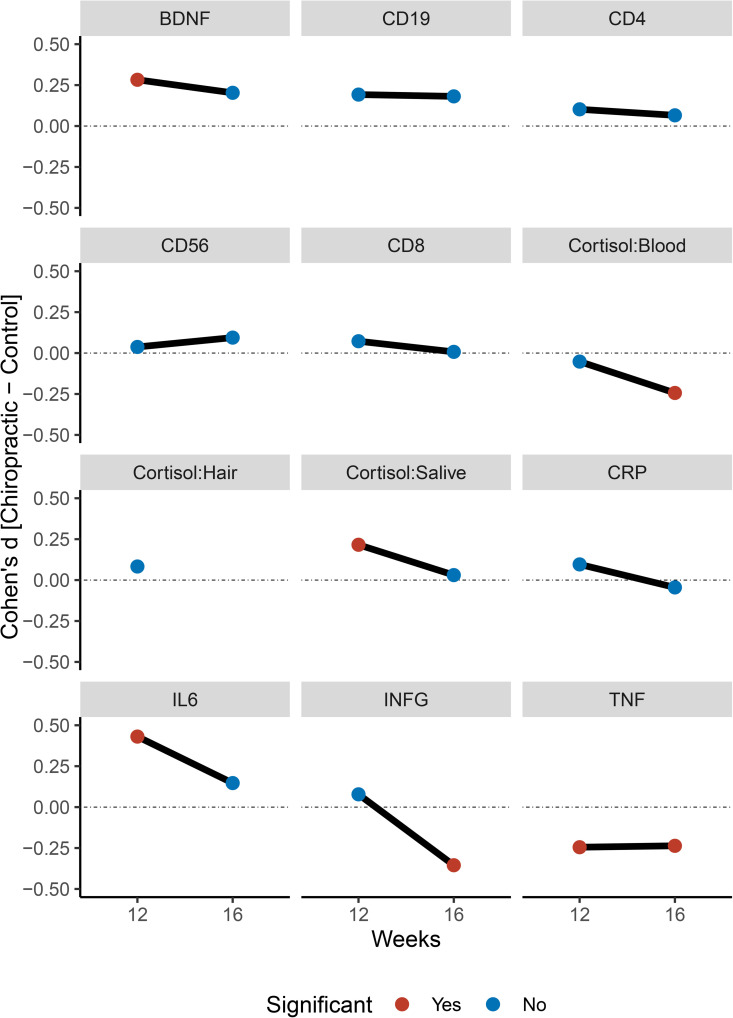
Positive values indicate that the chiropractic group has higher values, while negative values indicate that the control group has higher values.