

The Course of Low Back Pain in a General Population.
Results From a 5-year Prospective StudyThis section is compiled by Frank M. Painter, D.C.
Send all comments or additions to: Frankp@chiro.org


FROM: J Manipulative Physiol Ther. 2003 (May); 26 (4): 213–219 ~ FULL TEXT
Lise Hestbaek, DC, Charlotte Leboeuf-Yde, DC, PhD, Marianne Engberg, PhD,
Torsten Lauritzen, DrMedSc, Niels Henrik Bruun, Claus Manniche, DrMedSc
The Back Clinic,
Ringe, Denmark.
hestbaek@vip.cybercity.dk
OBJECTIVES: To investigate the course of low back pain (LBP) in a general population over 5 years.
DESIGN: Prospective population-based survey by postal questionnaires in 1991, 1992, and 1996.
SETTING: The municipal of Ebeltoft, Denmark.
SUBJECTS: Two thousand people aged 30 to 50 years, representative of the Danish population. Main outcome measure Number of days with low back pain during the past year.
RESULTS: One thousand three hundred seventy were recruited of whom 813 (59%) were followed to 5 years. The responders could be divided into 3 groups with regard to LBP: no pain, short-term pain, and long-lasting/recurring pain. More than one third of people who experienced LBP in the previous year did so for >30 days. Forty percent of people with LBP >30 days at baseline remained in that group 1 and 5 years later, and 9% with LBP >30 days in year 0 were pain free in year 5. People with LBP in year 0 were 4 times more likely to have LBP in year 1, and 2 times more likely to be affected in year 5.
CONCLUSIONS: Low back pain should not be considered transient and therefore neglected, since the condition rarely seems to be self-limiting but merely presents with periodic attacks and temporary remissions. On the other hand, chronicity as defined solely by the duration of symptoms should not be considered chronic.
From the FULL TEXT Article:
Introduction
The natural history of a disease relates to its development in the absence of clinical intervention, whereas the clinical course is defined as the development subsequent to diagnosis and initiation of treatment. [1] Obviously, without understanding the natural history, the background for evaluation of the clinical course is lacking, and therapeutic interventions cannot be assessed in a rational manner. In fact, inadequate understanding of the course of a disease can lead to false conclusions about the need for and the benefits of therapeutic interventions. Furthermore, in conditions characterized by variation and change rather than by predictability and stability, the traditional categorization of acute, subacute, or chronic may not be appropriate. A definition based solely on the duration of symptoms relies on the assumption that the disease in question has a linear course. [2]
There is now convincing evidence that low back pain (LBP) is often a chronic condition characterized by a fluctuating pattern rather than a self-limiting course. [1, 3, 4] This view is supported by clinical studies showing that 36% to 76% of LBP patients had recurrences within a year [5-10] and other studies where previous LBP was shown to be an important predictor for LBP. [11-16] Hence, it might be questionable whether it is suitable that clinical guidelines for treatment of LBP base their recommendations mainly on the duration of present symptoms.
Most often in epidemiological studies, prevalence rates of LBP are reported at different intervals in time but without analyses of transition between groups. Cedrashi et al [2] found that 18% of a small population sample (n = 252) could be labeled as having chronic LBP at baseline and 19% were labeled as having chronic LBP 3 years later when using the standard definition of chronicity [17, 18] based on a duration of symptoms of >3 months. However, chronicity was present both times in only 8% of the study subjects. These results indicate that a certain proportion of the general population suffers from chronic LBP at any point in time but that this chronic proportion does not consist of the same individuals over time. Also, Waxman et al [19] in a large study (n = 1455) reported a change in chronicity in individuals over a 3-year period, with 52% of LBP sufferers reporting chronic LBP at either survey but only 36% at both surveys.
This possible transition in pain status deserves further attention in the attempt to better understand the natural history of LBP. Although there exists some work about transition in pain status in the field of general pain, [20] the 2 studies mentioned above [2, 19] are, to our knowledge, the only ones investigating the transition in LBP status. In both these studies, LBP status was measured at 2 points in time over a 3-year period. The aim of the present study was to investigate the transition in LBP status over a 5-year period in a population-based sample. This was achieved by following the LBP status, defined by duration of symptoms during the past year, at 3 points in time over a 5-year period. In particular, we investigated the distribution of LBP subgroups, as well as the stability within and transition between subgroups.
2. Method
2.1. Baseline data
In 1991, a total of 2000 people were invited to participate in a prospective, population-based survey by postal questionnaires about health, life-style, and psychosocial factors. Responders were randomized into 3 groups — 1 control group and 2 intervention groups. The interventions consisted of health checks and health talks. Follow-up surveys were undertaken 1 and 5 years later. The study group consisted of randomly selected men and women living in the municipal of Ebeltoft, Denmark, aged 30 to 50 years. They were found to be representative of the Danish target population, except for some small discrepancies between the proportion of salaried and self-employed people (with a higher proportion of self-employed people in the study sample). Data records were considered satisfactory, since data check of the baseline data revealed an error rate of less than 0.1%. The survey is described in detail elsewhere. [21]
The main question of interest for this article was: “How many days during the past year have you had problems with the lower part of your back? 0 days, 1 to 7 days, 8 to 30 days, more than 30 days but not daily, or daily.” The group with daily pain was too small for reasonable analysis; therefore, the 2 groups “more than 30 days but not daily” and “daily” were combined into 1 group: “more than 30 days.” Furthermore, the question, “Have you had any problems with the lower part of your back within the previous year?” was used for validation.
2.2. Validation
The quality of data records for follow-up was considered satisfactory, since there was double data entry in year 1 [21] and data from year 5 were electronically read by Teleform, which has shown an error rate comparable with double manual entry for choice fields. [22]
The LBP questions were modelled on Biering-Sřrensen’s [23] questions on occurrence of LBP in a previous survey and have been tested for reproducibility. [24] The test-retest agreement of prevalence estimates of LBP for the baseline data of the present study has been calculated in a previous study, showing total agreement between 2 LBP variables (lifetime incidence and 1-year period prevalence) in 83% of cases, possibly acceptable responses in a further 13% (ie, yes-no) and definitely unacceptable replies (no-yes) in 4% of the responses. [25] Another validation procedure was performed in the present study by comparing the 2 variables: “Have you had any problems with the lower part of your back within the previous year?” and “How many days during the past year have you had problems with the lower part of your back?” for participants in year 1.
2.3. Data analysis
Baseline responders were examined for representativeness in relation to the original sample with regard to age and sex. Nonresponders in years 1 and 5 were examined with regard to sex, age, and LBP at baseline. Furthermore, it was tested whether the intervention had an effect on LBP. This was done by calculating the differences in LBP category between year 0 and year 1 and between year 0 and year 5 and comparing the distribution of change between intervention groups. Pearson χ2 test was used to test the null hypothesis that there was no association between change in LBP and intervention group.
The data set was analyzed for associations between LBP and (1) age, (2) sex, and (3) “sex given age.” Pearson χ2 test was used to test the null hypothesis that there was no association between LBP and sex and/or age. The distribution between LBP subgroups (number of days with LBP the past year) was presented as prevalence rates reported with 95% confidence intervals (CI).
Stability within the LBP subgroups was investigated to determine the proportion of persons remaining in the same category throughout the 3 surveys. Transition probabilities were calculated as proportions moving from one subgroup to another over a 1-year period and over a 5-year period. Furthermore, the movements of people with LBP >30 days at baseline were analyzed separately and presented graphically.
2.3.1. Post hoc analysis
To compensate for missing information, a “maximum/minimum” scenario was applied in the analysis of stability. This was done by defining all nonresponders in years 1 and 5 as still belonging to the same group as at baseline, “maximum,” or assuming that none of the nonresponders remained in the same category, “minimum.”
3. Results
3.1. Description of sample

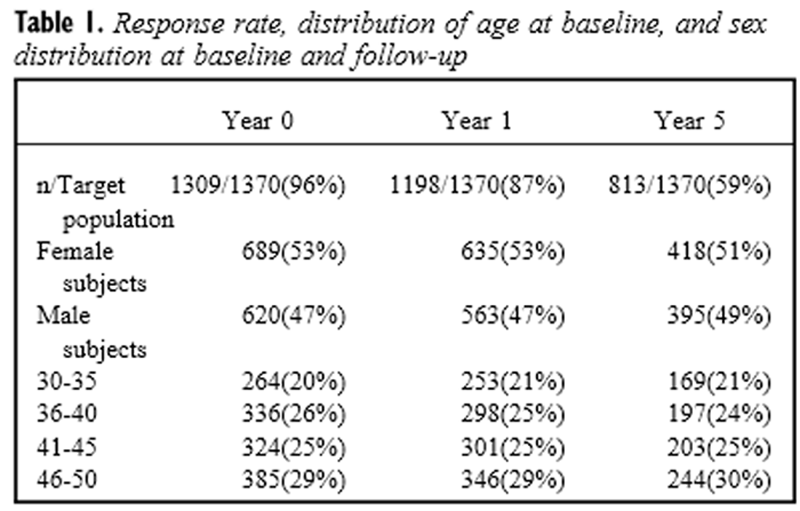
Table 1 Of the 2000 selected subjects, 1370 (69%) participated in the study at baseline. Twenty-one subjects were excluded due to conflicting answers. A further 40 subjects did not answer the question about number of LBP days at baseline, leaving 1309 for this analysis. The response rates at baseline, year 1, and year 5, as well as the characteristics of the sample are shown in Table 1. The change in LBP status from year 0 to year 1 and from year 0 to year 5 was not significantly different between the 3 randomized groups (P = .2412 and P = .5775, respectively). Thus, the 3 different groups could be considered as 1 group.
3.2. Validation
The comparison between the 2 LBP variables for year 1 showed an unacceptable response (LBP the previous year/LBP for 0 days the previous year, or no LBP the previous year/LBP for more than 0 days the previous year) in only 1% (15/1352) of cases.
3.3. Representativeness
The 1309 subjects included persons who were found to be representative of the original sample with regard to age (P = .30) but not with regard to sex because of a statistically significant overrepresentation of females (53% vs 51%; P = 0.002). The nonresponders in year 1 were not found to be biased by either sex or age, whereas nonresponders in year 5 were found to be biased for sex (P = .007), with somewhat fewer female participants than expected (51% vs 53% at baseline), but not for age.
Responders and nonresponders at follow-up were almost evenly distributed between LBP subgroups at baseline. Subjects with no pain at baseline had a slightly higher response rate (statistically nonsignificant) than those with pain for more than 30 days in both year 1 (91% and 88%, respectively; P > .2) and year 5 (62% and 58% respectively, P > .2).
3.4. LBP reporting
3.4.1. Distribution between subgroups
Table 2
Table 3
Table 4
Figure 1

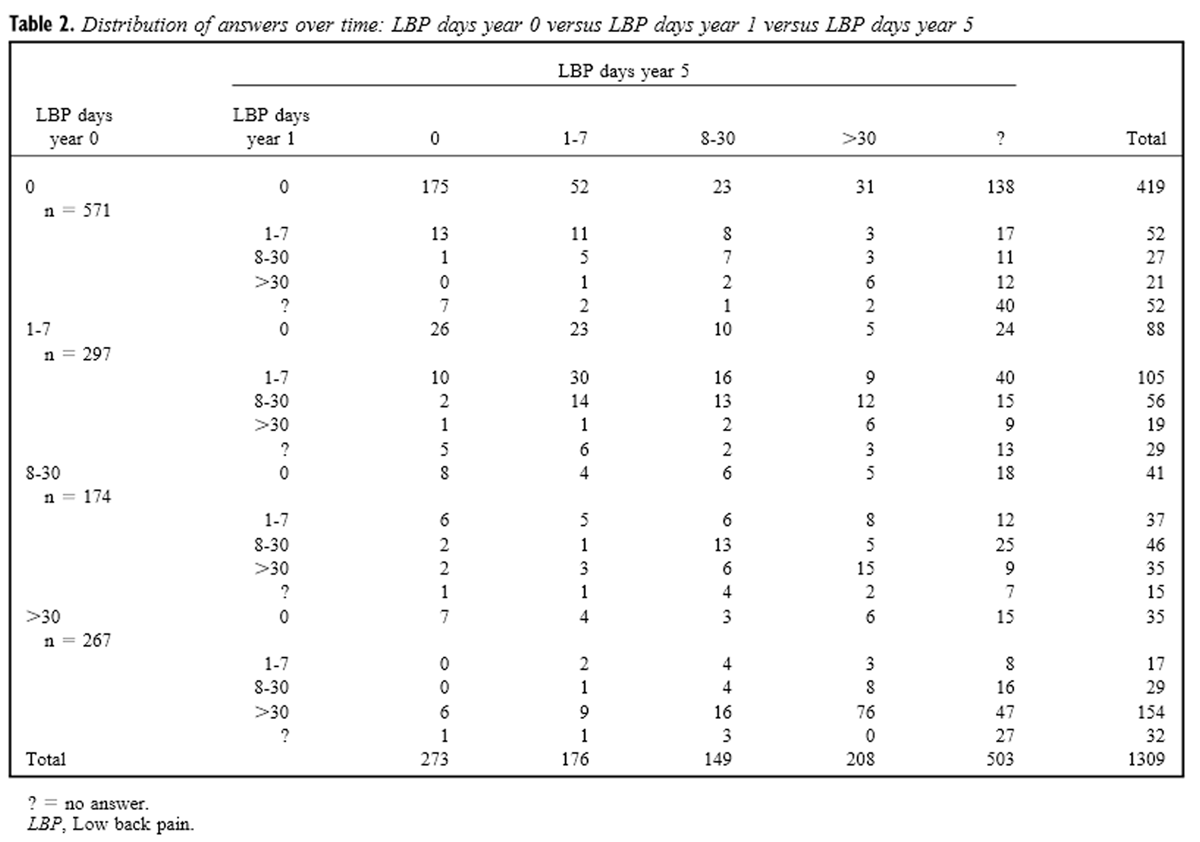
Figure 2 The distribution of number of days with LBP during the past year is seen in Table 2 and the distribution of the different subgroups of LBP is included in Table 3. As seen, almost half of all the participants were asymptomatic, whereas the rest were distributed between the different subgroups of LBP. Thus, 36% (95% CI: 33%-40%) of the persons with any extent of pain in year 0 had pain for more than 30 days. The corresponding figures for years 1 and 5 are 39% (95% CI: 35%-42%) and 39% (95% CI: 35%-43%), respectively.
There were no statistically significant differences in the occurrence of LBP between age groups in the 3 surveys, but there was a slightly significant overrepresentation of women in the group with pain >30 days in years 1 and 5 (data not shown).
3.4.2. Movements between groups
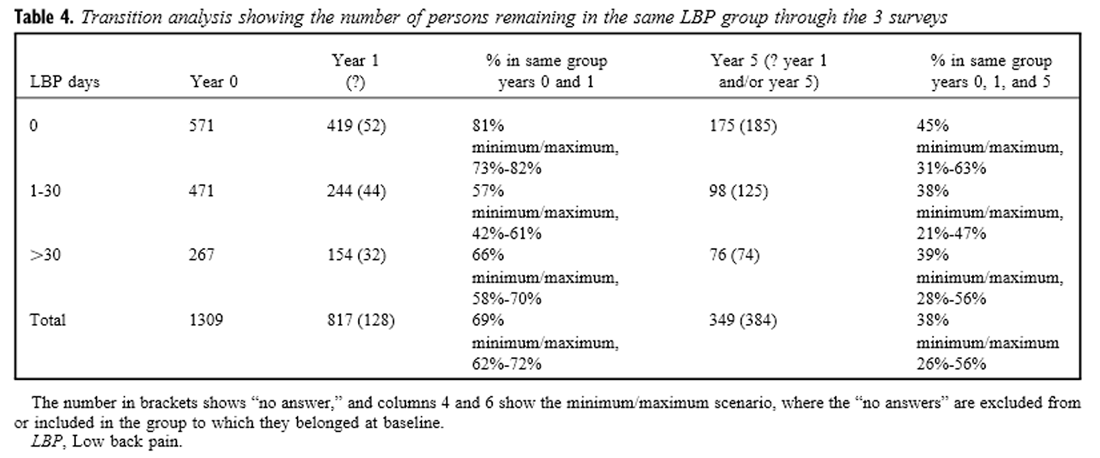
Table 4 shows the stability within the LBP groups throughout the 3 surveys. The extremes (0 or >30 days) are the most stable groups with, respectively, 45% (minimum/maximum: 31%-63%) and 39% (minimum/maximum: 28%-56%) remaining in the same category versus 13% (minimum/maximum: 10%-33%) and 10% (minimum/maximum: 7%-30%), respectively, for the middle groups (1-7 and 8-30 days). The groups with LBP 1 to 7 days and LBP 8 to 30 days have similar patterns but differ from the 2 extreme groups. If these 2 subgroups are grouped together, their stability increases to 38% (minimum/maximum: 21%-47%), which approximates the level of the 2 outer groups. This indicates that there are basically 3 population groups: never pain, short-lasting/rarely recurring pain, and long-lasting/recurring pain. Therefore, for ease of interpretation in further analyses, the subgroup classification will be “0 days,” “1 to 30 days,” and “>30 days.”
There is a large fluctuation between groups, but movements between extremes are rare: only 9% (14/154) with LBP for >30 days in year 0 had no pain in year 5, and only 13% (43/341) without LBP in year 0 had LBP for >30 days in year 5. Transition probabilities between groups are shown in Figure 1, A and B.
Throughout all 3 surveys, 10% of the whole sample (76/765) had pain for >30 days; 13% (98/765) had pain 1 to 30 days; and 23% (175/765) were pain free. The transition of people with LBP >30 days in year 0 is illustrated in Figure 2.
3.4.3. Key messages
The key messages regarding LBP reporting are as follows:
The population can be divided into 3 almost equally large groups with regard to LBP: no pain, short-term pain, and long-lasting/recurring pain.
Transitions between groups are common, but movements between no pain and long-lasting/recurring pain are rare.
Approximately one third of the study subjects remain in the same category throughout all 3 surveys.
At the time of each survey, 20% to 26% of the population report long-lasting/recurrent LBP but only 10% of the population report long-lasting/recurrent LBP at all 3 surveys.
4. Discussion
Obviously, studying the true natural history of LBP over a 5-year period is not possible. It is not feasible to keep people away from all kinds of treatment (eg, exercise or massage) for such a long period of time. However, this study represents an alternative. We did not study the natural history in the absence of intervention, but since the intervention of the study did not influence LBP status, we assumed that we were able to describe the course of LBP in a normal behaving population. The results from this population-based study show that there is a large fluctuation between LBP groups, with only approximately one third of the study subjects remaining in the same LBP category throughout all 3 surveys.
These results support the view of LBP as a condition characterized by variation and change [1, 3, 4] rather than a disease entity with a well-defined temporal delimitation. It rarely seems to be self-limiting but rather presents with periodic remissions. These results are also in accordance with the high recurrence rate reported in the epidemiological literature [5-10] but disagree with the common notion that the majority of LBP attacks are benign and self-limiting [26, 27] and therefore can be ignored. In fact, it indicates that the recommendations in various clinical guidelines must be reconsidered with regard to the division of patients into acute, subacute, or chronic. Presently, these guidelines recommend different types of treatment for LBP of different duration (eg, exercises after LBP for >6 weeks). [17] Allocating patients to different treatment regimes on the basis of the duration of present symptoms alone does not appear to be suitable, considering the large fluctuations shown in this and other studies.
In our population, 20% reported long-lasting/recurrent LBP (>30 days during the past year) in year 0, 20% in year 1, and 26% in year 5. However, only 10% of these remained in this group throughout all 3 surveys. These results compare well with those of Cedrashi et al, [2] whose corresponding figures were 18% and 19% of chronic LBP sufferers (LBP >3 months) in a population, surveyed 3 years apart, with chronicity being stable in 8% of the individuals. When using a broader definition of chronicity, including psychosocial aspects, their figures were 14%, 14%, and 6%, respectively. Surprisingly, the proportion of “chronics” in our study was only slightly higher than that in the study by Cedrashi et al, [2] despite our broader definition of chronicity. Additionally, the pattern of the chronicity of LBP is the same in our study as in the study by Cedrashi et al. [2] Likewise, Waxman et al [19] showed that 31% of people with chronic LBP in 1994 had improved to acute LBP in 1997. Their definition of chronicity was “some back pain most days for more than 3 months,” resulting in 26% of the LBP sufferers in their population being chronic at the time of each survey. Although the proportion of chronic patients can be expected to change as the definition of chronicity changes, the proportion of stable chronic patients remains significantly smaller than the total proportion of “chronics.”
Because of this instability of chronicity, the term chronic should be used with caution. The label chronic LBP can easily serve to keep the LBP patient in a pattern of disease behavior through self-fulfillment, thus counteracting improvement and return to normal function. The present definition of chronicity, based solely on the duration of symptoms, may lead to misclassification of patients and may also lead to misleading conclusions in epidemiologic studies.
The validity of the present study, as well as the initial response rate, has been demonstrated to be satisfactory. Nevertheless, the poor response rate in year 5 is a source of concern. In the transition analyses (Table 4), this is accounted for by making the “minimum/maximum” analysis: the real-life figures will still be within the ranges shown. However, Table 3 should be interpreted with caution, since the relative increase of LBP reporting in year 5 cannot be fully explained by age but could indicate a systematic bias with an underrepresentation of pain-free subjects in year 5. On the other hand, the fact that nonresponders at follow-up have the same distribution of pain at baseline as the responders contradicts the presence of such a bias. The transition patterns between the groups are similar for men and women, so the effect of female overrepresentation can be considered to be unimportant in the transition analyses.
5. Conclusion
5.1. Implications for research
Based on the large time-dependent variation of LBP reporting in an individual, the traditional reporting of chronicity in a population, at a specific point in time, must be reconsidered. Although the figure seems rather stable, the proportion of chronic LBP sufferers should perhaps be regarded as a biological, population-based constant, rather than an individual-based constant.
5.2. Implications for practice
The term chronic should be used with caution, not to induce unnecessary defeatism into the therapeutic thinking. Furthermore, LBP should not be dismissed as being transient (and therefore neglected), since the condition rarely seems to be self-limiting but merely presents with periodic attacks and temporary remissions.
5.3. Implications for policymaking
Guidelines building their recommendations mainly on the duration of the present episode of LBP should be reconsidered.
Acknowledgments
The following general practitioners participated in the study: A Břgedal, P Grřnbćk, L Jřrgensen, PT Jřrgensen, H Lundberg, JM Nielsen, GS Pedersen, JC Rahbek, and N Bie. We thank the staff at the GP clinic in Ebeltoft for their extraordinary effort, including the extensive and brilliant administrative assistance given by A Hilligsře and E Therkildsen. Financial support was given by the County Health Insurance Office of Aarhus; the Health Promotion Council of Aarhus; the Ministry of Health Foundation for Research and Development; the Health Insurance Fund; the Lundbeck Foundation’s Scientific Research Grant to General Practitioners; the Danish College of General Practitioners: a Sara Krabbe scholarship, a Lundbeck scholarship; the General Practitioners’ Education and Development Fund; the Danish Diabetes Association; the Danish Heart Foundation (97-2-F-22515); the Danish Research Foundation for General Practice; Swedish Chiropractors’ Association; Norwegian Chiropractors Association; the Novo Care Research Fund; the Novo Nordisk Foundation; ASTRA Denmark; Bayer Denmark A/S; Roche Denmark A/S; Farmitalia Carlo Erba/Erbamont Group; and Ebeltoft Municipal Council.
References
Von Korff, M.
Studying the natural history of low back pain.
Spine. 1994; 19: S2041–2046Cedraschi, S., Robert, J., Goerg, D., Perrin, E., Fischer, W., and Vischer, T.L.
Is chronic non-specific low back pain chronic?
Definitions of a problem and problems of a definition.
Br J Gen Pract. 1999; 49: 358–362Seferlis, T., Németh, G., Carlsson, A., and Gillström, P.
Acute low-back-pain patients exhibit a fourfold increase in sick leave
for other disorders (a case-control study) .
J Spinal Disord. 1999; 12: 280–286Croft, P., Macfarlane, G., Papageorgiou, A. (1998).
Outcome of low back pain in general practice:
A prospective study
BMJ 1998 (May 2); 316 (7141): 1356–1359Abenhaim, L., Suissa, S., and Rossignol, M.
Risk of recurrence of occupational back pain. A three year follow up.
Br J Ind Med. 1988; 45: 829–833Borghouts, J.A.J., Koes, B.W., and Bouter, L.M.
The clinical course and prognostic factors of non-specific neck pain
(a systematic review).
Pain. 1998; 77: 1–13Burton, A.K., Clarke, R.D., McClune, T.D., and Tillotson, K.M.
The natural history of low back pain in adolescents.
Spine. 1996; 21: 2323–2328Cherkin DC, Deyo RA, Battie M, et al.
A Comparison of Physical Therapy, Chiropractic Manipulation, and Provision
of an Educational Booklet for the Treatment of Patients with Low Back Pain
New England Journal of Medicine 1998 (Oct 8); 339 (15): 1021-1029van den Hoogen, H.J., Koes, B.W., van Eijk, J.T., Bouter, L.M., and Devillé, W.
Pain and health status of primary care patients with low back pain.
J Fam Pract. 1997; 44: 187–192Mikkelson, M., Salminen, J.J., and Kautiainen, H.
Non-specific musculoskeletal pain in preadolescents.
Prevalence and 1-year persistence.
Pain. 1997; 73: 29–35Carey, S.T., Garrett, J.M., Jackman, A., and Hadler, N.
Recurrence and care seeking after acute back pain.
Med Care. 1999; 37: 157–164Dixon, A.J.
Progress and problems in back pain research.
Rheumatol Rehabil. 1973; 12: 165–175Greenough, C.G.
Recovery from low back pain. 1-5 year follow-up of 287 injury-related cases.
Acta Orthop Scand Suppl. 1993; 254: 1–34Hagen, K.B. and Thune, O.
Work incapacity from low back pain in the general population.
Spine. 1998; 23: 2091–2095Harreby, M., Kjer, J., Hesselsře, G., and Neergaard, K.
Epidemiological aspects and risk factors for low back pain in 38-year-old
men and women (a 25-year prospective cohort study of 640 school children) .
Eur Spine J. 1996; 5: 312–318van den Hoogen, H.J.M., Koes, B.W., Devillé, W.,
van Eijk, J.T.M., and Bouter, L.M.
The prognosis of low back pain in general practice.
Spine. 1997; 22: 1515–1521Statens Institut for Medicinsk Teknologivurdering:
Ondt i ryggen: Forekomst, behandling og forebyggelse i et MTV-perspektiv.
Medicinsk Teknologivurdering Series B 1999van Tulder M, Becker A, Bekkering T, Breen A, Carter T, Gil del Real MT.
European Guidelines for the Management of Acute Nonspecific Low Back Pain in Primary Care
European Spine Journal 2006 (Mar); 15 Suppl 2: S169–191Waxman, R., Tennant, A., and Helliwell, P.
A prospective follow-up study of low back pain in the community.
Spine. 2000; 25: 2085–2090McBeth, J., Macfarlane, G.J., Benjamin, S., and Silman, A.J.
Features of somatization predict the onset of chronic widespread pain
(results of a large population-based study).
Arthritis Rheum. 2001; 44: 940–946Lauritzen, T., Leboeuf-Yde, C., Lunde, I.M., and Nielsen, K.B.
Ebeltoft Project(baseline data from a five-year randomised, controlled,
prospective health promotion study in a Danish population).
Br J Gen Pract. 1995; 45: 542–547Jorgensen, C.K. and Karlsmose, B.
Validation of automated forms processing. A comparison of Teleform with
manual data entry.
Comput Biol Med. 1998; 28: 659–667Biering-Sřrensen, F.
Low back trouble in a general population of 30-, 40-, 50-, and
60-year-old men and women.
Dan Med Bull. 1982; 29: 289–299Biering-Sřrensen, F. and Hilden, J.
Reproducibility of the history of low-back trouble.
Spine. 1984; 9: 280–286Leboeuf-Yde, C., Klougart, N., and Lauritzen, T.
How common is LBP in the Nordic population? Data from a recent study on a
middle-aged Danish population and four surveys previously conducted
in the Nordic countries.
Spine. 1996; 21: 1518–1526Coste, J., Delecoeuillerie, G., Cohen de Lara, A., leParc, J.M., and Poalaggi, J.B.
Clinical course and prognostic factors in acute low back pain
(an inception cohort study in primary care practice).
BMJ. 1994; 308: 577–580Andersson, G.B.
Epidemiology of low back pain.
Acta Orthop Scand Suppl. 1998; 69: 28–31
Return to LOW BACK PAIN
Since 12-07-2015

| Home Page | Visit Our Sponsors | Become a Sponsor |
Please read our DISCLAIMER |