
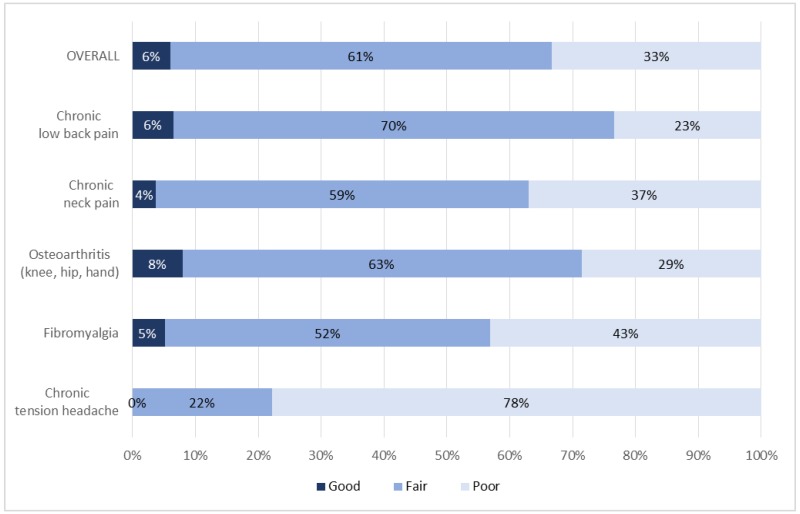
Figure 3 is bar graph depicting the distribution of individual study quality ratings across the report as a whole and by each chronic pain condition. Overall, 6% of trials were considered good quality, 61% were fair quality, and 33% were poor quality. For low back pain, 6% were good quality, 70% fair quality, and 23% poor quality. For neck pain, 4% were good quality, 59% were fair quality, and 37% were poor quality. For osteoarthritis, 8% were good quality, 63% were fair quality and 29% were poor quality. For fibromyalgia, 5% were good quality, 52% were fair quality, and 43% were poor quality. For tension headache, 22% were fair quality and 78% were poor quality; there were no good quality studies for headache.

Figure 3Overview and distribution of quality analysis ratings

From: Results

Cover of Noninvasive Nonpharmacological Treatment for Chronic Pain: A Systematic Review Update
Noninvasive Nonpharmacological Treatment for Chronic Pain: A Systematic Review Update [Internet].
Comparative Effectiveness Review, No. 227.
Skelly AC, Chou R, Dettori JR, et al.

NCBI Bookshelf. A service of the National Library of Medicine, National Institutes of Health.
External link. Please review our privacy policy.