European Journal of Applied Physiology
PMC full text:
Published online 2018 Jan 11.
Fig. 2
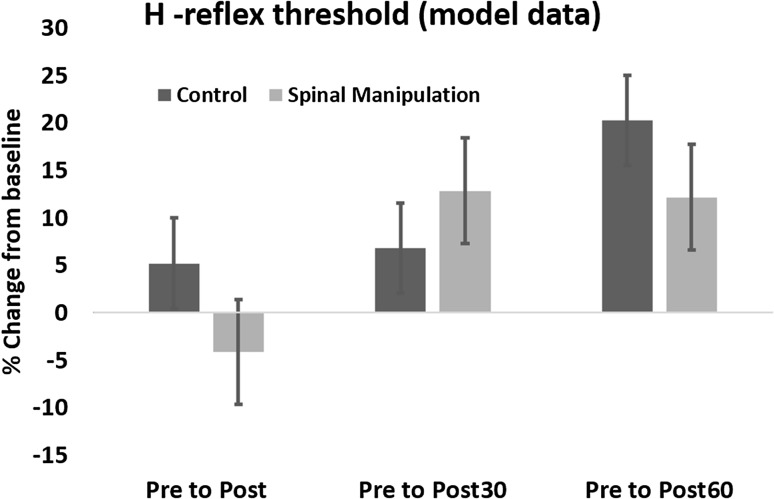
Relative changes in the H-reflex threshold of the model data in the SM intervention and control intervention. The dark columns show the H-reflex threshold in the control session and the bright columns shows the H-reflex threshold following SM. Error bar (std), p < 0.05