European Journal of Applied Physiology
PMC full text:
Published online 2018 Jan 11.
Fig. 4
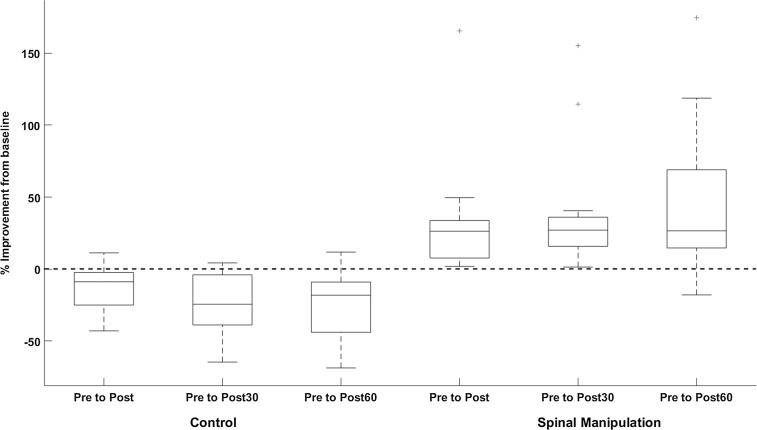
Relative changes in the V-wave amplitude (V/Mmax ratio) of the SM intervention and control intervention. The first three columns show a decline in the V-wave in the control session and the last three columns show an improvement in the V-wave following SM. Error bar (std), p < 0.05