European Journal of Applied Physiology
PMC full text:
Published online 2018 Jan 11.
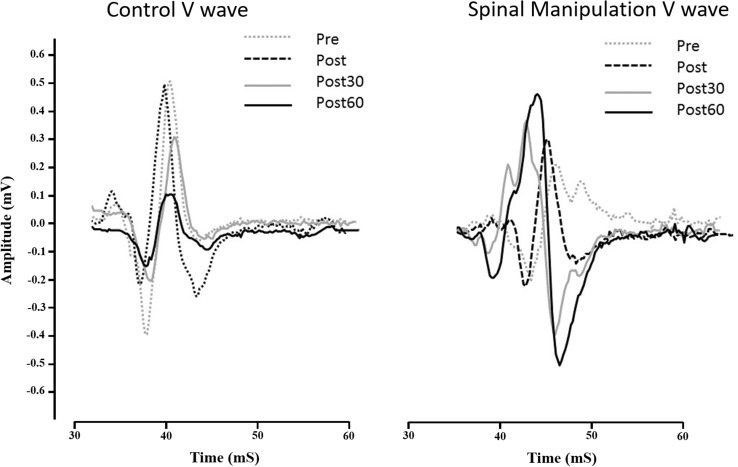 Change in the V-wave for a typical subject (N = 1). The graph illustrates average sEMG traces and the size of the V-wave before and after SM intervention and control intervention
Fig. 5
Change in the V-wave for a typical subject (N = 1). The graph illustrates average sEMG traces and the size of the V-wave before and after SM intervention and control intervention