

Exploring the Clinical Course of Neck Pain
in Physical Therapy: A Longitudinal StudyThis section was compiled by Frank M. Painter, D.C.
Send all comments or additions to: Frankp@chiro.org


FROM: Arch Phys Med Rehabil. 2014 (Feb); 95 (2): 303–308 ~ FULL TEXT
OPEN ACCESS David M. Walton, PhD, Yaara Eilon-Avigdor, MClSc,
Michael Wonderham, MClSc, Piotr Wilk, PhD
School of Physical Therapy,
Western University,
London, Ontario, Canada.
dwalton5@uwo.ca
OBJECTIVE: To investigate the short-term trajectory of recovery from mechanical neck pain, and predictors of trajectory.
DESIGN: Prospective, longitudinal cohort study with 5 repeated measurements over 4 weeks.
SETTING: Community-based physical therapy clinics.
PARTICIPANTS: Convenience sample of community-dwelling adults (N=50) with uncomplicated mechanical neck disorders of any duration.
INTERVENTIONS: Usual physical therapy care.
MAIN OUTCOME MEASURES: Neck Disability Index (NDI), numeric rating scale (NRS) of pain intensity.
RESULTS: A total of 50 consecutive subjects provided 5 data points over 4 weeks. Exploratory modeling using latent class growth analysis revealed a linear trend in improvement, at a mean of 1.5 NDI points and 0.5 NRS points per week. Within the NDI trajectory, 3 latent classes were identified, each with a unique trend: worsening (14.5%), rapid improvement (19.6%), and slow improvement (65.8%). Within the NRS trajectory, 2 unique trends were identified: stable (48.0%) and improving (52.0%). Predictors of trajectory class suggest that it may be possible to predict the trajectory. Results are described in view of the sample size.
CONCLUSIONS: The mean trajectory of improvement in neck pain adequately fits a linear model and suggests slow but stable improvement over the short term. However, up to 3 different trajectories have been identified that suggest neck pain, and recovery thereof, is not homogenous. This may hold value for the design of clinical trials.
KEYWORDS: BIC; BLRT; Bayesian information criterion; CI; LCGA; Longitudinal studies; NDI; NRS; Neck; Neck Disability Index; Physical therapists; Rehabilitation; TSK-11; Tampa Scale for Kinesiophobia 11-item version; bootstrapped likelihood ratio test; confidence interval; latent class growth analysis; numeric rating scale
Introduction
Physical therapy is a common treatment for neck-related pain and disability, a condition affecting an estimated one third of North American adults over a 1-year period. [1] Physical therapy refers to nonmedical rehabilitation that may include advice, education, manual treatment, thermal or electrical modalities, and specific exercise. Evidence to support many of these approaches is scant overall. [2, 3] Given the nature of physical therapy interventions, empirical research data are drawn from usually nonblinded, pre-post randomized designs. While these designs are appropriate for demonstrating effectiveness, observational designs with repeated measurements at frequent intervals are more able to provide detailed knowledge on the trajectory of change in a condition. Knowing the trajectory of change, or clinical course of a condition, facilitates clinical research design, treatment planning, and policy decisions. In order to establish the clinical course, repeated measures designs are required. Since clinical course cannot be assumed to be homogenous between individuals, factors that influence the clinical course are also important to recognize. Evidence of long-term recovery trajectories has been provided previously, [4] but shorter-term (<6wk) trajectories, of the duration often seen in clinical practice, are less explored.
We sought to explore the clinical course of mechanical neck pain and disability as it changed over 1 month of usual care (nonspecialized) outpatient physical therapy treatment. The purpose of this pilot longitudinal study was to identify the standard trajectories of improvement in this heterogenous condition, the relative proportion of subjects within each trajectory, and the clinical variables that may influence this trajectory.
Methods
This was an observational longitudinal design with 5 repeated measures. Subjects were recruited from 1 of 5 community-based outpatient physical therapy clinics in Canada if they presented for treatment of mechanical neck pain or disability of any duration, were between 18 and 65 years of age, and could speak and understand conversational English. Eligible subjects had to rate their worst level of neck pain intensity over the previous 24 hours between 2 and 9 out of 10. Subjects were excluded if the cause of their symptoms was fracture, dislocation, tumor (benign or malignant), or infection, or if they had neuromuscular disease or rheumatic conditions (eg, fibromyalgia). Informed, written consent was obtained before enrollment, and all methods were approved by the institutional research ethics board at Western University Canada.
Data were collected on initial presentation to the clinician (t0), then every week for the following 4 weeks (t1, t2, t3, t4). When subjects were discharged or discontinued physical therapy before the final follow-up period (n=2), their data for the final period were considered missing for the purposes of statistical analysis. Subjects completed a demographics form and reported the presence of radiating pain to either upper extremity (yes/no), usage of any medication specifically for neck pain within the past 24 hours (yes/no), number of pain locations on a segmented body diagram, worst pain intensity on a numeric rating scale (NRS) (0–10), [5] fear of movement/(re)injury using the Tampa Scale for Kinesiophobia 11-item version (TSK-11, 0–33), [6] and neck-related disability using the Neck Disability Index (NDI) (0–50). [7] The 3 formalized questionnaires (NRS, TSK-11, NDI) have been evaluated in clinical populations with neck pain and have satisfactory psychometric properties. [8, 9] When subjects missed a scheduled data collection point, their data for that point were coded as missing, and data collection resumed at the next weekly interval. Treatment was individualized to each patient according to usual physical therapy procedures and included any or all of the following:manual joint mobilization
soft tissue stretching
physical modalities
specific exercise prescription
and advice and education.
Analyses
Descriptive analyses (frequencies, means and SDs) were calculated to describe the sample. Using latent growth curve analysis for each of the primary variables (NRS, NDI), we assessed whether a linear or quadratic growth model provided the best fit to the data while controlling for duration of symptoms. Basic fit indicators were used to determine model fit. They were (including standards for “good” fit) comparative fit index (>.90), Tucker-Lewis Index (>.90), root mean square error of approximation (<.08), and chi-square (P>.05). Latent class growth analysis (LCGA) was then conducted to identify the number of latent NDI and NRS trajectories (latent classes) that were present within the sample. As described by Jung and Wickrama, [10] we started by specifying a single class model without covariates to establish baseline fit indices. Then additional (k) classes were requested until the Bayesian information criterion (BIC) was lowest while the bootstrapped likelihood ratio test (BLRT) no longer showed a significant improvement in model fit over the k-1 class model, and entropy was closest to 1.0. BIC and BLRT have been endorsed as the most accurate model fit statistics for determining the number of latent classes. [11] Sample size for this hypothesis-generating exploratory study was estimated at 50 subjects. Consensus on sample size calculation for latent class analysis has yet to be reached, being dependent on the separation of classes and relative proportions of subjects per class. As an exploratory study, 50 subjects was deemed adequate to provide guidance for future research in the area.
Analysis of variance (continuous data) or chi-square (categorical data) was used to determine the ability of any of the baseline variables (sex, age, duration of symptoms, radiating symptoms, use of pain medication, traumatic cause, number of pain locations, baseline NDI, NRS, or TSK-11) to discriminate between the trajectory classes. The model fitting procedures were conducted using MPlus software version 6.12,a and the class membership comparisons were conducted in SPSS version 20.b
Results

Table 1
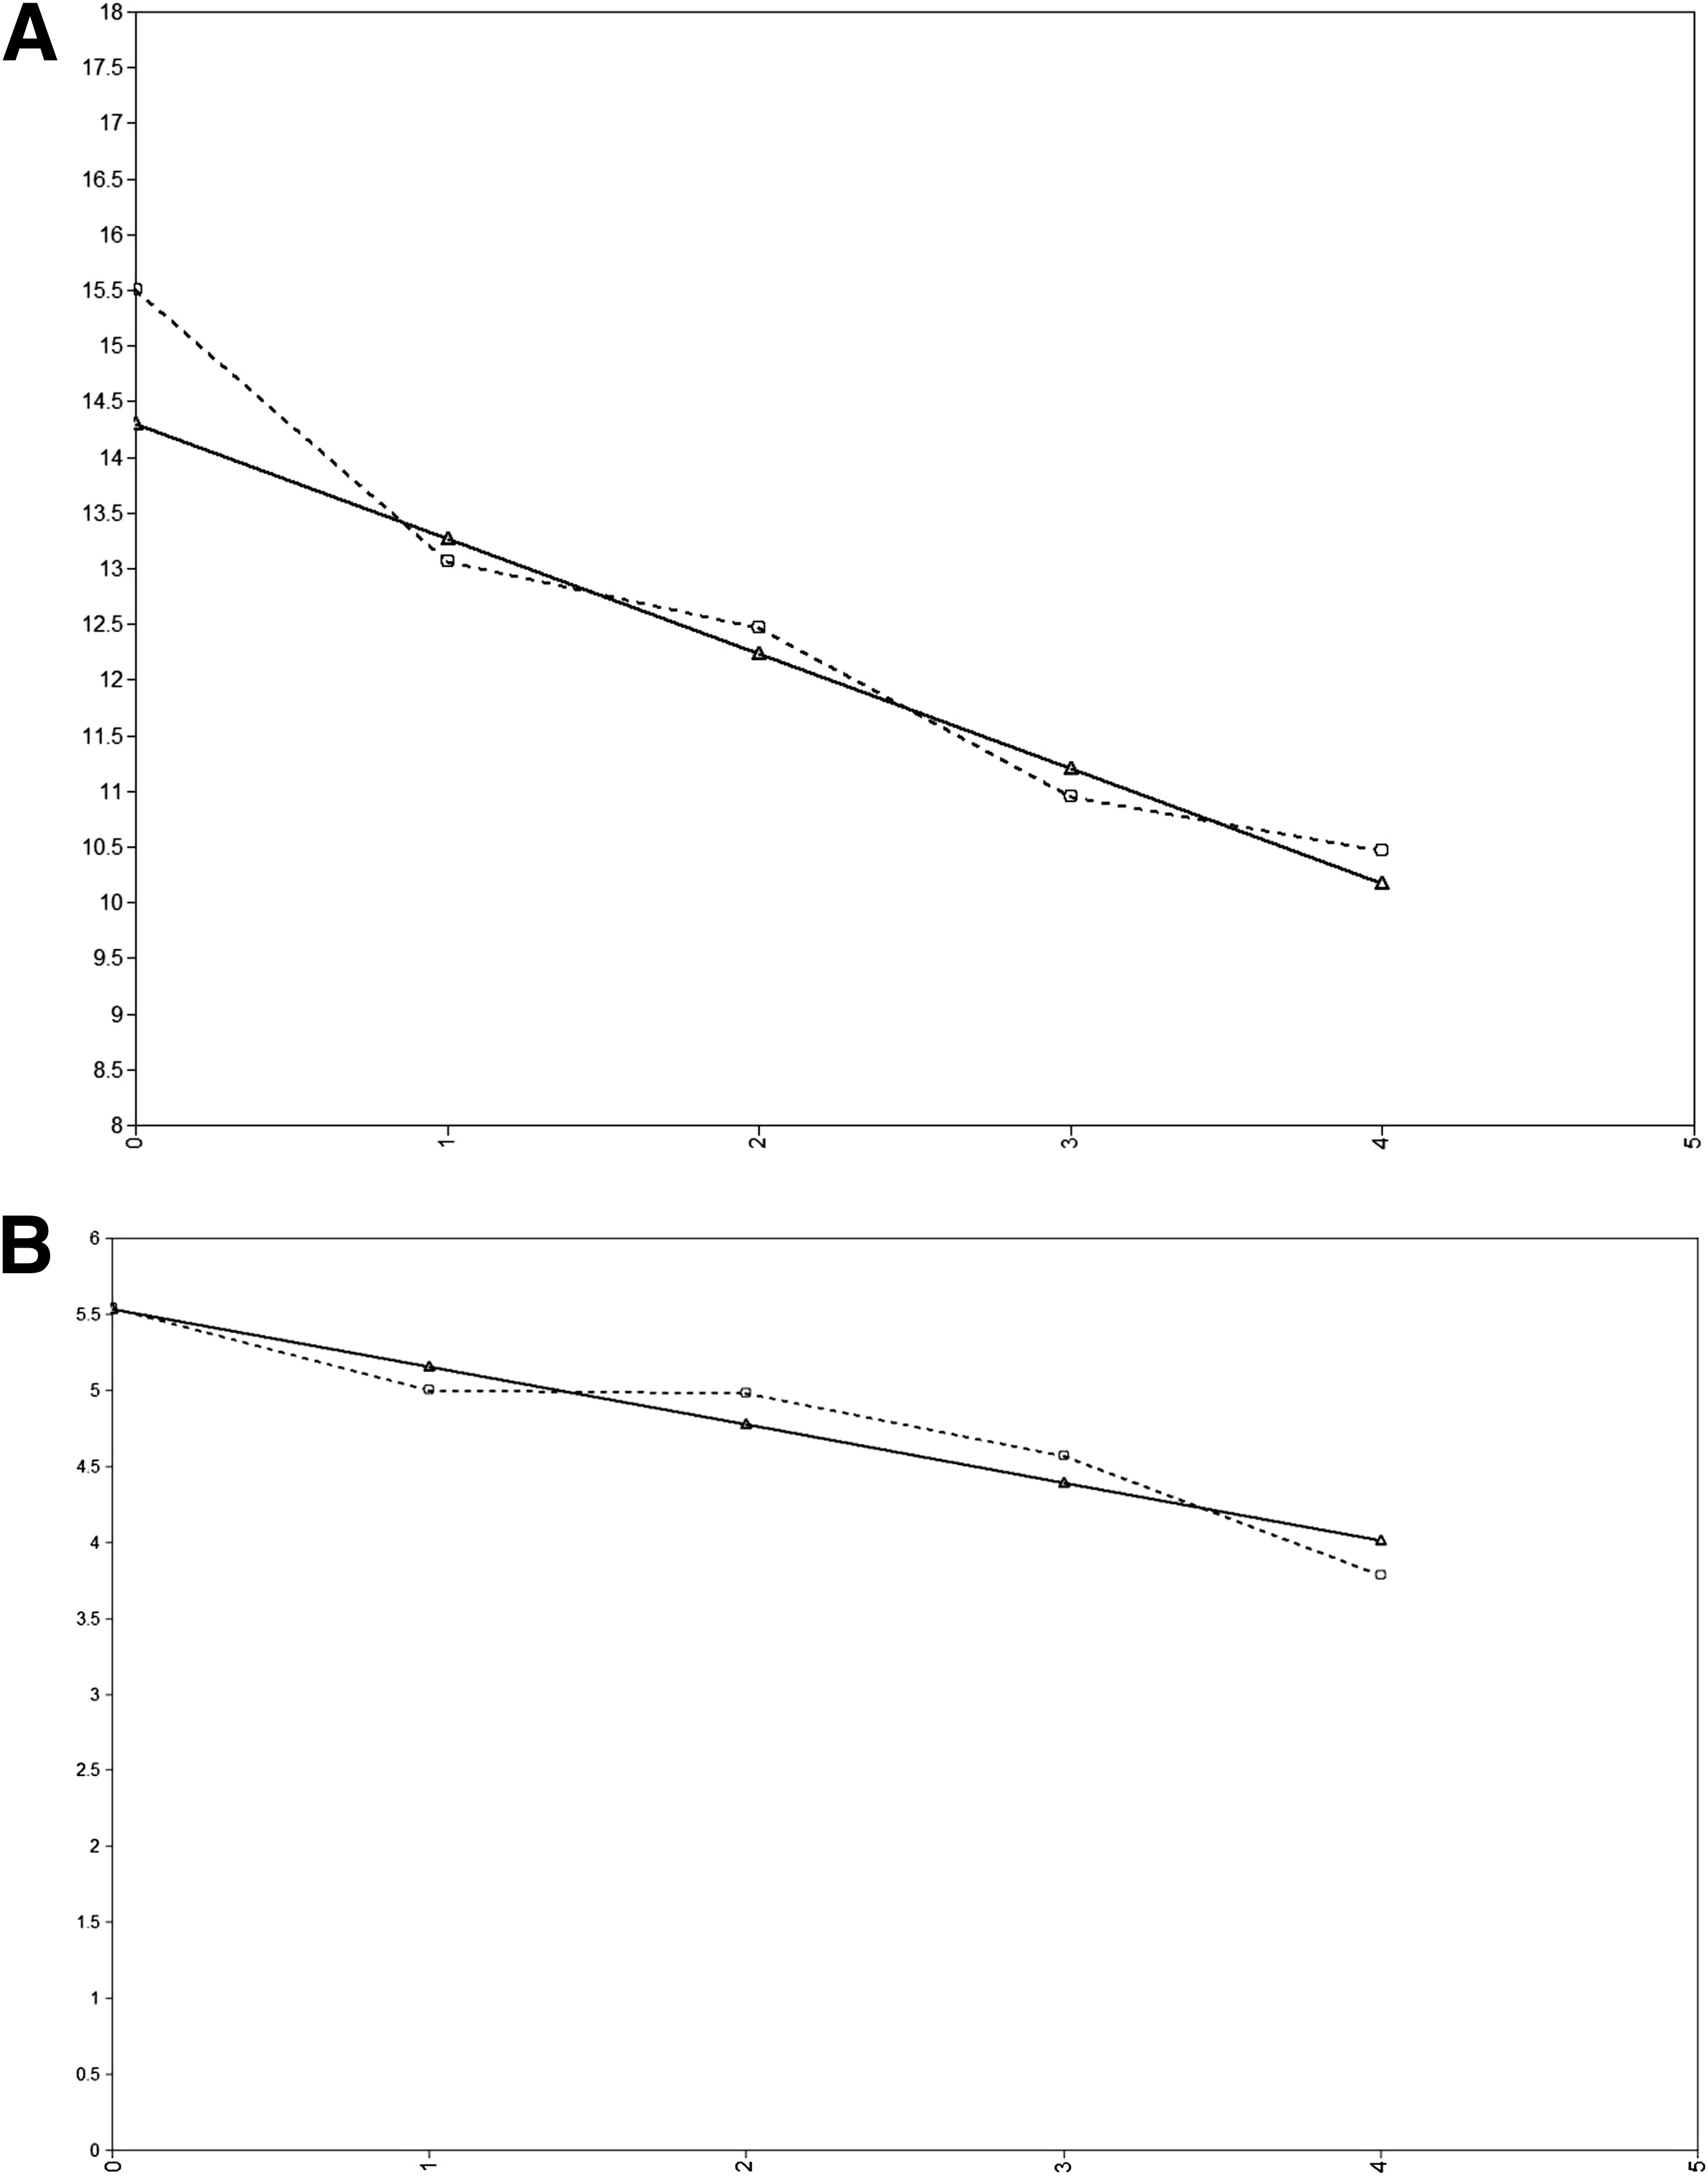
Figure 1
Table 2
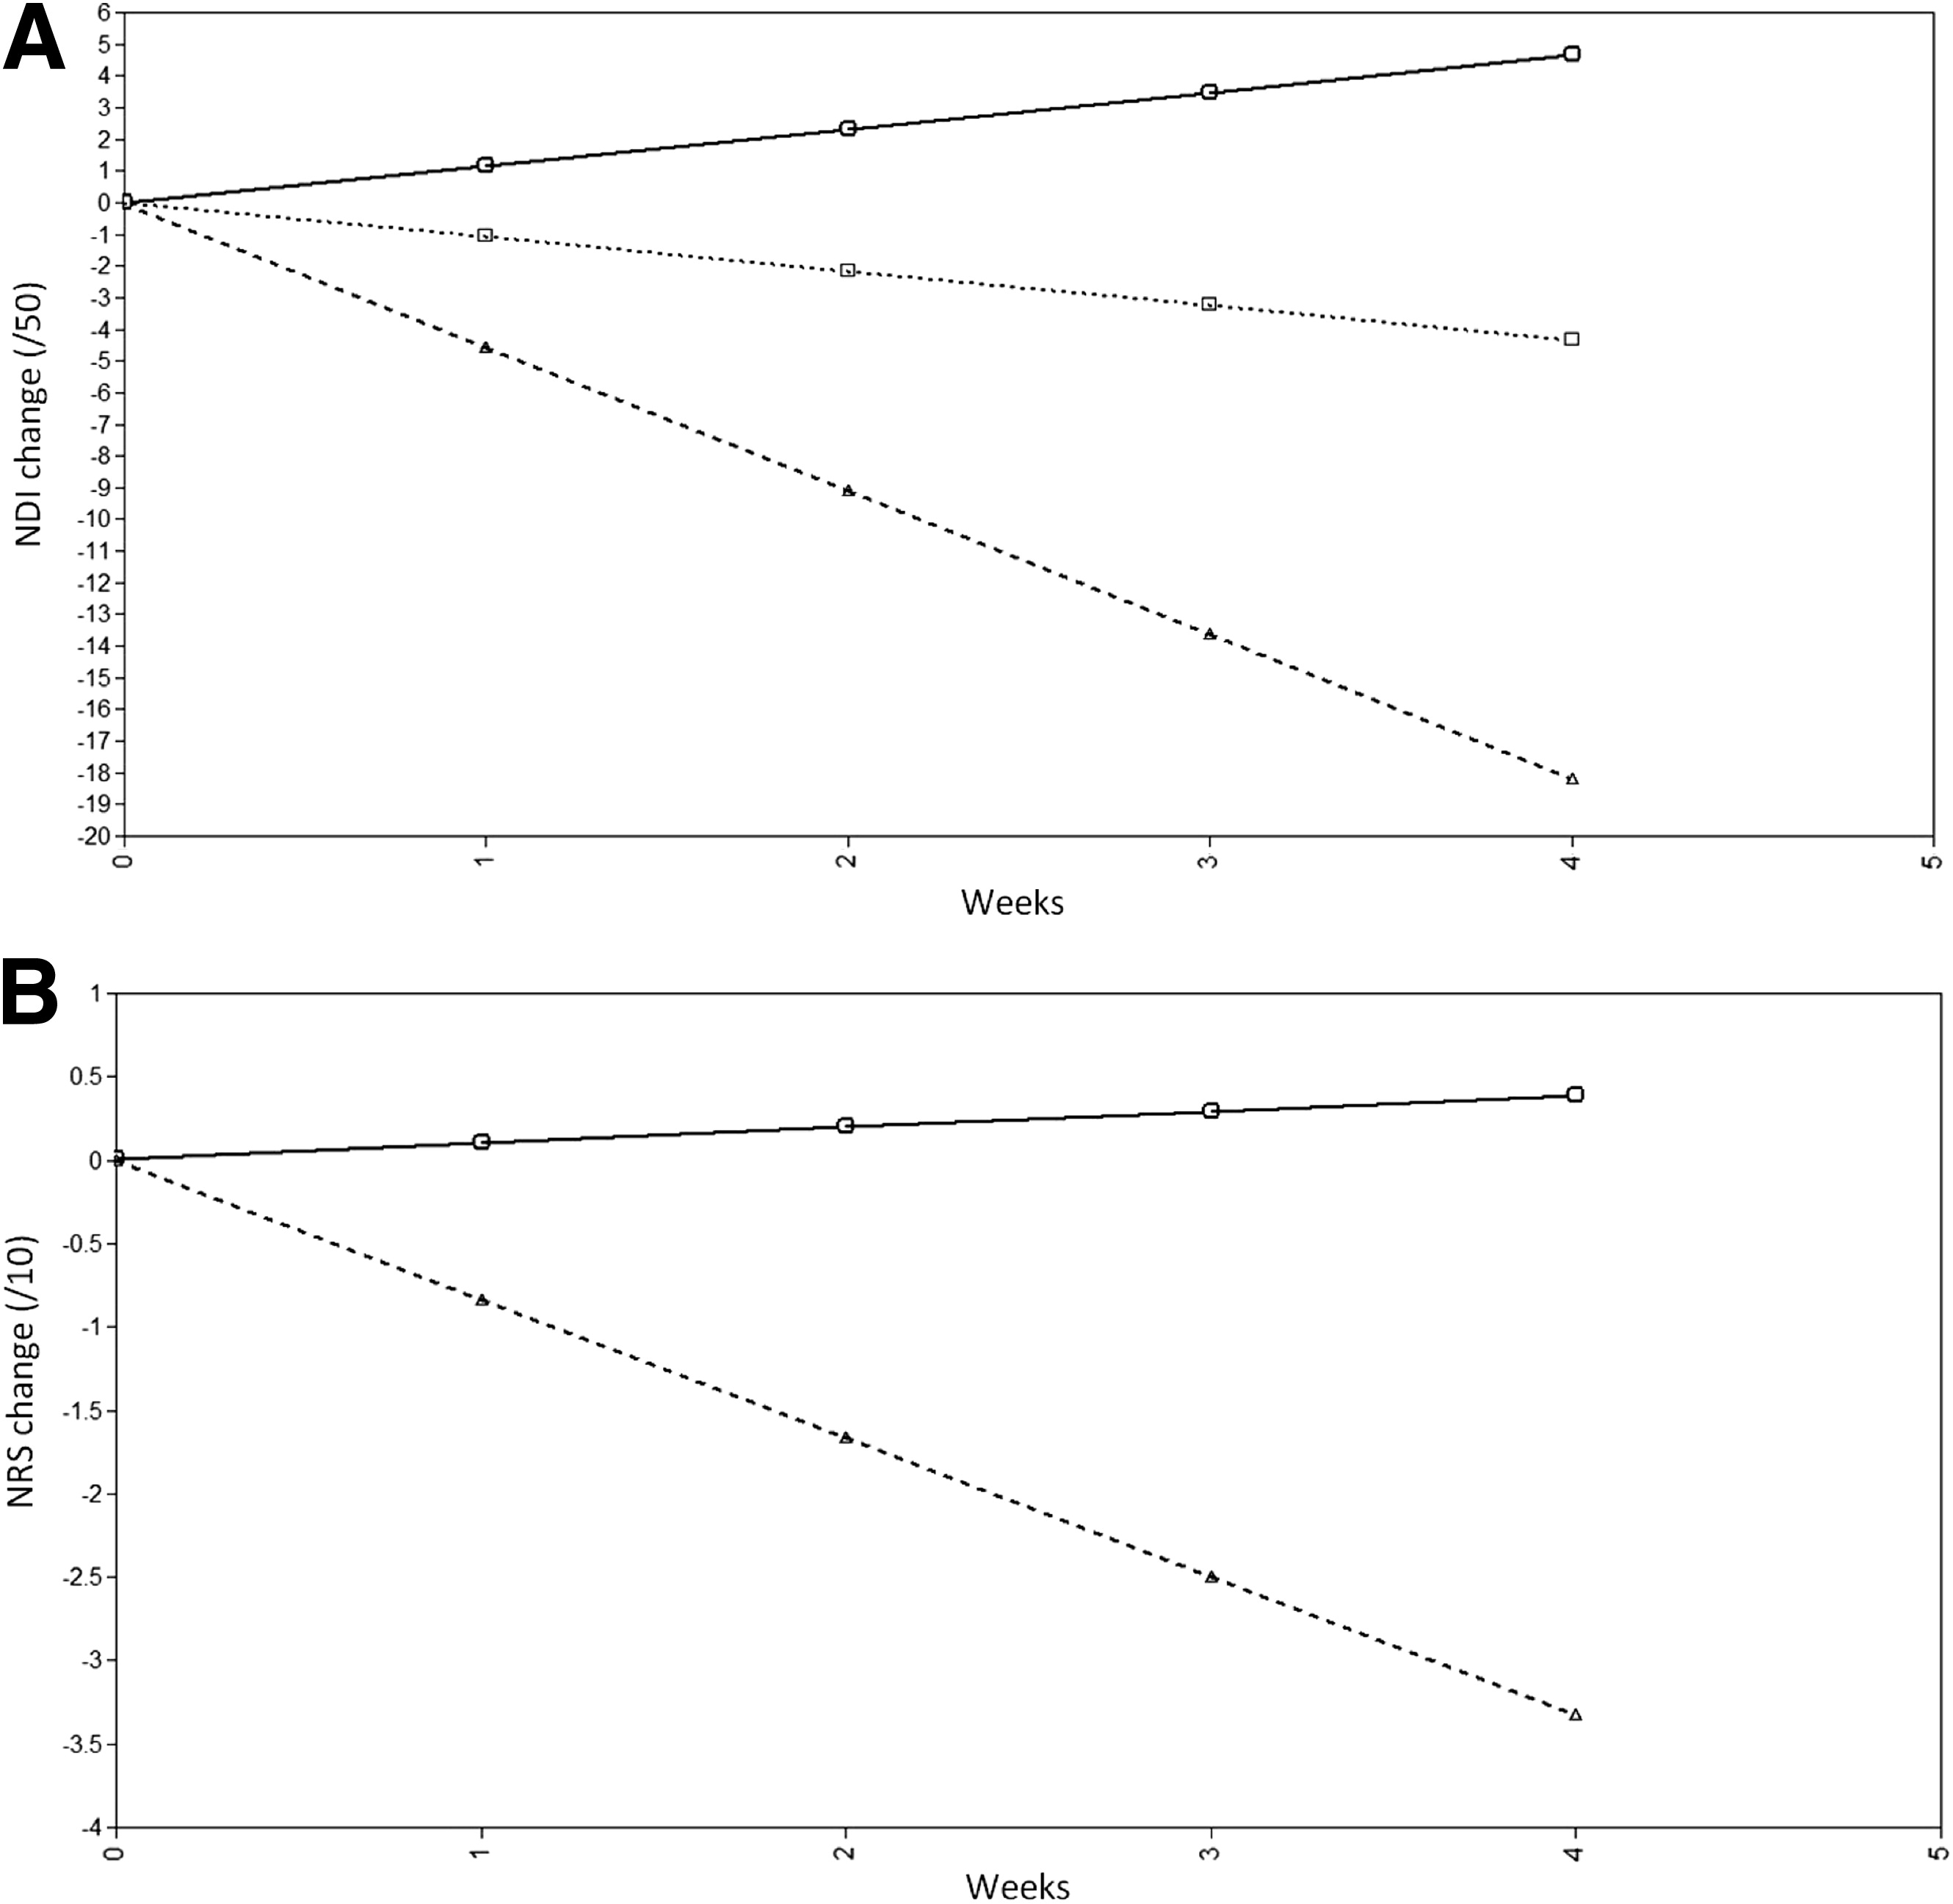
Figure 2
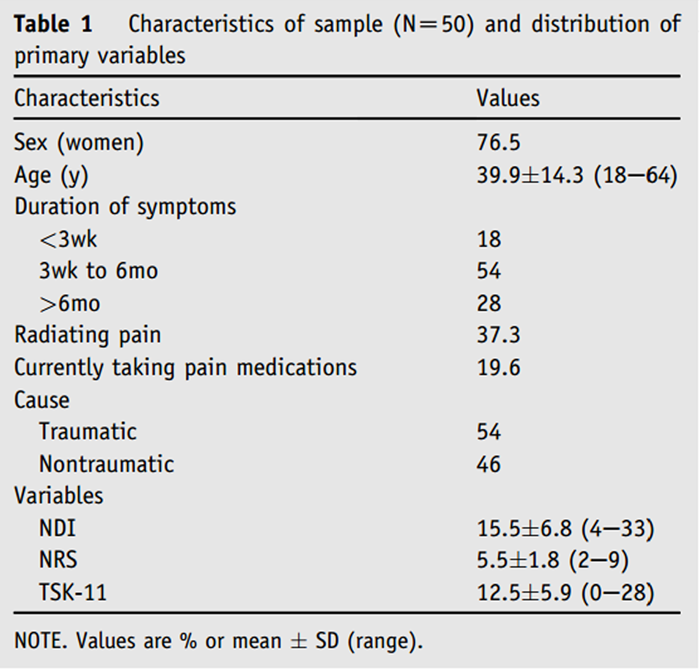
Table 3 Between January 2010 and January 2012, 50 subjects were enrolled and completed the study. Of the final 50, 1 subject was lost to follow-up after 2 weeks (providing 3 of 5 data points), and 1 additional was lost after 3 weeks (providing 4 of 5 data points). Table 1 presents the descriptive statistics of the final sample and distributions of the primary variables.
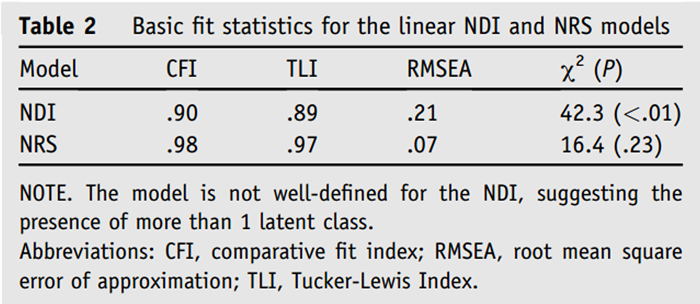
Mean NDI at baseline was 15.5±6.8, improving to 10.7±8.3 after week 4 (P<.01). Mean NRS at baseline was 5.5±1.8, improving to 4.0±2.4 after week 4 (P<.01). Figure 1 shows the duration-controlled observed and estimated trajectories of the main outcomes (NDI, NRS). The quadratic term was not significant in both cases, so a linear model was used for all subsequent analyses. The duration-controlled mean linear slope of the trajectories (change per week) over the first 4 weeks of treatment was –1.5 points/wk for the NDI and –0.5 points/wk for the NRS. Significant variance was present in both slopes (P<.01 NDI, P=.02 NRS). Basic fit indicators for the 2 curves are shown in Table 2.
LCGA revealed 3 meaningful trajectories from the NDI data that provided the best fit indices (BIC=980.5; entropy, .94). Figure 2A presents the results graphically.The first class, representing 14.5% of the sample, worsened slowly but significantly over the 1-month period (slope, 1.2 points/wk; 95% confidence interval [CI], 0.3–2.1 points/wk).
The second class, representing 19.6% of the sample, showed a significant and rapid improvement over the 1-month period (slope, –4.5 points/wk; 95% CI, –4.1 to –4.9 points/wk).
The third and largest class, representing 65.8% of the sample, showed a slow but significant improvement over the 1-month period (slope, –1.1 points/wk; 95% CI, –0.8 to –1.4 points/wk).The absolute sample size of the 2 smaller classes (n=7 and n=10, respectively) prevented prudent statistical analyses of between-group differences. For descriptive purposes, Table 3 provides the mean values and frequencies of the 3 classes for each baseline predictor variable.
LCGA revealed 2 meaningful trajectories from the NRS data (BIC=626.1; entropy, .82) (Figure 2B).Class 1, representing 48% of the sample, showed a small but nonsignificant positive slope, indicating general stability over the 1-month period (slope, 0.1 points/wk; 95% CI, –0.1 to 0.3 points/wk).
Class 2, representing 52% of the sample, showed a significant negative slope, indicating improvement over the 1-month period (slope, –0.8 points/wk; 95% CI, –0.7 to –1.0 points/wk).The number of subjects in each class (n=24 and n=26, respectively) permitted cautious comparison of between-class differences (see table 3). Of the variables compared, none showed a significant ability to predict class membership.
Discussion
The purpose of this exploratory study was to longitudinally describe the clinical course of mechanical neck pain during 1 month of usual-care outpatient physical therapy treatment. This was intended as a hypothesis-generating rather than confirmatory exercise and to provide guidance for future clinical trials of nonmedical neck pain management. We have shown that the trajectory, on average, in our sample of 50 subjects with mechanical neck pain of varying cause and duration, suggests an improvement of roughly 1.5 NDI points and 0.5 NRS points per week that adequately approximates a linear curve. In showing a mean linear trend over the course of 1 month, clinical trialists can be confident that a 1-month follow-up period is neither too short to identify measurable change, nor too long to risk missing early, rapid change. Assuming a clinically important difference of approximately 5 points on the NDI [12] and 1.5 points on the NRS, [13] our results would suggest that on average, rehabilitation therapists can expect to see clinically important change between 3 and 4 weeks after initiating treatment.
We have explored the clinical course in further depth to identify 3 trajectories of change in NDI score and 2 trajectories in NRS score. This holds considerable relevance for the design of clinical trials. Among our sample of 50 participants, most (approximately two thirds) improved in their NDI score at a rate of 1.1 points/wk, approximating the overall sample mean. However, as noted, 2 additional trajectories could be identified.Approximately 1 in 5 participants improved rapidly.
Conversely, approximately 1 in 7 participants actually worsened.
Similarly, 2 trajectories were clearly identifiable within the overall slope
for pain intensity NRS, with roughly half of the participants in each class.
One trajectory saw a gradual improvement, while the second class was
largely stable over the 1-month treatment period.Given the nature of the observational design, we stop short of suggesting it was the treatment itself, rather than the passage of time, that led to the change. However, it appears that people with mechanical neck pain change at different rates over the course of 1 month of physical therapy treatment.
Despite collecting 12 different potential predictor variables, none were significantly different between the 2 NRS trajectories. Readers should recognize that even at 24 and 26 subjects, respectively, the sizes of the samples in the 2 classes may have been too small to identify a difference. The comparisons between NDI classes will be described cautiously, recognizing that the differences may not be true (significant) differences.
Of note is that of the 10 subjects in the rapid improvement trajectory, only 1 had symptoms present for greater than 6 months, and none were taking medications to manage their pain at inception. This group also showed the lowest mean number of pain locations on the body diagram, and had a notably higher NDI score than the slow improvement group.
Of the 7 in the worsening trajectory, 4 described radiating symptoms to the arm, and 5 described a traumatic cause for their symptoms. This group also had the highest mean TSK-11 value, but we cannot comment on whether this was statistically greater than the other 2 groups. All of these findings provide interesting directions for future research.
We have provided enough data in our results to allow the formal calculation of sample size for future, hypothesis-testing research. As an illustrative example, a research team may be interested in testing the hypothesis that NDI trajectory can be predicted by fear of movement/aversion to exercise, as measured by the TSK-11. Using the distributions presented here, we calculate a pooled SD of 5.8. [14] Assuming that the relative proportions of each group are consistent with our findings (14.5%, 19.6%, 65.8%), and desiring 80% power and an alpha error probability of .05, a fully powered study would require 138 total subjects to adequately run this comparison with confidence in the findings. [15]
Study limitations
In terms of limitations, confounding variables are likely present that were not captured. The change seen here cannot be confidently attributed to the physical therapy intervention beyond the simple passage of time. At the design stage of this study, we could not have predicted the number of trajectory classes that would have been identified or the relative proportions of participants in each. As a result, it was impossible to accurately predict the required sample size, leading to samples in 2 of the 3 NDI trajectories that are too small to conduct prudent statistical analyses. Heterogeneity in the sample, while improving external validity, threatens internal validity and may introduce other biases.
An additional limitation stems from the recruitment of subjects: the sample was composed of the first 50 patients who consented to participate in the study. While nonconsenters were rare, there were some, and unfortunately data on those subjects were not collected because it was clinically unfeasible. Therefore, it is possible that those who consented to participate were systematically different in some important way from those who did not consent. While the characteristics of our sample are generally in keeping with those of the target population, [16] we cannot say with confidence that no selection bias has been introduced. We have tried to be transparent in these limitations when discussing the results and urge readers to consider this study hypothesis-generating rather than confirmatory.
Conclusions
In summary, we can draw 3 key messages from this study that are of relevance to clinicians and researchers. The first is that in our sample of 50 subjects, neck pain and disability improved at an average linear rate of approximately 1.5 NDI points and 0.5 NRS points per week over the course of 1 month that includes physical therapy treatment. Importantly however, within that mean trajectory, there may be up to 3 different trajectories of NDI change and 2 for NRS change that support the notion that mechanical neck pain, and change thereof, is a heterogeneous condition. Finally, it may be possible to identify variables early in the rehabilitation process that predict the trajectory that a patient is most likely to take, but in order to achieve an appropriate sample size in the smaller of the 2 NDI trajectories, a larger sample size is required.
Acknowledgments
We thank Andrew Lefebvre, PT, Cheryl Richardson, PT, and Darcy Reynolds, PT,
for their help in providing treatment and collecting data.
References:
Croft, P.R., Lewis, M., Papageorgiou, A.C. et al.
Risk factors for neck pain: a longitudinal study in the general population.
Pain. 2001; 93: 317–325Gross, A.R., Hoving, J.L., Haines, T.A. et al.
Manipulation and mobilisation for mechanical neck disorders.
Cochrane Database Syst Rev. 2004; : CD004249Teasell, R.W., McClure, J.A., Walton, D. et al.
A research synthesis of therapeutic interventions for whiplash-associated
disorder (WAD): part 4—noninvasive interventions for chronic WAD.
Pain Res Manag. 2010; 15: 313–322Sterling, M., Hendrikz, J., and Kenardy, J.
Compensation claim lodgement and health outcome developmental trajectories
following whiplash injury: a prospective study.
Pain. 2010; 150: 22–28Jensen, M.P., Karoly, P., and Braver, S.
The measurement of clinical pain intensity: a comparison of six methods.
Pain. 1986; 27: 117–126Vlaeyen, J.W., Kole-Snijders, A.M., Boeren, R.G., and van Eek, H.
Fear of movement/(re)injury in chronic low back pain and its relation
to behavioral performance.
Pain. 1995; 62: 363–372Vernon, H. and Mior, S.
The Neck Disability Index: A Study of Reliability and Validity
J Manipulative Physiol Ther 1991 (Sep); 14 (7): 409–415Walton, D. and Elliott, J.
A higher-order analysis supports use of the Tampa Scale for Kinesiophobia
11-item version in people with neck pain.
Phys Ther. 2013; 93: 60–68Vernon, H.
The Neck Disability Index: State-of-the-Art, 1991-2008
J Manipulative Physiol Ther 2008 (Sep); 31 (7): 491–502Jung, T. and Wickrama, K.A.S.
An introduction to latent class growth analysis and growth mixture modeling.
Soc Personal Psychol Compass. 2008; 2: 302–317Nylund, K., Asparouhov, T., and Muthén, B.
Deciding on the number of classes in latent class analysis and growth
mixture modeling: a Monte Carlo simulation study.
Struct Equ Modeling. 2007; 14: 535–569MacDermid, J.C., Walton, D.M., Avery, S. et al.
Measurement properties of the Neck Disability Index: a systematic review.
J Orthop Sports Phys Ther. 2009; 39: 400–417Cleland, J.A., Childs, J.D., and Whitman, J.M.
Psychometric properties of the Neck Disability Index and numeric pain
rating scale in patients with mechanical neck pain.
Arch Phys Med Rehabil. 2008; 89: 69–74Ghahramani, S.
Fundamentals of probability, with stochastic processes. 3rd ed.
Pearson, ; 2004Faul F. G*Power v3.1.2. Kiel (Germany):
Universitat Kiel; 2009. Available at:
http://www.psycho.uni-duesseldorf.de/abteilungen/aap/gpower3/
download-and-register
Accessed February 2010.Hogg-Johnson, S., van der Velde, G., Carroll, L.J. et al.
The Burden and Determinants of Neck Pain in the General Population:
Results of the Bone and Joint Decade 2000–2010 Task Force
on Neck Pain and Its Associated Disorders
J Manipulative Physiol Ther. 2009 (Feb); 32 (2 Suppl): S46–S60
Return to WHIPLASH
Return to CHRONIC NECK PAIN
Since 5-29-2016

| Home Page | Visit Our Sponsors | Become a Sponsor |
Please read our DISCLAIMER |