

A Comparison of Five Low Back Disability Questionnaires:
Reliability and ResponsivenessThis section is compiled by Frank M. Painter, D.C.
Send all comments or additions to: Frankp@chiro.org


FROM: Physical Therapy 2002 (Jan); 82 (1): 8–24 ~ FULL TEXT
OPEN ACCESS Megan Davidson, Jennifer L Keating
School of Physiotherapy,
La Trobe University,
Bundoora, 3053, Melbourne, Australia.
BACKGROUND AND PURPOSE: The aim of this study was to examine 5 commonly used questionnaires for assessing disability in people with low back pain. The modified Oswestry Disability Questionnaire, the Quebec Back Pain Disability Scale, the Roland-Morris Disability Questionnaire, the Waddell Disability Index, and the physical health scales of the Medical Outcomes Study 36-Item Short-Form Health Survey (SF-36) were compared in patients undergoing physical therapy for low back pain.
SUBJECTS AND METHODS: Patients with low back pain completed the questionnaires during initial consultation with a physical therapist and again 6 weeks later (n=106). Test-retest reliability was examined for a group of 47 subjects who were classified as "unchanged" and a subgroup of 16 subjects who were self-rated as "about the same." Responsiveness was compared using standardized response means, receiver operating characteristic curves, and the proportions of subjects who changed by at least as much as the minimum detectable change (MDC) (90% confidence interval [CI] of the standard error for repeated measures). Scale width was judged as adequate if no more than 15% of the subjects had initial scores at the upper or lower end of the scale that were insufficient to allow change to be reliably detected.
RESULTS: Intraclass correlation coefficients (2,1) calculated to measure reliability for the subjects who were classified as "unchanged" and those who were self-rated as "about the same" were greater than.80 for the Oswestry and Quebec questionnaires and the SF-36 Physical Functioning scale and less than.80 for the Waddell and Roland-Morris questionnaires and the SF-36 Role Limitations-Physical and Bodily Pain scales. None of the scales were more responsive than any other.
DISCUSSION AND CONCLUSION: Measurements obtained with the modified Oswestry Disability Questionnaire, the SF-36 Physical Functioning scale, and the Quebec Back Pain Disability Scale were the most reliable and had sufficient width scale to reliably detect improvement or worsening in most subjects. The reliability of measurements obtained with the Waddell Disability Index was moderate, but the scale appeared to be insufficient to recommend it for clinical application. The Roland-Morris Disability Questionnaire and the Role Limitations-Physical and Bodily Pain scales of the SF-36 appeared to lack sufficient reliability and scale width for clinical application.
Key Words: Disability, Low back pain, Measurement, Questionnaire.
From the FULL TEXT Article:
Background
The restoration of normal function is considered a key outcome of physical therapy for low back problems. [1, 2] Physical therapists, therefore, need measurement tools that accurately assess function and monitor change over time. Activity limitations are defined in the World Health Organization's International Classification of Functioning, Disability and Health [ICIDH-2] as “difficulties an individual may have in executing activities.” [3] Impairments such as decreased range of movement and reduced straight leg raise can be observed by therapists. However, direct observation of activity limitation is impractical, and physical therapists often rely on clients' self-report to assess the impact of low back pain on daily activities. Physical therapists routinely collect information on activity limitations in the course of their assessments, but the data may not always be collected in a standardized format that yields a measurement with known reliability and validity. [4, 5] Standardized self-report questionnaires provide a convenient method of collecting and synthesizing a large amount of information on activity limitation. [1, 2]
Many questionnaires have been developed to measure activity limitations in people with low back pain, but there is little evidence that physical therapists routinely use these tools. One of the barriers to their widespread clinical use is the proliferation of similar questionnaires. [1, 6, 7] A search of MEDLINE and CINAHL databases, the reference lists of retrieved articles, and published compilations of outcome measures located 24 low back region-specific questionnaires. There are also a number of generic health status measures available. Region-specific questionnaires for low back pain are thought to have the advantage of containing only items that are relevant to people with low back problems, whereas generic tools can be used across a wide range of conditions.
In the study reported in this article, we judged a questionnaire as having potential clinical utility if it could be self-administered, was brief and easy to complete, was simple to score, and had not been shown to have serious floor or ceiling effects in a general ambulatory clinical population. We also wanted the questionnaire to have adequate content validity (ie, relevant ICIDH-2 categories were represented) and evidence of credible construct validity and good reliability. Five questionnaires met these criteria: the modified Oswestry Disability Questionnaire, [8, 9] the Quebec Back Pain Disability Scale, [10] the Roland-Morris Disability Questionnaire, [11] the Waddell Disability Index, [12] and the physical health scales of the Medical Outcomes Study 36-Item Short-Form Health Survey (SF-36). [13, 14] We limited the study to 5 questionnaires because we estimated that the questionnaires would take up to 30 minutes to complete and we felt this was the most we could expect from respondents. The SF-36 questionnaire was chosen because it is relatively brief compared with other generic questionnaires and normative data are available in many countries. [15, 16] In addition, we believe that if a generic questionnaire can be shown to perform as well as a condition-specific questionnaire, then it becomes redundant to use both condition-specific and generic questionnaires. The selected questionnaires have also been identified by other authors [1, 2, 10, 17–19] as suitable for use in physical therapist practice. Scores have been shown to be correlated with related variables such as pain intensity and physical impairments and have also been demonstrated to detect change in functioning over time. [10, 18, 20–22]
It is important that the measurement properties of questionnaires are derived from or confirmed on samples from the population on whom the measurements will be used in clinical practice. [14, 23] This is particularly the case for studies of reliability and responsiveness because the results of these studies provide the information required for interpreting the scores of individuals. Client groups receiving the services of other health care professionals (eg, orthopedic surgeons) are unlikely to be representative of the population receiving physical therapy. Much of the information currently available on the reliability of measurements obtained with and responsiveness of the 5 questionnaires is from studies that drew samples from clinical populations other than patients receiving physical therapy, [8, 9, 11, 12, 14, 24] from only 1 or 2 physical therapy practices or hospital departments, [17, 18, 25] or from both physical therapy and medical treatment centers. [10]
Little information is currently available on the reliability of measurements obtained with and responsiveness of the Quebec and Waddell questionnaires, and no studies have demonstrated the reliability of measurements obtained with and responsiveness of these 5 questionnaires when concurrently administered to clients receiving treatment from physical therapists in a range of clinical settings. The aim of this study, therefore, was to compare the reliability of measurements obtained with and responsiveness of the modified Oswestry, Quebec, Roland-Morris, and Waddell questionnaires and the SF-36 physical health scales in an ambulatory clinical population seeking physical therapy for low back pain in hospital outpatient departments, community clinics, and private practices.
High test-retest reliability coefficients have generally been reported for the scores obtained with the 5 questionnaires. For the original Oswestry questionnaire, values of r=.99 over 24 hours [8] and ICC=.94 over 1 to 14 days [10] are typical. Baker et al [9] reported a reliability coefficient of r=.89 for a same-day test-retest of the modified Oswestry questionnaire. Kopec and colleagues [10] reported the test-retest reliability for measurements obtained with the Quebec scale as ICC (2,1)=.93 over 1 to 14 days. For the Roland-Morris questionnaire, reported reliability estimates ranged from .91 for same-day administration, [11] ICC=.93 for 1 to 14 days, [10] and ICC=.86 over 3 to 6 weeks. [25] No test-retest reliability studies have been reported for the Wadde [11] index, although one research group [12] reported interrater reliability (kappa >.60) for each of the 9 questions administered by interview. For the Physical Functioning scale of the SF-36, Kopec and colleagues [10] reported an ICC=.73 over 1 to 14 days. Patrick et al [22] reported ICCs of .89, .89, and .67 for the SF-36 Physical Functioning, Role Limitations–Physical, and Bodily Pain scales, respectively, over a period of 3 months. In those studies where test-retest reliability was evaluated over longer periods, only data from subjects who were classified as “unchanged” based on patient ratings [10, 22] or patient and therapist ratings on a retrospective change scale [25] were included.
The reliability coefficient reported as a value between 0 and 1 does not allow us, in our view, to judge whether the measurement has sufficient reliability for a particular purpose. To examine the effects of intervention, a therapist needs to know when change in an observed score indicates that real change has occurred. This is called the “minimum detectable change” (MDC) and has been defined by Stratford et al [17] as the amount of change required to be 90% confident that an observed change in scores reflects real change in the underlying variable. Stratford and colleagues [17, 25] have reported the MDC for the Roland-Morris questionnaire as 4 to 5 points. No authors have reported the MDC for the modified Oswestry, Quebec, and Waddell questionnaires or the SF-36 physical health scales.
No improvement can be detected for an individual who has the best possible score prior to treatment, and no worsening can be detected for an individual who has the worst possible score on a particular scale. The lowest and highest possible scores are called the “floor” and “ceiling” of the scale. McHorney and Tarlov [26] suggested that health surveys with more than 15% of respondents scoring the lowest or highest possible score initially should not be used. However, because we believe an observed change in scores must be at least equal to the MDC to be 90% confident that the observed change is not simply due to measurement error, we propose that questionnaires with more than 15% of respondents scoring within the MDC at the upper or lower end of the available range of scores should not be used. For example, we believe that if a questionnaire has a possible range in scores from 0 to 100 and an MDC of 15 points, then no more than 15% of subjects should score less than 15 or more than 85. In this way, the MDC can be useful not only for interpreting change in questionnaire scores but also for providing a benchmark for choosing a measurement tool that is practical for use with a particular clinical population. In this article, we use the term “scale width” to indicate the capacity of a scale to have initial scores that are far enough onto the scale to allow detection of change in scores over time.
Responsiveness refers to the ability of a measurement tool to detect meaningful change over time and is also called “sensitivity to change.” [23] Many methods have been proposed to explore the responsiveness of questionnaires, [27] and all involve the administration of the questionnaire before and after a period of time (usually when the participants are receiving treatment) during which it is expected that function will improve. Methods of exploring responsiveness can be classified either as those that measure change alone (distribution-based methods) or those that measure clinically meaningful change (criterion-based methods). [27, 28] Criterion-based methods require that a judgment be made as to whether clinically meaningful change has occurred over the retest period. This is often achieved by having the participants rate the overall amount of change they have experienced. [10, 20, 21, 25]
In 3 studies, [10, 20, 21] various combinations of questionnaires were administered to people who were receiving physical therapy, and the questionnaires' responsiveness was studied. The Oswestry and Roland-Morris questionnaires were compared by Stratford et al [21] in Ontario, Canada, and by Beurskens et al [20] in the Netherlands. Kopec et al [10] in Quebec, Canada, examined reliability of measurements from and responsiveness of the Oswestry, Quebec, and Roland-Morris questionnaires and the SF-36 Physical Functioning scale, but only 65% of the subjects were seen by physical therapists. In all 3 studies, the questionnaires were administered on 2 occasions, and a global change scale was used as the criterion for meaningful change. Direct comparison of these 3 studies is hampered by differences in subject characteristics, the use of different retest periods, differing interventions and global change scales, and the variety of strategies for classifying subjects as “changed” or “unchanged.”
Of these 3 studies, only Stratford and colleagues [21] tested whether there were differences in observed responsiveness between the questionnaires used in the study. The conclusions of the other groups of authors were based only on the rank order of the magnitude of the particular responsiveness index used. However, without statistical testing of the difference between questionnaires, it is not clear whether observed differences are likely to reflect genuine or chance variations. [27]
Method
This was a prospective, multi-site study with repeated measurements taken when subjects entered the study and 6 weeks later. Over a 5-month period, consecutive eligible patients were invited by their treating therapist to participate in the study. Patients were eligible if they were aged 18 years or older, were able to read and write English, were seeking treatment for a complaint of low back pain, and provided written informed consent. We defined low back pain as pain in the lumbar region with or without referral of pain to the lower extremities. Subjects were recruited from the physical therapy outpatient departments of 3 hospitals, 3 community health services, and 4 private physical therapy practices. The 10 health care agencies from which the subjects came represented, in our view, the range of settings where physical therapy services are delivered to patients with low back pain who were ambulatory and were located in urban areas of high, middle, and low socioeconomic status.
Subjects who consented to participate in the study were given a package of questionnaires at the recruitment site, with a reply paid envelope for returning the questionnaires by mail. After 6 weeks, a second set of questionnaires was sent by mail to the subjects. On both occasions, questionnaires were presented in random order as determined by a random numbers table. The battery of questionnaires were bundled together with a paper clip. The forms were scan-forms and therefore could not be stapled. Because completion of questionnaires was unsupervised, there was no way of knowing whether subjects completed the questionnaires in the order in which they were presented. A reminder was mailed if the second set of questionnaires was not returned within 10 days. A 6-week retest interval was chosen for both the reliability and responsiveness studies. We agree with other authors [22, 25] who contend that the variability in scores over a typical clinical retest period is more likely to reflect true variability in scores than that found with very short retest periods. We believe that 6 weeks is commonly used in practice as a time for comprehensive reassessment of patients with low back pain, particularly if they have not resumed their normal activities. [29, 30] The type and frequency of treatments applied to patients in this study were not under investigation. Subjects were recruited at the first or second consultation for their current episode of back pain, and the combination of treatment and the natural history of the condition constituted the “construct for change.” [11, 27] We anticipated, based on the results reported by van den Hoogen et al, [31] that many subjects would experience some improvement over a 6-week period.
Materials

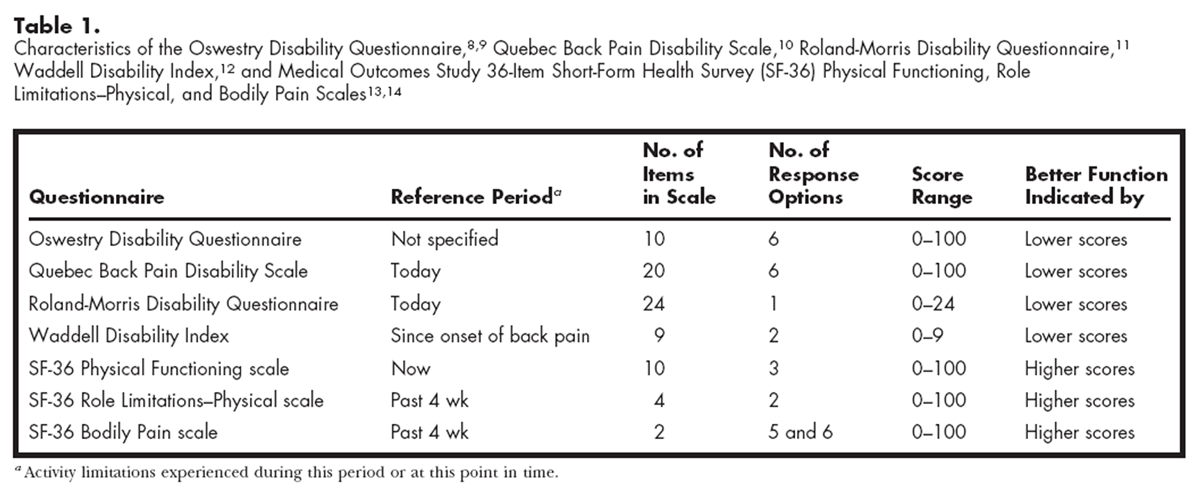
Table 1 We administered by mail 5 questionnaires that we believed were most likely to be useful in clinical practice. The modified version of the Oswestry Disability Questionnaire [9] does not include a reference to medications in the pain and sleeping sections and is therefore, in our view, more widely applicable, as not all patients will be taking medications. We used the original Roland-Morris Disability Questionnaire, [11] the final format of the Quebec Back Pain Disability Scale recommended by the developers, [10] the Waddell Disability Index wording from Delitto, [2] and the Australian version of the SF-36. [32] Characteristics of the 5 questionnaires are shown in Table 1.
< The Oswestry, Quebec, Roland-Morris, and Waddell questionnaires were all developed to measure activity limitation in people with low back problems and take only a few minutes to complete and score. Scores for the individual questions are summed to provide a single “index” score for each questionnaire, and higher scores indicate greater activity limitation. In contrast, the SF-36 is a generic health survey that is designed to assess health for any population and for any condition. [13–15] The SF-36 consists of 8 scales that provide a “profile” of scores, with higher scores indicating better health status. The 10-item Physical Functioning scale is used to measure activity limitations and so, to a lesser extent, does the 4-item Role Limitations–Physical scale and the 2-item Bodily Pain scale. The SF-36 takes about 10 minutes to complete, and a scoring algorithm is used to calculate scores. [32]
Questionnaire scores were calculated according to developers' instructions. For the Oswestry questionnaire, the sum of the section scores was divided by the total possible score (50 if all sections are completed), and the resulting total was multiplied by 100 to yield a percentage score. The Quebec questionnaire total score was calculated by summing the 20 individual item scores. The Roland-Morris questionnaire score was a count of the chosen items, and the Waddell questionnaire score was the sum of the “yes” responses. The scoring methods prescribed by the test developers were applied to the SF-36 Physical Functioning, Role Limitations–Physical, and Bodily Pain scales. [32]
In addition to the 5 questionnaires, demographic data and details of current and past medical history were also collected initially using the questionnaire designed for this study. At follow-up, a 7-level global change scale was included with the questionnaires. This scale asked subjects to rate the extent to which their back problem had changed over the past 6 weeks. The rating scale, previously used in a study by Patrick and colleagues, [22] had 7 response options: 1=“completely gone,” 2=“much better,” 3=“better,” 4=“a little better,” 5=“about the same,” 6=“a little worse,” and 7=“much worse.” Many scales have been used to rate global change, from a simple 3-level “better”/“the same”/“worse” scale [10] to a 15-level scale with 7 levels of improvement and worsening. [10, 17, 21] We decided to steer what we considered a middle course between a very parsimonious scale that lacked any distinction in the magnitude of change and a complex scale that subjects may have found difficult to interpret and complete without assistance. The selected rating scale had 4 levels for rating improvement but only 2 ratings of worsening. We believe this rating scale was appropriate for rating overall change for 2 reasons. First, there is no opposite of “completely gone,” yet complete resolution of the problem is the optimal patient outcome. Second, we expected that few subjects would report a worsening of their problem, and therefore an additional step between “a little worse” and “much worse” was unnecessary.
Data Analysis
Unless otherwise stated, statistical analyses were performed using SPSS for Macintosh Version 6.1.* Test-retest reliability was explored for a subgroup of patients who were identified post hoc as not changed by what we believed to be a clinically meaningful amount over the 6-week retest period. That is, we classified subjects who self-reported their condition as “about the same” or only “a little better” or “a little worse” as “unchanged.” A paired t test was also used to test the hypothesis that the questionnaire scores for the “unchanged” group at the 2 administrations were not different (P≤.05). Based on our experience and that of other authors, [20, 25] we believe that patients who report only a little change are unlikely to have experienced clinically meaningful change, which we defined as the smallest change in the domain of interest that can be considered significant. To check the validity of this assumption, we used a paired t test to check that scores for the subgroup who reported they were “a little better” were not different between the start of the study and follow-up.
Intraclass correlation coefficients (2,1) [33] were then calculated for each of the questionnaires. We used parametric tests because, with the exception of the SF-36 Role Limitations–Physical scale, the data were normally distributed or approached a normal distribution, and pretest and posttest variances were equivalent. The SF-36 Role Limitations–Physical scale scores were positively skewed at pretest and posttest for the “unchanged” group. It has been demonstrated, however, that even severely abnormal distributions have little effect on the result of the t test or the F test when the samples come from the same population, and violation of the homogeneity of variance assumption has little effect on the result provided the sample sizes are the same. [34] To check the validity of measurements obtained with our post hoc method of identifying a stable group of subjects, we calculated ICCs for another group of subjects, those with back pain of more than 6 months' duration, who a priori could be expected to experience little change over a 6-week retest period.
We defined the minimum detectable change as the 90% CI of the error associated with the repeated measurements. [17] First, the standard error of measurement (SEM) was determined by the formula:
(1)
where SDav was the average standard deviation of the scores initially and at follow-up for the 106 subjects who completed both sets of questionnaires and R was the test-retest reliability coefficient for the 47 subjects classified as “unchanged.” [35] The error associated with the repeated measurements was calculated by the formula:
(2)
and this step recognizes that there is error associated with both the first and second measurements. [36] The 90% CI (the MDC) was calculated by multiplying the result by 1.64 (the tabled z value). This calculation can be interpreted as the magnitude of change, expressed in scale points, required to be 90% confident that the observed change reflects real change and not just measurement error. [17]
Unless subjects score far enough onto the scale to allow change by at least as much as the MDC, there is insufficient scale width to reliably detect change over time. To evaluate scale width, we calculated for each questionnaire the proportion of the 140 subjects who returned the initial questionnaire who did not register an initial score that would allow at least that amount of improvement or worsening to be registered at follow-up.
Responsiveness was quantified in 3 ways. We used one distribution-based method (standardized response means [SRMs]), one criterion-based method (receiver operating characteristic [ROC] curves), and a method that counted the proportion of subjects who changed by at least as much as the MDC. The SRM was calculated by dividing the mean change by the standard deviation of change scores. [10, 20, 27, 37] We chose the SRM because a method of testing the significance of observed differences in SRMs has been described by Liang et al. [37] Confidence intervals were constructed using the “jackknife” method detailed by Liang et al, [37] and a paired t test was used to compare the estimated population SRMs derived by this method. [27, 37] Rather than compare the SRMs for questionnaires using every possible pair-wise comparison, we limited the number of comparisons by comparing the highest and lowest SRMs until nonsignificant comparisons occurred.
Criterion-based methods of evaluating responsiveness require that a judgment be made as to whether clinically meaningful change has or has not occurred. [27, 28] In this study, subjects were classified as having improved by an important amount if they rated their back problem as “completely gone,” “much better,” or “better” at posttest and as “unchanged” if they reported being “a little better,” “about the same,” or “a little worse.” Receiver operating characteristic curve analysis was performed using Accuroc Version 2.0.† The area under the ROC curve reflects the ability of the test to discriminate between subjects who have improved from subjects who are unchanged. [23, 27] A value of 1 for the area under the curve represents perfect (100%) accuracy, whereas a value of .50 represents chance alone. Accuroc uses a chi-square statistic to compare ROC curves for different questionnaires. Even without the Bonferroni adjustments for the multiple post hoc comparisons, there were no observed differences in area under the ROC curves among the different instruments. The 95% CIs of the areas under the ROC curves show the similarities among questionnaires.
The third method of evaluating responsiveness relates responsiveness to reliability and has not previously been used to compare concurrently administered questionnaires. Goldie and colleagues38 suggested that the proportion of subjects who improve by at least as much as the MDC could be used as an indicator of test responsiveness. We have termed this a reliable-change approach. We calculated the proportion of subjects who registered a change in questionnaire scores equal to or greater than the MDC. The standard error of the proportions (SEp) was calculated as:
(3)
where p is the observed proportion and n is the number of subjects. The observed proportion ±1.96 × SEp yields the 95% CI. [39] The Cochran Q test was used to determine whether the proportions were different among all of the questionnaires.
Results
Of 284 patients with a complaint of low back pain, 226 met the eligibility criteria to participate in the study, and 207 (92%) agreed to participate. One hundred forty participants (68%) returned the first set of questionnaires, and 106 participants (51%) returned the follow-up package 6 weeks later. Five subjects who completed both sets of questionnaires failed to complete the global change scale. The time taken to return the questionnaires at both pretest and posttest was a median of 8 days. There was no difference in age or sex between subjects who returned both sets of questionnaires and those who returned only the first set.
Table 2
Table 3
Table 4
Table 5 The mean change in scores for subjects in each of the 7 levels of the global change scale is shown in Table 2 for the 101 subjects who completed both sets of questionnaires and the global change scale. We classified the 47 subjects who reported that their back problem was “about the same,” “a little better,” or “a little worse” as “unchanged” and the 52 subjects who reported that their back problem was “better,” “much better,” or “completely gone” as “improved.” Sample characteristics for the “unchanged” and “improved” groups are shown in Table 3. The mean age of the “unchanged” group was 55 years (SD=17, range=19–83), and the mean age of the “improved” group was 49 years (SD=16, range=20–80) (t(97)=–1.87, P=.06).
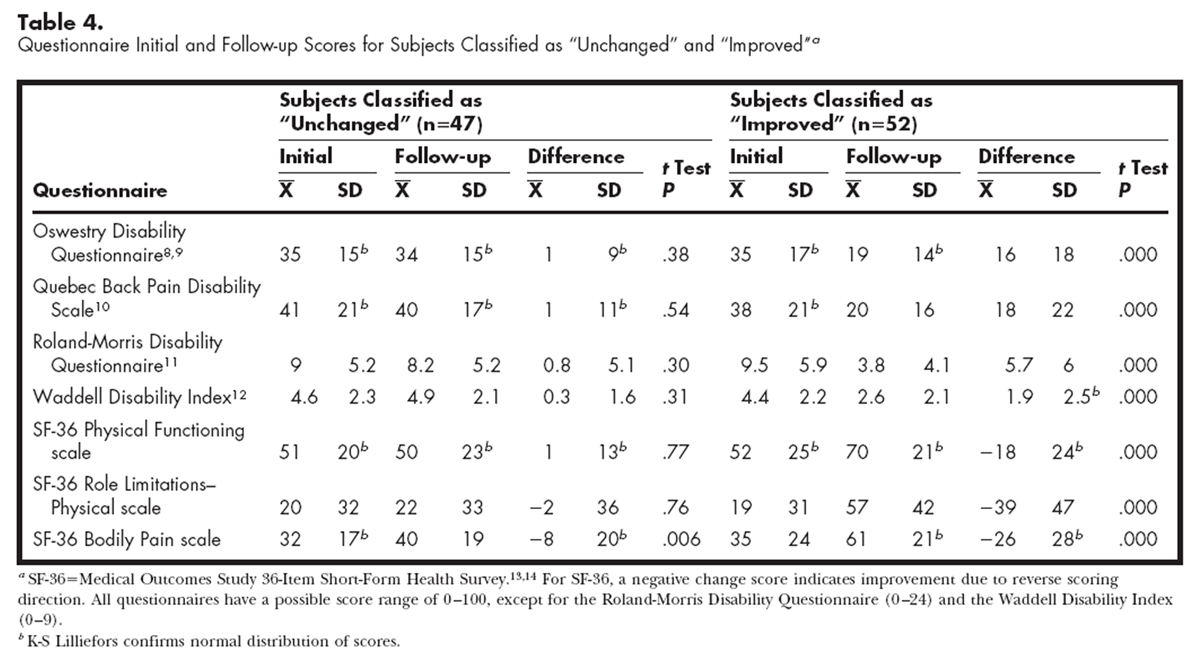
Questionnaire scores obtained when the study began and at follow-up for the “unchanged” and “improved” groups are shown in Table 4. For the “unchanged” group, normal distribution of scores when the study began and at follow-up was confirmed by the K-S Lilliefors test for the Oswestry and Quebec questionnaires and the SF-36 Physical Functioning scale initially and at follow-up and for the SF-36 Bodily Pain scale initially. The K-S Lilliefors test is the Kolmogorov-Smirnov statistic with a Lilliefors significance level for testing normality. [40] Data are normally distributed if the significance level is greater than .05. The K-S Lilliefors test is very sensitive to departures from normal distribution, so a visual inspection was also made of histograms and box plots of the data that did not meet the K-S Lilliefors standard. [40] Only the SF-36 Role Limitations–Physical scale data were extremely positively skewed, reflecting a large floor effect, with 68% of the subjects scoring the lowest (worst) possible score initially and 25% of the subjects scoring the lowest (worst) possible score at follow-up.
Table 4 shows that for the 47 subjects who were classified as “unchanged,” there was no difference between initial and follow-up scores on any questionnaire except the SF-36 Bodily Pain scale. Scores on this scale improved by an average 8 points (SD=20) over the retest period (t(46)=2.88, P=.006). For the 52 subjects classified as “improved,” all questionnaire scores were different at follow-up (P<.0001). Because the SF-36 Bodily Pain scale scores initially and at follow-up for the group classified as “unchanged” were different, we examined the subgroup of 28 subjects who said their problem was “a little better.” The SF-36 Bodily Pain scale scores improved by an average of 12 points (SD=22) over the retest period (t(27)=2.97, P=.006), but there were no differences between initial and follow-up scores for any of the other questionnaires. Because the SF-36 Bodily Pain scale score indicated that the subjects who rated themselves as “a little better” had changed, we calculated the ICC (2,1), SEM, SEMrepeat, and MDC for the subjects classified as “unchanged” and for the subgroup of 16 subjects who rated their problem as “about the same” at follow-up (Table 5). Scores initially and at follow-up for the 16 subjects were confirmed by the KS-Lilliefors test to be normally distributed, except for the SF-36 Role Limitations–Physical scale scores, which were positively skewed. Paired t tests confirmed that for all scales, the questionnaire scores were not different between the start of the study and follow-up.
The ICCs exceeded .80 for the Oswestry and Quebec questionnaires and the SF-36 Physical Functioning scale for the “unchanged” group of 47 subjects, and the ICCs for these questionnaires were higher than for the Roland-Morris questionnaire or the SF-36 Role Limitations–Physical or Bodily Pain scale (there was no overlap of 95% CIs for the reliability coefficients). The 95% CI for the Waddell questionnaire overlaps with those of all the other scales. Reliability coefficients for a group of 37 subjects with back pain of more than 6 months' duration were similar or identical to the coefficients for the group that was classified as “unchanged.”
For the subgroup of 16 subjects who rated themselves as “about the same,” the reliability coefficient for the Oswestry questionnaire was higher, based on the 95% CIs, than that obtained for the Roland-Morris questionnaire and the SF-36 Role Limitations–Physical scale. The reliability coefficient for the SF-36 Physical Functioning scale was higher than that obtained for the Roland-Morris questionnaire. The 95% CIs of the Roland-Morris questionnaire and the SF-36 Role Limitations–Physical and Bodily Pain scales were very wide (Tab. 5).
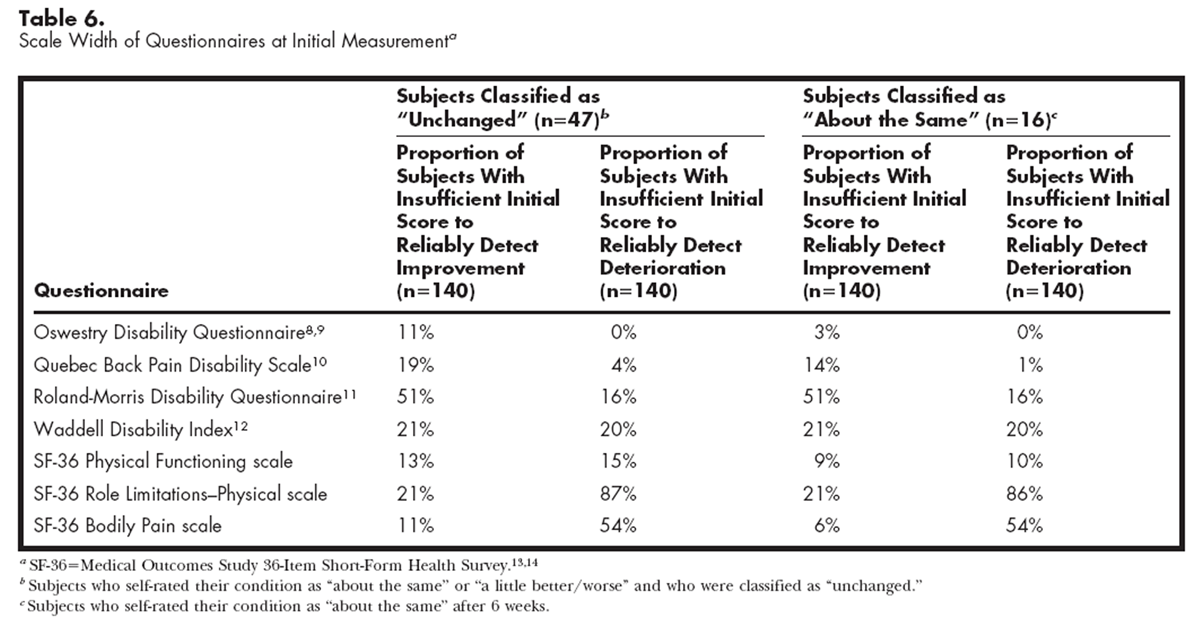
Table 6
Table 7 Scale width was calculated on the 140 subjects who completed initial questionnaires and is shown in Table 6 for the MDC calculated for the “unchanged” group and for the subgroup classified as “about the same.” The 15% criterion limit was met for the Oswestry questionnaire and the SF-36 Physical Functioning scale in both cases and for the Quebec questionnaire when the MDC for the subgroup was calculated. The SF-36 Role Limitations–Physical and Bodily Pain scales would be unable to detect worsening over time in 87% and 54% of the subjects, respectively.
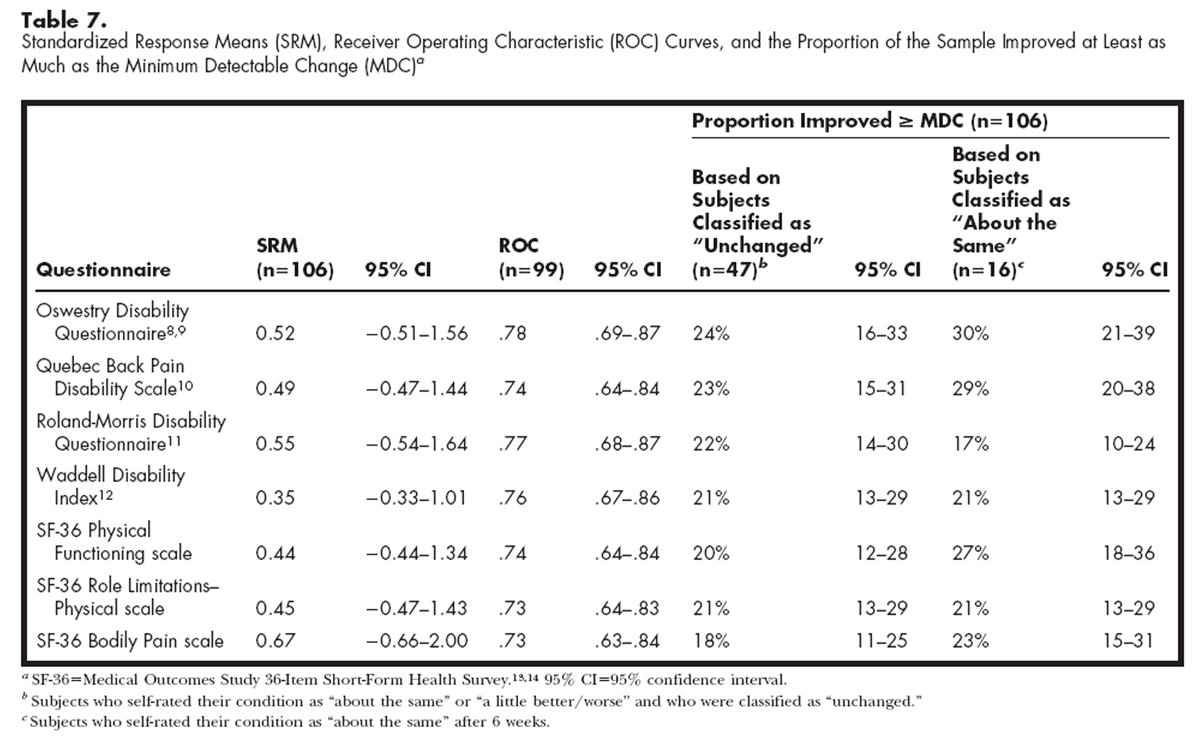
Table 7 shows the point estimates and 95% CIs for the 3 methods of quantifying responsiveness. The 95% confidence intervals that are presented in Table 7 indicate that there are no differences in the estimate of the mean SRM across instruments. The mother used by Liang et al37 for comparing SRMs does not use independent t tests but rather uses paired t tests to compare multiple SRMs for each test assembled under “jackknife” procedures. Using this method, the SRM of the Waddell questionnaire was different from that of the SF-36 Bodily Pain scale (t(105)=2.92, P=.004) and the Roland-Morris questionnaire (t(105)=2.52, P=.013). However, if Bonferroni adjustments are made for all 21 paired comparisons, none of the effects are significant. There were no differences among the questionnaires on the ROC curves, as indicated by the overlap of all of the 95% CIs and the chi-square analysis of the highest and lowest values (Oswestry questionnaire and SF-36 Role Limitations–Physical and Bodily Pain scales). The reliable-change method based on the MDC for the group originally classified as “unchanged” and for the subgroup of 16 subjects showed no differences among the questionnaires, with overlap of all of the 95% CIs. That is, the proportion of subjects who changed by at least as much as the MDC was not different among the questionnaires.
Discussion
We chose to explore the test-retest reliability of measurements obtained for 5 questionnaires by identifying post hoc a group of subjects who were unchanged (ie, subjects who rated themselves as “about the same,” “a little better,” or “a little worse”). We checked the validity of measurements obtained using this strategy in 3 ways. First, we examined the mean change scores for each level of the global rating scale. The pattern confirmed to us the direction and magnitude of mean change scores for the 7 levels of the global change scale that we expected. Only 5 subjects reported any overall worsening of their condition. There were some inconsistencies. For example, on the SF-36 Role Limitations–Physical scale, the 3 subjects who rated their problem as “a little worse” had an average worsening of 17 points, whereas the 2 subjects who rated themselves as “much worse” improved by an average of 13 points. These inconsistencies were likely due to the very small numbers of subjects who selected either category; to the structure of the SF-36 Role Limitations–Physical scale, which yields only 5 total scores; and to the forced choice between the ratings “a little worse” and “much worse.”
Second, we confirmed that, with the exception of the SF-36 Bodily Pain scale, the questionnaire scores of the subjects classified as “unchanged” were not different initially and at follow-up, nor were the scores for subjects who rated themselves as “a little better” different at the 6-week follow-up. There was a difference in the SF-36 Bodily Pain scale scores between the initial and follow-up tests (5 points for the 47 subjects classified as “unchanged” and 12 points for the 16 subjects who rated themselves as “a little better”), but neither magnitude of change may be clinically meaningful. Third, we identified another group of subjects, those with back pain of more than 6 months' duration, who a priori could be expected to experience little change over a 6-week retest period. Intraclass correlation coefficients for this group of 37 subjects were identical or similar to those for the group that was classified as “unchanged” using the global change scale.
Because on one of the scales (ie, the SF-36 Bodily Pain scale) there was a difference in the “unchanged” group between the initial score and the follow-up score, we also calculated ICCs on questionnaire scores for the subgroup of 16 subjects who rated themselves as “about the same.”
For the modified Oswestry Disability Questionnaire, the ICC value of .84 (95% CI=.73–.91) that we found is comparable to the reliability coefficient reported by Baker et al [9] for same-day administration of this questionnaire (r=.89). The MDC derived from the group classified as “unchanged” was about the same (15 points) as the estimate of 16 points that we made from data published by Fairbank et al [8] for the original version of the Oswestry questionnaire. The ICC for the subgroup of 16 subjects was .92 (95% CI=.79–.97), and the MDC based on this ICC value was 10.5. Applying either MDC to the initial questionnaire scores demonstrates that the modified Oswestry questionnaire has sufficient scale width for clinical application of the questionnaire in this sample. We did not find the low data quality (blank and multiple responses) reported by Stratford and colleagues, [21] and the scoring algorithm accommodates those individuals who choose not to complete the sex life section. We believe that the modified Oswestry questionnaire has sufficient reliability to recommend it as a standardized measure of activity limitation. Our data indicate that the MDC for the modified Oswestry questionnaire is either 10.5 or 15 points. Therefore, a therapist would need to see a change of at least 10.5 points (and possibly as much as 15 points), in our opinion, to be 90% confident that real change had occurred.
For the Quebec Back Pain Disability Scale, the ICC value of .84 (95% CI=.73–.91) that we found was a little lower than the ICC of .93 reported by Kopec et al. [10] We believe that this difference reflects either sampling differences or the greater variability in scores we would expect because we used a longer retest period. The MDC of 19 for the “unchanged” group was somewhat larger than the estimate of 14 points that we calculated from Kopec and colleagues' data. [10] Subjects in the study by Kopec et al, however, were classified as “unchanged” if they rated themselves as the same on a 3-level transitional scale (“better,” “the same,” “worse”); therefore, the MDC of 15 points derived from the reliability data of the subjects who said they were “about the same” in our study is comparable. A change of at least 15 points in the Quebec questionnaire score of an individual patient (and possibly as much as 19 points) would be necessary, in our view, to be 90% confident that real change had occurred. Scale width for the Quebec questionnaire when based on the MDC for the “unchanged” group was a little over the 15% criterion limit at the lower end of the scale, with 19% of subjects having an initial score too low to allow improvement to be detected. When based on the MDC for the subgroup, scale width was within the 15% criterion.
For the Roland-Morris Disability Questionnaire, the ICC value of .53 (95% CI=.29–.71) that we found was markedly lower than that reported over a 3- to 6-week retest period by Stratford and colleagues. [25] They reported an ICC of .86 (95% CI=.72–.94) and an MDC of 4 to 5 points. [21] The ICC appeared lower again (ICC=.42, 95% CI = –.07–.75) for the subgroup of 16 subjects who rated themselves as “about the same,” and the lower bound of the 95% CI crosses zero. Our data showed an MDC of 8.6 or 9.5 points based on the reliability estimates for the 2 groups. The difference in test-retest reliability found in other studies and in our study may be explained by sample differences. The subjects in the studies by Stratford and colleagues [17, 25] were referred by physicians to the physical therapy outpatient department of 1 or 2 hospitals. In contrast, we drew our sample from a range of physical therapy outpatient services, and we believe that our subjects were more likely to be more variable and more closely representative of the general clinical population in a health care system where patients may consult a physical therapist with or without referral from a physician.
The sample in our study included a greater proportion of female subjects, were on average older, had lower initial Roland-Morris questionnaire scores, and had a longer duration of back pain than the samples in the studies by Stratford and colleagues. [17, 25] If sample differences were sufficient to explain poorer test-retest reliability for the Roland-Morris questionnaire, we would expect to have seen a similar effect with the other questionnaires, but this was not the case. The use of the average of the patient's and the therapist's ratings of overall change in the studies by Stratford and colleagues may have screened out the types of subjects in our study who showed considerable variability in scores. Subjects in our study who reported no change but whose Roland-Morris questionnaire scores suggested they had changed, tended to have had their low back problem for more than 6 months. Perhaps these subjects had become used to their problem and reported no overall perception of change, despite the functional improvement detected by the Roland-Morris questionnaire. This explanation, however, seems unlikely in the absence of similar variability in the scores of the other questionnaires. Another possibility is that the variability in scores may reflect the emphasis in the Roland-Morris questionnaire's instructions to subjects to select an item only “if you are sure that it describes you today.” Low back pain can vary considerably from day to day; thus, Roland-Morris questionnaire scores will reflect diurnal variations in activity limitations. The instructions also urge that “if the sentence does not describe you, then leave the space blank”; therefore, it is possible that subjects will not select an item if they have not attempted that activity that day.
The poor reliability and consequently large MDC for the Roland-Morris questionnaire severely reduces the scale width. At the time of the initial measurements, 51% of the subjects scored less than the MDC. Therefore, the Roland-Morris questionnaire would not be able to reliably detect improvement in half of the sample. Even using the previous best estimate by Stratford et al [17] of the MDC at scale extremes of 4 points, 19% of the subjects scored less than 4 points at initial testing. On the basis of the poor test-retest reliability and consequently large MDC and limited scale width, we cannot recommend the use of the Roland-Morris questionnaire as a measure of functional outcome in a general clinical population.
The test-retest reliability of measurements obtained with the Waddell Disability Index has not previously been reported for a self-administered version of the questionnaire. We calculated the ICCs as .74 (95% CI=.58–.85) for the “unchanged” group and .79 (95% CI=.51–.92) for the subgroup and the MDC as around 3 points, which constitutes one third of the available range of the scale. The potential clinical utility of the Waddell Disability Index is diminished by the relatively large MDC and a lack of scale width, as 21% of the sample scored less than 3 points and 20% more than 6 points at the initial measurement.
The ICCs of .83 (95% CI=.71–.90) and .91 (95% CI=.76–.97) that we obtained for the SF-36 Physical Functioning scale are similar to that reported by Patrick et al [22] (ICC=.89), who analyzed the data for 52 subjects with sciatica who self-rated their leg pain as unchanged over a 3-month retest period. The MDC of 22 is close to the 21 points we estimated from the data reported by Patrick et al. When based on the smaller subgroup in our study, the MDC might be as low as 16. Scale width is within the 15% criterion limit whether the MDC of 16 or 22 is applied, and the SF-36 Physical Functioning scale therefore appears to be an appropriate scale for use by physical therapists. A therapist would need to observe a change in the SF-36 Physical Functioning scale score of at least 16 points (or 22 points by the less stringent reliability analysis) to be 90% confident that real change had occurred.
The ICCs for the Role Limitations–Physical and Bodily Pain scales of the SF-36 in our study were considerably lower than those reported by Patrick et al [22] (ICC=.80 and .67). Although the ICCs for the subgroup who rated themselves as “about the same” were somewhat stronger, they were still weak (ICC=.47 and .59), and the lower bound of the CIs approached zero. In the study by Patrick et al, subjects rated the overall change in their leg pain rather than the change in their overall condition. In addition, the subjects had sciatica secondary to a herniated lumbar intervertebral disk and represent a different clinical population than the subjects in our study. The different results, therefore, may relate to differences in sample characteristics (eg, variance differences), but scale characteristics may also help explain the different results. The SF-36 Role Limitations–Physical scale consists of 4 questions with forced-choice (yes/no) responses, and available total scores are therefore 0, 25, 50, 75, and 100. For any individual, a small number of changes in responses from “yes” to “no” or vice versa could have a very large effect on the score. Score distribution was very skewed, with 66% of the subjects at the initial measurement and 42% of the subjects at the follow-up measurement scoring 0, the worst possible score. Thirty subjects scored 0, the worst possible score, at both pretest and posttest, but many others showed large improvements and worsening. The data for the SF-36 Role Limitations–Physical scale were highly skewed, and the estimate of MDC of 62 or 66 points is likely to be overestimated.
There was a small improvement in SF-36 Bodily Pain scale scores over the retest period for subjects classified as “unchanged” and for those who rated their back condition as “a little better.” The SF-36 Bodily Pain scale has only 2 items, and poor reliability is more likely in very brief scales. The MDC was 33 or 41 points, and scale width was beyond the 15% criterion limit at the lower end of the scale range. On its own, the SF-36 Bodily Pain scale, in our view, cannot be said to be an adequate measure of pain or pain-related function, comprised as it is of one pain intensity item and one item regarding how much pain interferes with normal work. Because of the substantial floor effect, the poor scale width, and the variability in scores in stable subjects, the SF-36 Role Limitations–Physical and Bodily Pain scales do not appear to be useful measures of functional outcome for individual patients.
Based on these data, the Physical Functioning scale is the most relevant of the SF-36 physical health scales, and it can be easily hand-scored. We see advantages, however, in administering the SF-36 in its entirety. The SF-36 provides a health status profile, rather than a single index score, and individual and aggregated data can be compared with the population norms available in many countries. [15, 16, 41–45] The International Quality of Life Assessment (IQOLA) Project is translating, validating, and norming the SF-36 in 14 countries: Australia, Belgium, Canada, Denmark, France, Germany, Italy, Japan, the Netherlands, Norway, Spain, Sweden, the United Kingdom (English version), and the United States (English and Spanish versions). [46] The scales in the mental health domain may provide a brief screening tool to alert the clinician to the need for appropriate referral. The main disadvantage of the SF-36 is that hand-scoring of some of the 8 scales is laborious, in our view, because of the complex scoring algorithm. However, SF-36 scores can be easily generated using a spreadsheet, and customized scoring software is also available.
The results of the reliability portion of our study indicated that the modified Oswestry Disability Questionnaire, the SF-36 Physical Functioning scale, and the Quebec Low Back Disability Scale were the most reliable and had sufficient scale width to detect improvement or worsening in most subjects. The reliability of measurements obtained with the Waddell Disability Index is moderate, but we believe the scale width is insufficient to recommend it for clinical application. The Roland-Morris Disability Questionnaire and the SF-36 Role Limitations–Physical and Bodily Pain scales lacked sufficient reliability and scale width for clinical application. Test-retest reliability results for the Roland-Morris Disability Questionnaire differed from those of earlier reports, and this highlights the importance of examining reliability in the population to which the measurement tool will be applied in practice.
In the second part of our study, we explored the responsiveness of the 5 questionnaires. Just as measurements obtained with a test may be reliable but not valid, it is possible for a test to yield reliable measurements but to be unresponsive. There has also been some debate about whether a test can yield unreliable measurements yet be responsive. [47, 48] There is currently no agreement as to the most appropriate method of evaluating the responsiveness of tests. [24, 27, 49, 50] Therefore, we explored responsiveness using 3 methods by which point estimates and 95% CIs could be calculated and the differences among questionnaires tested. The SRM is typical of the distribution-based or overall-change approach, and the ROC curve is representative of the criterion-based or valid-change approach. The third method, which calculates the proportion of subjects who change by at least as much as the MDC has not previously been used and can be termed a reliable-change approach.
The absolute value of the SRM can be interpreted in the same way was an effect size, where .20 is regarded as small, .40 as moderate, and .80 as large. [51] The SRM point estimate values for the questionnaires in our study were moderate, and the 95% CIs were very wide. We chose the SRM because it is the only distribution-based method for which a method of hypothesis testing has been described. [27, 37] We believe there is considerable opportunity in the repeated iterations of Liang and colleagues' complex SRM procedure [37] for error. The “jackknife” procedure used to generate what Liang and colleagues called “pseudo-values” [37] is performed by systematically dropping each subject's data from analysis at a time. That is, the SRM is recalculated n times with each subject removed in turn. This results in a population of n SRM pseudo-values around the sample SRM and provides a sampling distribution of SRMs from which to estimate a population SRM. The population SRM and variance are then estimated from the pseudo-values, and finally a t test is used to compare the tests. We found that the result was distorted unless calculations were made to 5 decimal places.
The area under the ROC curve has a possible range from .50, indicating a chance finding, to 1.0, indicating perfect ability of change scores to discriminate between changed and unchanged patients. The ROC point estimate in our study fell within a narrow range from .73 to .78, and there was no difference among the scores from the questionnaires, suggesting that all of the tests were equivalent in responsiveness. The ROC values of .78 and .77 that we obtained for the Oswestry and Roland-Morris questionnaires are almost identical to those reported by Stratford and colleagues [21] (.78 and .79). Beurskens et al [20] reported a similar ROC value for the Oswestry questionnaire (.76), but a higher value for the Roland-Morris questionnaire (.93).
Criterion-based methods require the sample to be dichotomized into those subjects who are unchanged and those who have improved by a certain amount. [27, 28] The use of patients' self-ratings of overall change as the criterion of meaningful clinical change has several limitations: the measurements have unknown reliability and validity; recall of initial states tend to be inflated, which tends to inflate the perceived magnitude of change; and the scale is completed at the same time as the follow-up questionnaires and is therefore not independent. [52] In our study, subjects were asked to complete the rating of change scale before the questionnaires, and the completion of the questionnaires may have been influenced by the overall rating. However, because the questionnaires were administered by mail, we have no way of knowing the order in which the subjects completed the tasks. Patient self-ratings, or averages of patient and therapist ratings of overall change, are commonly used as the criterion of change because of the valued perspective of the rater(s) and because the information can be collected easily.
The reliable-change method of evaluating responsiveness counted the number of subjects who changed by at least as much as the MDC over 6 weeks. Because we had performed 2 reliability analyses, one for the group classified as “unchanged” and one for the smaller subgroup who had rated themselves as “about the same,” we had 2 estimates of MDC. In neither case was the proportion different among the questionnaires.
In the responsiveness portion of our study, we found that none of the questionnaires could be shown to be more or less responsive than any other. Furthermore, it appears possible for a questionnaire to yield scores with very poor reliability, but to have reasonable responsiveness. The SF-36 Bodily Pain scale's ICC was lower than .50, but the scale was comparable in responsiveness to the other questionnaires. This finding may indicate either that the questionnaires perform similarly in their ability to detect change over time or that the responsiveness methods are not able to discriminate between instruments with low and high responsiveness. The proliferation of responsiveness measures and debate concerning methods for determining responsiveness suggest that the optimal way to quantify this relatively recently conceptualized psychometric property of tests has not been described. [27, 28, 48, 50] The validity of scores obtained with a responsiveness index could be demonstrated by testing whether the index is able to discriminate between a test that is known to be responsive and one that is known not to detect change over time in a particular clinical population.
We suggest that the choice of a responsiveness index should be dictated by the purpose for which the index is being used in this application. If the aim is to quantify the responsiveness of an outcome measure to be used in research, then we believe that a distribution-based method would be most appropriate, as this information could be used to estimate sample size and statistical power. Distribution-based methods, however, provide no information about whether change is clinically meaningful. A criterion-based method may be appropriate where the purpose is to detect meaningful change in a clinical setting. Distribution-based methods provide information analogous to a test of statistical significance, and criterion-based methods are analogous to a judgment of clinical significance. The reliable-change method, in our opinion, provides practical information for clinical application in that it answers the question, “In what proportion of my patients is this questionnaire likely to detect change beyond the amount that can be attributed to measurement error?” The limitation of this method is that the MDC may not be known for many questionnaires and clinical tests.
We are the first authors to report on reliability and responsiveness for these 5 questionnaires in a sample drawn from the range of settings in which patients with low back pain seek physical therapy interventions. Our sample was drawn from hospitals, private practices, and community-based services, whereas previous studies have used samples obtained from patients seeking physical therapy at 1 or 2 hospitals or practices [17, 18, 25] or from both physical therapy and medical treatment centers. [10]
Although our sampling strategy was designed to obtain a representative sample, a number of factors tend to reduce generalizability. The success of consecutive sampling may have been obscured if therapists did not record instances when they failed to approach a potential subject. Only 7 such instances were recorded, and it is possible that underreporting occurred in the course of busy daily practice and due to the eagerness of the therapist to appear cooperative. In addition, 67 subjects (32%) who initially agreed to participate failed to return the first set of questionnaires, and it is not known whether this group was different from those who actually participated in the study. In addition, because the recruitment sites were all located in urban areas, the sample may not reflect differences in the profile of clients seeking physical therapy in rural locations. For practical reasons, people who could not read or write English were excluded, and the results therefore may not be generalizable to people from non–English-speaking backgrounds.
Another limitation of our study is the use of the global rating of change scale as the sole criterion of meaningful change. Whether the single-item global change scale used in this study yields reliable measurements is unknown, and it is likely that the rating was not independent of the activity limitation questionnaire responses. That is, a subject's response to the global rating of change may have influenced the subsequent responses to the questionnaires at follow-up. Norman and colleages [52] identified one study of quality of life in childhood asthma [53] where the criterion of change was determined by an independent evaluation of all patient data. It needs to be established whether an independent evaluation of change based on these data would be a better criterion of change in patients with low back pain. [52, 53]
In the questionnaires that we studied, subjects were asked to report activity limitation during different time periods (Tab. 1), which could have influenced their responses. The Roland-Morris and Quebec questionnaires ask about activity limitation “today,” the SF-36 Physical Functioning scale asks about activity limitation “now,” the SF-36 Role Limitations–Physical and Bodily Pain scales ask about activity limitation during “the past 4 weeks,” and the Oswestry questionnaire gives no specific time reference. We are unaware of any studies that have explored this issue, although Fairbank and Pynsent [54] recently reported that patients prefer a format such as that of the Oswestry questionnaire in which the time frame “now” is made explicit.
A surprising result in our study was that although 49% of the subjects said their condition was “better,” “much better,” or “completely gone” after 6 weeks, none of the questionnaires reliably detected change in more than 30% of the subjects (Tab. 7). This result illustrates that the amount of change in questionnaire scores perceived by the client to be meaningful may be smaller than the amount of change required to be statistically 90% confident that score change is not just measurement error (the MDC). More reliable and responsive methods need to be developed for measuring activity limitation in people with low back pain. Perhaps we are currently overestimating the SEM (and therefore the MDC) derived from small samples. However, the consequences of wrongly concluding that a patient with low back pain either has or has not changed by a measurable amount based on change in questionnaire scores are unlikely, in our opinion, to be substantially adverse. If a patient's status does not change by at least as much as the current MDC within an expected time-frame, the therapist may decide to alter some component of the treatment regimen, to refer the patient to another health care professional, or to cease therapy. The clinician faced with interpreting a change in an individual patient's questionnaire scores will advisedly use a range of outcome indicators to provide a picture of overall change.
Although we contend that the modified Oswestry Disability Questionnaire, the SF-36 Physical Functioning scale, and the Quebec Back Pain Disability Scale appear to be the most useful measures of functional outcome for people with low back pain, there are practical considerations that also influence the choice of questionnaire. If a clinician sees few patients with low back problems and fast processing of results is the primary consideration, then the Waddell Disability Index may be appropriate. Therapists in multidisciplinary clinics may decide that the SF-36 can provide the more comprehensive assessment required for their purposes. Scale content also provides a point of differentiation. For example, the SF-36 does not ask about difficulty sustaining body positions such as sitting and standing, and the Oswestry questionnaire does not include difficulty moving between postures such as sit to stand. The Quebec questionnaire has more content relating to upper-limb activities (pulling/pushing, throwing/catching, reaching) than the other scales. Notwithstanding a careful choice of scale, there will always be some individuals who do not have a sufficient initial score to enable change to be reliably detected over time. Clinicians, therefore, should have alternative or multiple strategies for measuring functional outcome, and they should be aware of the limitations of each method.
Conclusion
Our data indicate that the Oswestry Disability Questionnaire, the SF-36 Physical Functioning scale, and the Quebec Back Pain Disability Scale have sufficient reliability and scale width to be applied in an ambulatory clinical population with low back problems. The Waddell Disability Index has insufficient scale width for clinical utility. The Roland-Morris Disability Questionnaire and the SF-36 Role Limitations–Physical and Bodily Pain scales did not have sufficient reliability to be recommended as clinical outcome measures for individual patients. This study showed that the responsiveness of the questionnaires was similar, and we conclude that one questionnaire cannot be preferred over another based on the magnitude of the absolute values of responsiveness indexes.
References:
Beattie P, Maher C.
The role of functional status questionnaires for low back pain.
Australian Journal of Physiotherapy . 1997;43:29–38.Delitto A.
Are measures of function and disability important in low back care?
Phys Ther . 1994;74:452–462.ICIDH-2: International Classification of Functioning, Disability, and Health—Prefinal Draft Full Version.
Geneva, Switzerland: World Health Organization, 2000.Nelson MA, Allen P, Clamp SE, de Dombal FT.
Reliability and reproducibility of clinical findings in low-back pain.
Spine . 1979;4:97–101.Waddell G, Main CJ, Morris EW, et al. .
Normality and reliability in the clinical assessment of backache.
BMJ . 1982;284:1519–1530.Kopec JA.
Measuring functional outcomes in persons with back pain: a review of back-specific questionnaires.
Spine . 2000;25:3110–3114.Bombardier C.
Outcome assessments in the evaluation of treatment of spinal disorders.
Spine . 2000;25:3110–3103.Fairbank JCT, Couper J, Davies JB, O'Brien JP.
The Oswestry Low Back Pain Disability Questionnaire.
Physiotherapy . 1980;66:271–273.Baker DJ, Pynsent PB, Fairbank JCT.
The Oswestry Disability Index revisited: its reliability, repeatability, and validity,
and a comparison with the St Thomas Disability Index.
In: Roland M, Jenner JR, eds. Back Pain: New Approaches to Rehabilitation and Education .
Manchester, United Kingdom: Manchester University Press,1989:174–186.Kopec JA, Esdaile JM, Abrahamowicz M, et al. .
The Quebec Back Pain Disability Scale: measurement properties.
Spine . 1995;20:341–352.Roland M, Morris R.
A study of the natural history of back pain, part I: development of a reliable and sensitive measure
of disability in low back pain.
Spine . 1983;8:141–144.Waddell G, Main CJ.
Assessment of severity in low-back disorders.
Spine . 1984;9:204–208.Ware JE Jr, Sherbourne CD.
The MOS 36-Item Short-Form Health Survey (SF-36), 1: conceptual framework and item selection.
Med Care . 1992;30:473–483.McHorney CA, Ware JE Jr, Lu RJF, Sherbourne CD.
The MOS 36-Item Short-Form Health Survey (SF-36), III: tests of data quality, scaling assumptions,
and reliability across diverse patient groups.
Med Care . 1994;32:40–66.Ware JE Jr.
SF-36 Health Survey: Manual and Interpretation Guide .
Boston, Mass: The Health Institute, 1993.National Health Survey:
SF-36 Population Norms .
Canberra, Australian Capital Territory, Australia: Australian Bureau of Statistics, 1997.Stratford PW, Binkley JM, Solomon P, et al. .
Defining the minimum level of detectable change for the Roland-Morris Questionnaire.
Phys Ther . 1996;76:359–365.Beurskens AJHM, de Vet HCW, Koke AJA, et al. .
Measuring the functional status of patients with low back pain: assessment of the quality of four
disease-specific questionnaires.
Spine . 1995;20:1017–1028.Binkley JM.
Measurement of functional status, progress, and outcome in orthopaedic clinical practice.
Ortho Div Review . September/October1998:7–17.Beurskens AJHM, de Vet HCW, Koke AJA.
Responsiveness of functional status in low back pain: a comparison of different instruments.
Pain . 1996;65:71–76.Stratford PW, Binkley JM, Solomon P, et al. .
Assessing change over time in patients with low back pain.
Phys Ther . 1994;74:528–533.Patrick DL, Deyo RA, Atlas SJ, et al. .
Assessing health-related quality of life in patients with sciatica.
Spine . 1995;20:1899–1908.Streiner DL, Norman GR.
Health Measurement Scales: A Practical Guide to Their Development and Use . 2nd ed.
New York, NY: Oxford University Press Inc,1995.Stucki G, Liang MH, Fossel AH, Katz JN.
Relative responsiveness of condition-specific and generic health status measures in
degenerative lumbar spinal stenosis.
J Clin Epidemiol . 1995;48:1369–1378.Stratford PW, Finch E, Solomon P, et al. .
Using the Roland-Morris Questionnaire to make decisions about individual patients.
Physiotherapy Canada . 1996;48:107–110.McHorney CA, Tarlov AR.
Individual-patient monitoring in clinical practice: are available health status surveys adequate?
Qual Life Res . 1995;4:293–307.Stratford PW, Binkley JM, Riddle DL.
Health status measures: strategies and analytic methods for assessing change scores.
Phys Ther . 1996;76:1109–1123.Lydick E, Epstein RS.
Interpretation of quality of life changes.
Qual Life Res . 1993;2:221–226.Fordyce WE, eds.
Back Pain in the Workplace: Management of Disability in Nonspecific Conditions .
Seattle, Wash: IASP Press, 1995.Waddell G, Feder G, McIntosh A, et al. .
Low Back Pain Evidence Review .
London, United Kingdom: Royal College of General Practitioners, 1996.van den Hoogen HJM, Koes BW, van Eijk JTM, et al. .
On the course of low back pain in general practice: a one year follow up study.
Ann Rheum Dis . 1998;57:13–19.SF-36 Health Survey Scoring Manual for English-Language Adaptations:
Australia/New Zealand, Canada, United Kingdom .
Boston, Mass: Medical Outcomes Trust, 1994.Shrout PE, Fleiss JL.
Intraclass correlations: uses in assessing rater reliability.
Psychol Bull . 1979;86:420–428.Zimmerman D.
Mimicking properties of nonparametric rank tests using scores that are not ranks.
J Gen Psychol . 1993;120:509–516.Jacobson NS, Follette WC, Revensdort D.
Psychotherapy outcome research: methods for reporting variability and evaluating clinical significance.
Behav Ther . 1984;15:336–352.Christensen L, Mendoza JL.
A method of assessing change in a single subject: an alteration of the RC index
[letter to the editor].
Behav Ther . 1986;17:305–308.Liang MH, Fossel AH, Larson MG.
Comparisons of five health status instruments for orthopedic evaluation.
Med Care . 1990;28:632–642.Goldie PA, Matyas TA, Evans OM.
Deficit and change in gait velocity during rehabilitation after stroke.
Arch Phys Med Rehabil . 1996;77:1074–1082.Bland M.
An Introduction to Medical Statistics . 2nd ed.
New York, NY: Oxford University Press, 1995.Coakes SJ, Steed LG.
SPSS Version 6.1 Analysis Without Anguish .
Brisbane, Queensland: Australia: John Wiley & Sons, 1997.Hopman WM, Towheed T, Anastassiades T, et al. .
Canadian normative data for the SF-36 health survey.
CMAJ . 2000;163:265–271.Scott KM, Tobias MI, Sarfati D, Haslett SJ.
SF-36 health survey reliability, validity and norms for New Zealand.
Aust N Z J Pub Health . 1999;23:401–406.Aaronson NK, Muller M, Cohen PD.
Translation, validation, and norming of the Dutch language version of the SF-36 Health Survey
in community and chronic disease populations.
J Clin Epidemiol . 1998;51:1055–1068.Loge JH, Kaasa S.
Short form 36 (SF-36) health survey: normative data from the general Norwegian population.
Scand J Soc Med . 1998;26:250–258.Jenkinson C, Wright L, Coulter A.
Quality of Life Measurement in Health Care: A Review of Measures and Population Norms for the UK SF-36 .
Oxford, United Kingdom: Services Research Unit, 1993.The International Quality of Life Assessment (IQOLA) Project .
Available at: http://www.iqola.org.Guyatt G, Walter S, Norman G.
Measuring change over time: assessing the usefulness of evaluative instruments.
J Chronic Dis . 1987;40:171–178.Hays RD, Hadorn D.
Responsiveness to change: an aspect of validity, not a separate dimension.
Qual Life Res . 1992;1:73–75.Wright JG, Young NL.
A comparison of different indices of responsiveness.
J Clin Epidemiol . 1997;50:239–246.Deyo RA, Diehr P, Patrick DL.
Reproducibility and responsiveness of health status measures:
statistics and strategies for evaluation.
Control Clin Trials . 1991;12(suppl 4):142S–158S.Cohen J.
Statistical Power Analysis for the Behavioral Sciences .
New York, NY: Academic Press Inc, 1977.Norman GR, Stratford PW, Regehr G.
Methodological problems in the retrospective computation of responsiveness to change:
the lesson of Cronbach.
J Clin Epidemiol . 1997;50:869–879.Juniper EF, Guyatt GH, Feeny DH, et al. .
Measuring quality of life in childhood asthma.
Qual Life Res . 1996;5:35–46.Fairbank JC, Pynsent PB.
The Oswestry Disability Index
Spine (Phila Pa 1976) 2000 (Nov 15); 25 (22): 2940–2952
Return to OUTCOME ASSESSMENT
Since 5-21-2019
| Home Page | Visit Our Sponsors | Become a Sponsor |
Please read our DISCLAIMER |