

Do Visual Pain Trajectories Reflect the Actual
Course of Low Back Pain? A Longitudinal Cohort StudyThis section is compiled by Frank M. Painter, D.C.
Send all comments or additions to: Frankp@chiro.org


FROM: J Pain 2023 (Apr 10); S1526-5900(23)00395-4 ~ FULL TEXT
OPEN ACCESS C G Nim, W Vach, A Downie, A Kongsted
Spine Center of Southern Denmark,
University Hospital of Southern Denmark,
Oestre Hougvej
55, 5500 Middelfart, Denmark
Different trajectories of low back pain (LBP) have been identified prospectively using repeated measures. For these trajectories to inform clinical practice, they must be available in the clinical consultation. Therefore, identified LBP trajectories have been translated into visual pain trajectories (VPTs) that allow people with LBP, at the time of consult, to reflect upon their pain experience and identify the VPT that best categorizes their pain course. We have limited knowledge regarding the extent to which a chosen VPT reflects the prospectively experienced trajectory. Thus, we explored the distribution of pain intensity and pain pattern characteristics (from prospective pain trajectory data) within the retrospectively chosen VPT classes. We enrolled patients with LBP from Danish chiropractic practice. Using SMS, participants (n=719) scored their pain weekly on an 11-point numerical rating scale for 52 weeks. At week 52, participants identified one of eight VPTs that reflected their perceived back pain trajectory during the preceding year. We found that the chosen VPTs reflected pain intensity, but that pain patterns (episodic, fluctuating, and persistent) were not systematically recognized, and the experienced course varied substantially amongst participants within the same VPT. The VPTs are related to some aspects of the experienced LBP course but are not a proxy for the SMS measured trajectories. Reasons for apparent mismatches between the experienced course of LBP and VPT recall warrants further investigation.
PERSPECTIVE: Self-reported back pain trajectories reflected pain intensities obtained through weekly SMS tracking over a year, but participants' recall did not reflect the pain patterns (episodes and fluctuations) discovered prospectively. Clinicians can use self-reported pain trajectories to facilitate a dialogue about pain experience, but not as a proxy for prospective measures.
Keywords: Low back pain; Pain pattern; Pain perception; Pain trajectory; Primary care.
From the FULL TEXT Article:
Introduction
Low back pain (LBP) is often a long-lasting or recurrent condition. [16] Distinct pain trajectories have been described based on repeated measures, reflecting different LBP types across multiple pain characteristics, including pain-related distress, activity limitation, and work participation. [6, 7, 8, 9, 11, 17, 26, 31, 38]
Trajectories from repeated measures are well-described, but their usefulness in clinical practice is unexplored. Evidence suggests that people with LBP tend to stay in similar trajectories over time, [9, 34] and trajectories are potentially beneficial in predicting outcomes for people with neck pain. [32] Thus, trajectories may reflect subgroups that inform prognosis and potentially guide clinical decisions.
Typically, trajectories are recorded prospectively, yet there are limited benefits in knowing the prospective pain trajectory when patients, healthcare providers, and insurance companies desire a prognosis at the time of consultation. [29] To address this, the most commonly reported pain trajectories have been translated into self-reported visual pain trajectories (VPTs), allowing people with LBP to identify their patterns retrospectively using pre-defined classes. [10, 25, 32, 34]
There is limited knowledge surrounding whether, and to what extent, VPTs chosen by people with LBP retrospectively reflect their prospective course. One study assessed the agreement between retrospective VPT classes and the prospective LBP course. [10] Here, VPT classes were assessed using the Visual Trajectories Questionnaire for Pain (VTQ-Pain), which asked people with LBP to visually identify one of eight trajectories that best represented their pain experience over the prior 12 months. The prospective courses were identified using latent class analysis based on trichotomized numeric 0-10 pain scores, measured monthly for six months. There was general agreement between choice of VPT and the latent-class derived trajectory subgroups that participants were assigned to (e.g., ~80% of those selecting “A single episode” or “No back pain” had a prospective trajectory labeled as “No or occasional mild pain”). Similar findings emerged for those reporting “Severe back pain most of the time”. However, there was also some disagreement (e.g., those selecting the “Episodic pain” or the “Gradually improved”” visual trajectory were primarily classified in the “Mild persistent” prospective trajectory subgroup). These results suggest that monthly intensity estimates may miss variations (fluctuation and episodic) in LBP within a given month, including episodes with no pain, which are part of the pattern reported by people with LBP. [25] Furthermore, when considering the wide variation observed in LBP, the number of participants limited the study (e.g., four out of the eight visual trajectories had less than 15 participants).
In this study, we extend past work by recruiting a large sample of people with LBP to investigate what information retrospectively chosen VPTs provide about prospective pain experiences. In this study, we extend past work by recruiting a large sample of people with LBP to investigate what information retrospectively chosen VPTs provide about prospective pain experiences. Other than sample size, there are two important differences to past work. First, we collected prospective pain data weekly to overcome the potential limitations related to monthly sampling. Second, while the study by Dunn et al. explored agreement between VPT classes and classes constructed from the prospective trajectories, [10] we investigated whether VPT class membership allows making conclusions about certain features of the prospective trajectories. Our approach helps inform to what extent a clinician get specific information about the characteristics of a patient’s pain course from VPTs. For instance, if a person chooses a Severe versus an Episodic VPT class, can we be certain that the former will have experienced greater pain intensity and less pain-free periods/relapses? Alternatively, is there large variability in pain experiences across VPT classes, meaning that they do not tell what would have been measured prospectively? Consequently, we will examine the distribution of characteristics of the LBP courses within and across VPT classes. Characteristics related to i) intensity and frequency, ii) fluctuations, and iii) episodes will be considered.
Methods
Design and setting
We conducted an exploratory analysis using longitudinal data from The Danish Chiropractic Low Back Pain Cohort (ChiCo). ChiCo is a prospective, one-year, observational cohort of patients from ten primary chiropractic practices in the Central administrative Region of Denmark. The cohort included a total of 2,848 participants. [28] The study was reported according to the STrengthening the Reporting of OBservational studies in Epidemiology (STROBE) statement. [12]
Participants in the cohorts provided consent for data to be used for research, and all data achieved were anonymized. The data collections obtained authorization from the Danish Data Protection Agency (DPA) as part of the University of Southern Denmark’s institutional authorization (DPA no. 2015–57-0008, SDU no. 17/30591 and 16/47215). No approval was needed from the Regional Scientific Committee to extract and store the data or conduct the analyses. [28, 33] The analysis plan was not preregistered.
Study participants
ChiCo enrolled participants who consulted a chiropractor to initiate care for LBP with or without leg pain. Almost half of the participants experienced acute pain with a current episode duration of less than one week, and only a minority had pain for more than three months. However, approximately 83% had previously experienced LBP. [28] To be eligible for participation in the cohort, the patient had to be 18 years or older, complete electronic questionnaires in Danish, and have a cellular phone.
Of the 2,848 participants, 1,623 were invited to be contacted by SMS. The population of this study is hence defined by those 1,378 participants who accepted the invitation. This has been previously described. [24] Relative to the entire cohort, those followed by SMS had slightly higher education levels, lighter workloads, and had much shorter duration of pain. There were no baseline differences for any demographic or clinical parameters. Additionally, a comparison was conducted between those who were followed with weekly SMS questions about their pain and another subsample of the cohort who was not followed. In summary, the results indicated that “self-monitoring” of their pain status was not associated with the clinical course. [24]
Data collection
All questionnaires were completed electronically via REDCap (administered by Open Patient data Explorative Network) by the patients at the clinic upon inclusion and later at home. Participant characteristics were collected at enrolment (baseline) and VPT classes were collected at one year (follow-up) along with numerous other variables not considered here. Pain intensity and frequency were collected weekly by automated SMS questions. [28]
Prospective low back pain course
The participants were tracked with SMS each week for 52 weeks. The SMS consisted of two items concerning the pain frequency and intensity:
“How many days have you had back pain (or back-related leg pain) within the last 7 days? (please answer with one number from 0 to 7)”
“How severe was the pain typically on a scale from 0 to 10?”
If the pain frequency was answered with a 0, the second SMS automatically scored 0. Non-numerical responses (e.g., three days) were transformed manually to a numerical value (e.g., 3). It was recorded as missing if the answer was nonsensical. [28] This analysis will focus on the weekly pain intensity scores.

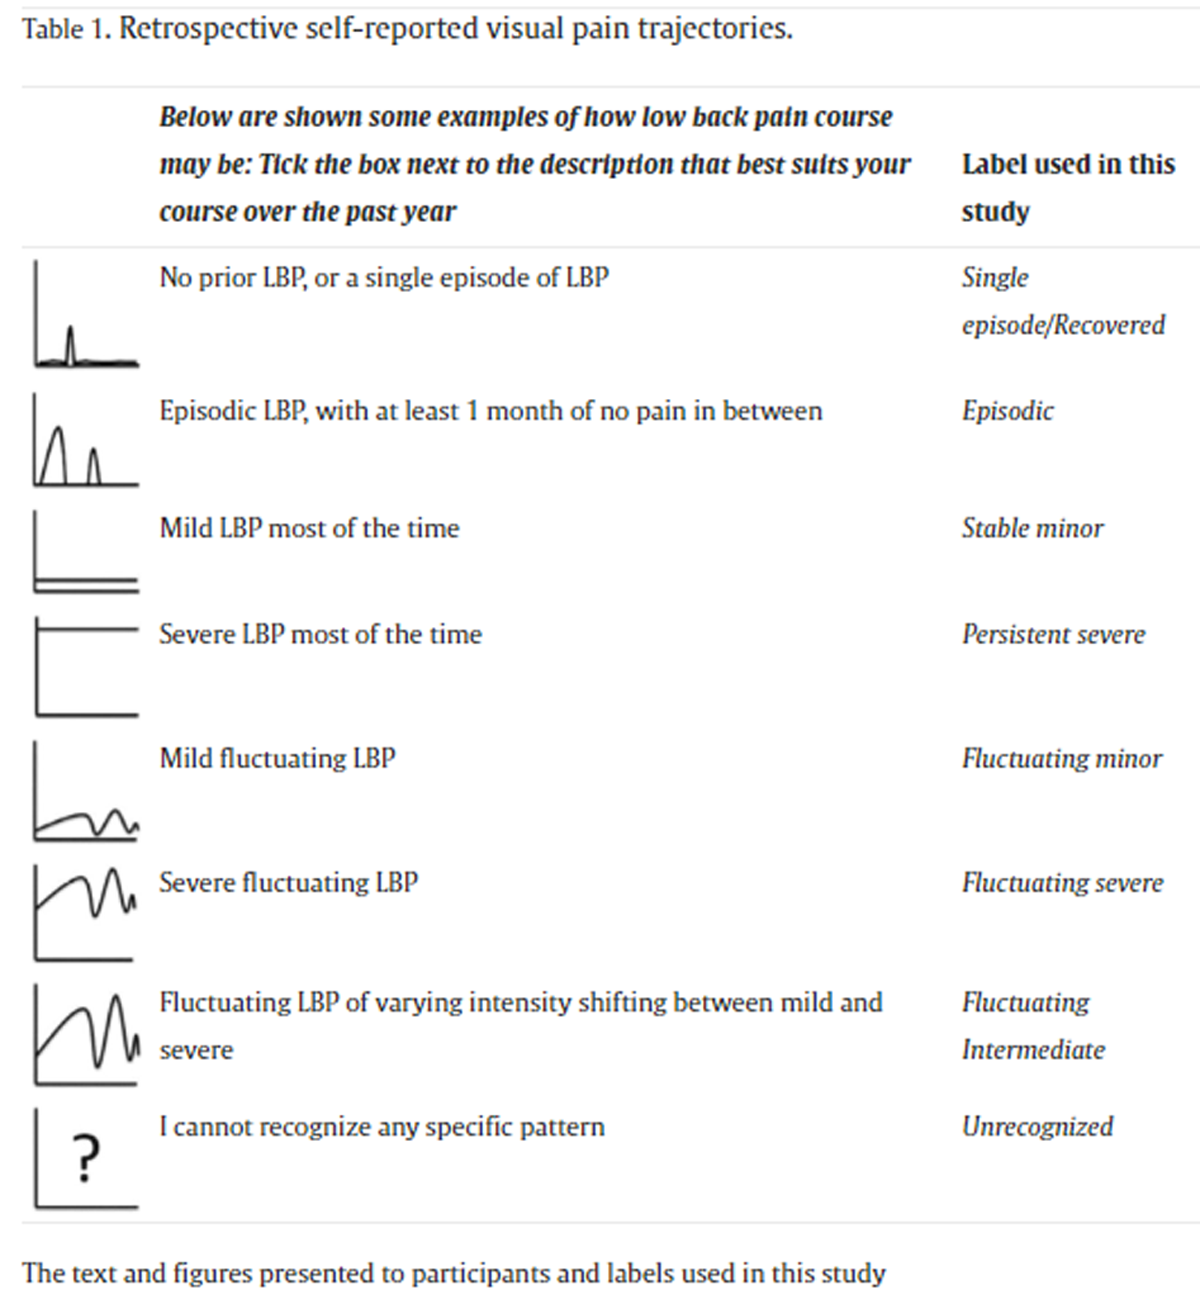
Table 1 Retrospective self-reported visual pain trajectories At the one-year follow-up, participants chose one of the eight VPT classes that best characterized their LBP experience over the last 12 months. A description and an illustration of the trajectory patterns were presented to the participants (Table 1).
The VPT is described by intensity: Mild (Single episode/Recovered, Episodic, Fluctuating minor, Stable minor), Moderate (Fluctuating intermediate), and Severe (Fluctuating severe, Persistent severe) and by pattern: Episodic (Single episode/Recovered, Episodic), Fluctuating (Fluctuating minor, Fluctuating intermediate, Fluctuating severe), and Stable/persistent (Stable minor, Persistent severe). [34]
Baseline characteristics
At baseline, participants reported age, sex (identified through social security number), typical back and leg pain intensity the previous week (Numeric Rating Scale (NRS) 0 = no pain to 10 = worst pain imaginable), [30] disability using the 23-item Roland-Morris Disability Questionnaire (RMDQ) (0% = no disability to 100% = completely immobile), [35] pain duration (< 4 weeks, 4-52 weeks, and > 52 weeks), and workability (0 = low workability to 10 = high workability).1 They also completed the STarT Back Screening Tool (low, moderate, or high risk for developing long-term disability),20 and the Back Beliefs Questionnaire (9 = negative beliefs to 45 = positive beliefs). [15]
Analytical strategy
Data cleaning, visualization, and analyses were completed using R (Linux, v. 4.1 with R-studio v. 1.4) applying the Tidyverse language.39
Participants’ baseline characteristics were described stratified by VPT class using means and 10th - 90th percentile range for continuous variables and absolute counts and relative frequency for categorical ones.
Non-responder analysis
For the purpose of this study, “responders” were defined as participants who had data for more than 32 weekly SMS questions and who provided VPT ratings at the one year follow-up.
Baseline characteristics associated with non-response were investigated in univariable logistic regression presented as odds ratios (ORs) with 95% confidence intervals. In addition, the distribution of the VPT classes at follow-up was compared between responders and the subset of non-responders who did have available VPT data but who did not have ?32 weeks of SMS data.
Individual trajectory data within their VPT
To gain a first impression of the data, we observed weekly pain scores from a random sample of up to 30 individuals from each VPT class. This allowed a visual inspection of the data used in the subsequent analyses. All available trajectories in an anonymized form can be accessed through an online repository (Shiny, R-studio) [6](https://caspernim.shinyapps.io/lbptrajectory/).
An overview of the data for each VPT was presented by i) graphing the distribution of pain intensity scores (VPT class averages and 10-90% percentiles) for each of the 52 weeks and ii) describing the distribution of the pain intensity score across all 52 weeks (VPT class averages and 10-90% percentiles).
Data preparation
For the remaining analyses, we restricted the data to include weeks 11 to 52. This eliminated the initial weeks when most individuals’ pain intensity decreases substantially. This reflects the expectation that retrospectively assessed pain trajectories reflect the course during the year instead of the initial decrease following care-seeking. [28]
Visualizing the relationships of VPT classes with LBP courses
A participant’s LBP course was described by characteristics related to pain intensity, frequency, episodes, and fluctuations. Each characteristic is defined below in the context of this study. In these definitions, “average” refers to taking the average over all weeks within individuals (excluding those with missing data). Comparing the distributions of these single characteristics across the VPT classes was not based on formal statistical methods but on data visualizations. In continuous distributions, violin plots with embedded box plots were used, with whiskers illustrating the 10th to 90th percentile range. The latter provided information about the range of each characteristic for 80% of participants selecting a VPT. When referring to the average value of a characteristic across participants, we use the label “mean”. In the case of discrete distributions, histograms were used. The final interpretation of the group differences was based on a description of the visual impression.
Variable definitionsPain intensity and frequency
This aspect was investigated using three characteristics: i) the relative frequency of weeks with pain (NRS > 0), ii) average pain intensity in all weeks, and iii) average pain intensity in weeks with pain.
Episodes
Pain-free periods
Pain-free periods, defined as a minimum of four consecutive weeks with NRS 0-1,21, 40 were used to indicate episodic LBP patterns. A pain-free period was preceded and followed by a week with pain or the start/end of the observation period. Pain-free periods were allowed to include a single week with a missing report but not consecutive weeks with missing reports. In all cases, at least four weeks with a reported NRS of 0-1 was required. The number of pain-free periods and the average length of the pain-free periods were considered characteristics.
Relapse
We examined the number of relapses to further capture the characteristics of episodic patterns. We defined relapse as an increase in pain intensity after a pain-free period (as defined above). We used two definitions: i) An increase in pain intensity to at least three out of 10, indicating an increase beyond mild pain [2] (Definition A; consistent with Stanton et al. consensus based Delphi Study [37]). ii) An increase in pain intensity to a level greater than or equal to the participant’s average pain intensity (Definition B; individually tailored).
Fluctuations
Variation on top of a general trend
The variation on top of a possible general trend was quantified by fitting a linear regression line for each participant’s SMS responses over time and calculating the Root-mean-square error (RMSE) (i.e., the standard deviation of the deviations from the line). A comparison of the RMSE with the average pain revealed that the RMSE is highly correlated to the average pain in participants with a limited number of pain weeks but provides independent information in participants with many pain weeks (Supplementary file 1). Consequently, only participants with at least 20 weeks of pain were included in the analysis.
Flare-up
We explored fluctuations further by considering the number of pain flare-ups. A flare-up was defined as higher pain scores than the maximum pain score in preceding weeks. Flare-ups have been previously considered in the literature, [5] although there is no consensus regarding appropriate duration of a comparison time window (how many weeks to “look back”) or the relevant magnitude of pain intensity increase to consider. Therefore, as an initial step, we explored all combinations of looking 2 to 8 weeks back in time and increased pain scores from 1 to 10. We present results for using a pain increase of three or more (out of 10) relative to average pain intensity levels the 4 weeks prior. All combinations can be accessed through the online repository (https://caspernim.shinyapps.io/painflareups/).
Sensitivity analysisThe potential impact of recall bias
Recall bias may have influenced the individual decisions of the participants. To address this issue, the analysis was repeated using only data from the most recent weeks (i.e., from week 40 to 52). Results were presented stratified by each VPT class as i) overview of the weekly data for each VPT class, ii) pain intensity and frequency, and iii) variation on top of a trend (i.e., the RMSE). There were insufficient data available to compare the episode characteristics over recent weeks.
The potential impact of using reported pain frequency instead of reported pain intensity
Participants received two SMSs. The first SMS queried pain frequency (number of days per week pain was experienced) and the second SMS asked about pain intensity. In our analysis, it is implicitly assumed that reported pain intensity was the essential aspect. However, it cannot be excluded that the number of days with pain in a week was the essential aspect. To explore this possibility, the correlation (Spearman’s rank) was calculated between the two measures using averaged data for each participant for each measure. Following this, we repeated the analysis, replacing the reported pain intensity with the reported pain frequency (number of days of pain within a week). Results were presented for i) the weekly overview, ii) the average number of days with pain across all weeks, iii) the average number of days with pain in a pain week, and iv) the variation on top of a trend (i.e., the RMSE).
Synthesis of the results from a clinical perspective
Whereas the analyses described above compared the distribution of the different pain characteristics across the VPT classes, clinicians are faced with making a conclusion about the LBP course for a single patient who presents with a specific VPT class. To facilitate comparison between VPTs, we present the following characteristics derived from the prospective data collection for each VPT class reported by mean and 10-90% percentiles or proportions:1) proportion of weeks with pain (frequency)
2) average pain intensity in all weeks (intensity)
3) average pain intensity in weeks with pain (intensity)
4) the variation on top of a trend (fluctuations)
5) proportion reporting at least two pain-free periods (episodes)
6) average length of pain-free periods (episodes)
7) proportion reporting at least two relapses (according to definition A) (episodes)We also present the clinical aspects independent of selecting any VPT, allowing comparisons to any given participant not selecting any VPT.
Results
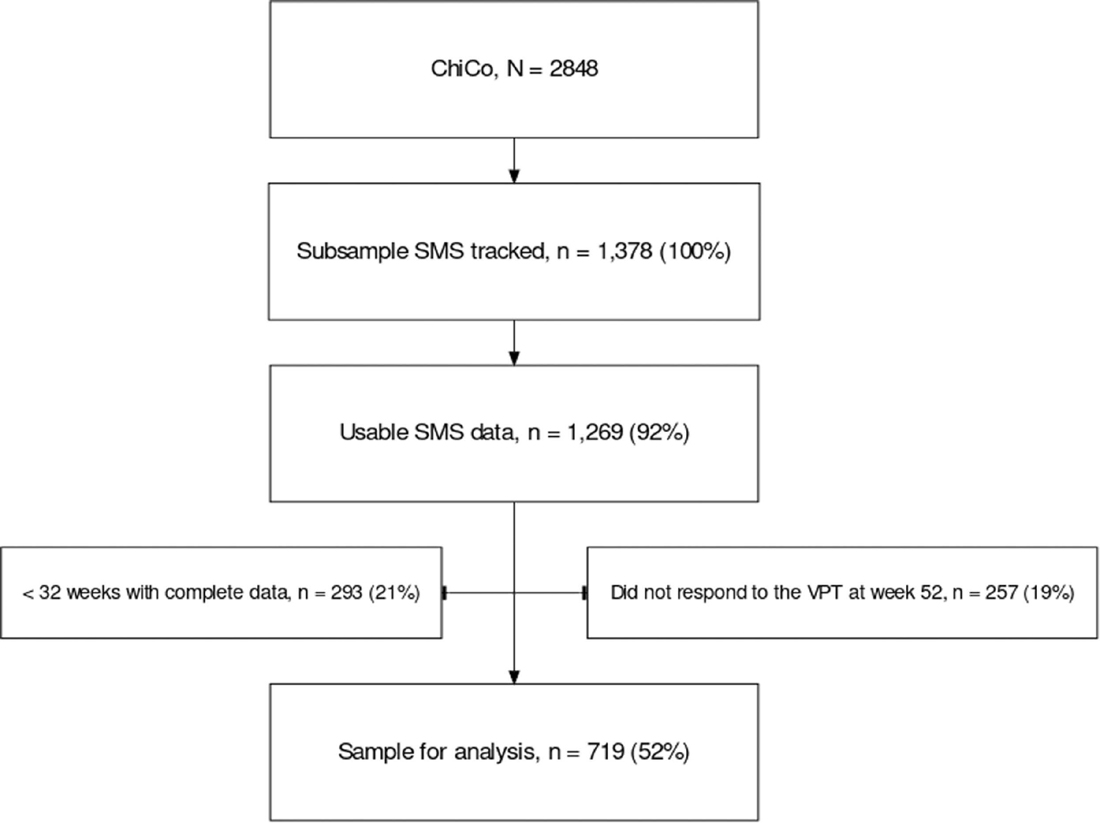
Figure 1
Table 2 A total of 1,269 participants (92%) had usable SMS data. We removed 293 participants (21%) who had <32 weeks of data and 257 additional participants (19%) who were missing VPT data at week 52. Providing a final sample of 719 participants (Figure 1).
The most common VPT selected was Single episode/Recovered (33%), and only 7 (1%) chose the VPT Persistent severe. We observed slightly higher proportions of males in the “severe” VPTs. All other baseline characteristics generally reflected the different degrees of severity indicated by the VPT labeling with increasing intensity or consequences from the Single episode/Recovered VPT towards the more severe VPTs (Table 2).
Non-responder analysis
Non-responders were more likely to have higher disability, higher risk of long-term disability (STarT Back Screening Tool), more negative back beliefs, and longer pain durations. Small differences were noted for those with and without complete SMS data. Those without complete SMS data more commonly selected minor VPTs, and none selected a severe VPT (Supplementary file 2).
Individual trajectory data
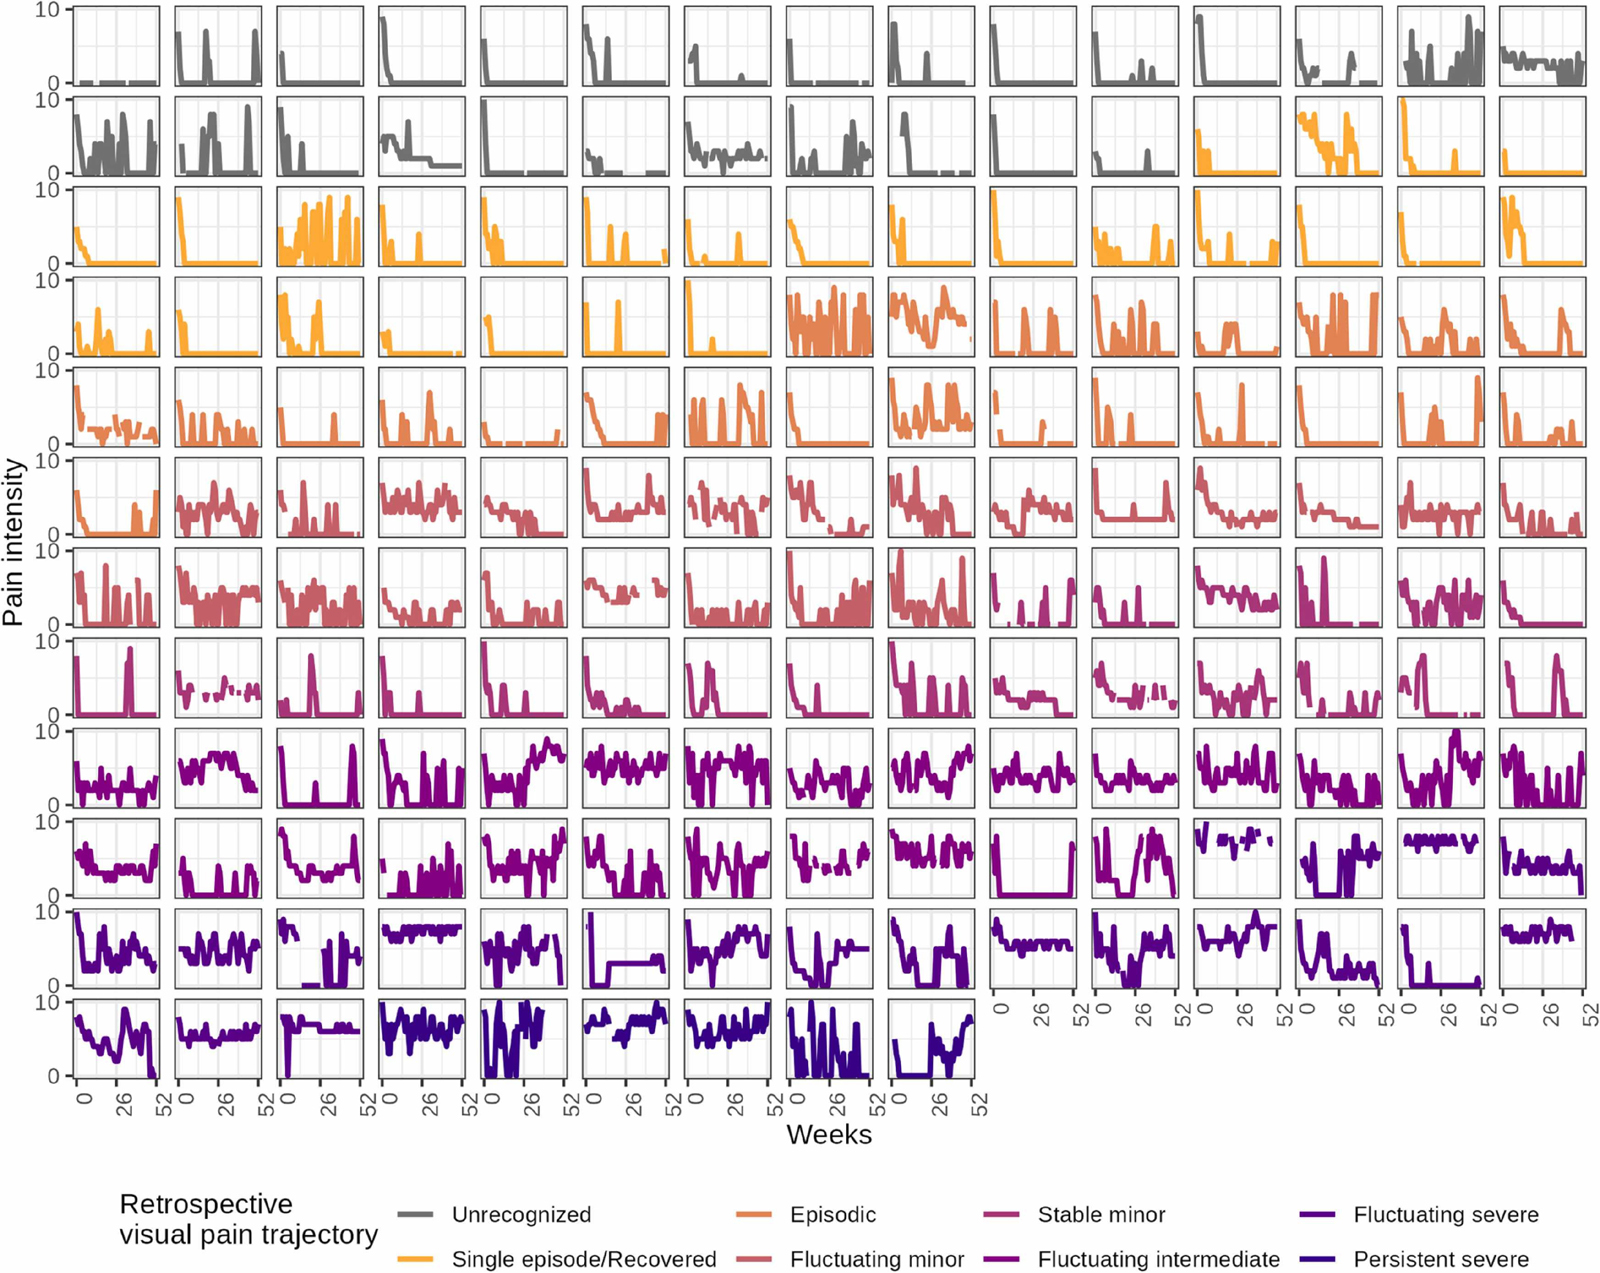
Figure 2 Overall, the LBP courses reflected more weeks in pain and higher pain intensity in VPT classes with labels indicating more severe LBP than in those labeled as mild or recovered. However, we also observed wide variations within each VPT class, with multiple deviations from the pattern indicated by the labeling (e.g., some who reported a single episode had multiple episodes according to our definition, and some who reported persistent pain had multiple pain-free periods). Furthermore, some participants reported a severe VPT while scoring relatively low pain scores throughout the 52 weeks. In contrast, some selecting the VPT Intense fluctuating displayed consistently high pain scores (Figure 2).
There was a rapid decline in pain intensity within the initial weeks of data collection across all VPTs. This justifies our decision to omit the initial ten weeks for the subsequent construct analyses. The mean pain intensities presented at the top of Figure 2 followed the severity of the VPT labeling. In contrast, there were no differences in weekly pain intensity within VPT classes labeled with the same intensity but different patterns (e.g., persistent and fluctuating severe) (Supplementary file 3).
Pain intensity and frequency
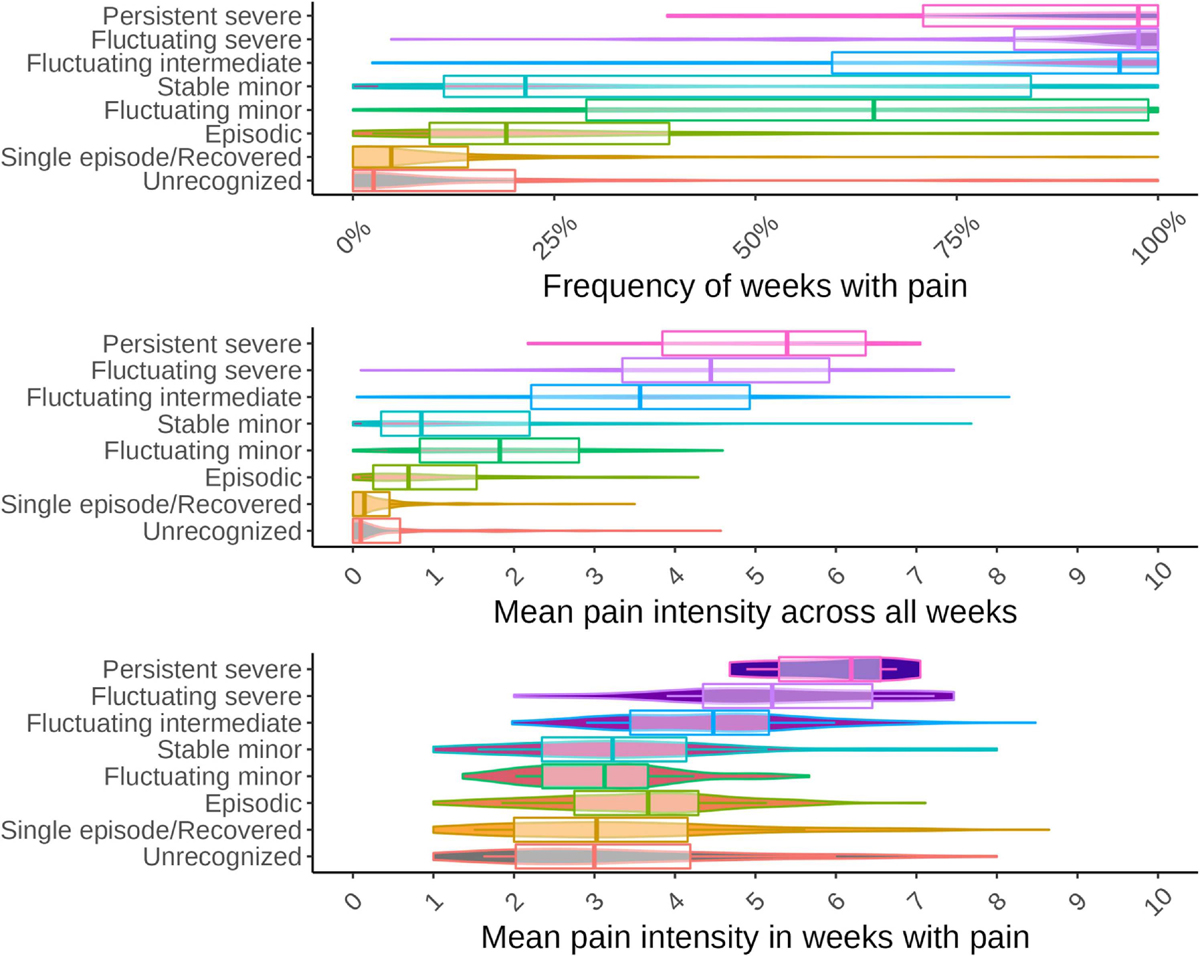
Figure 3
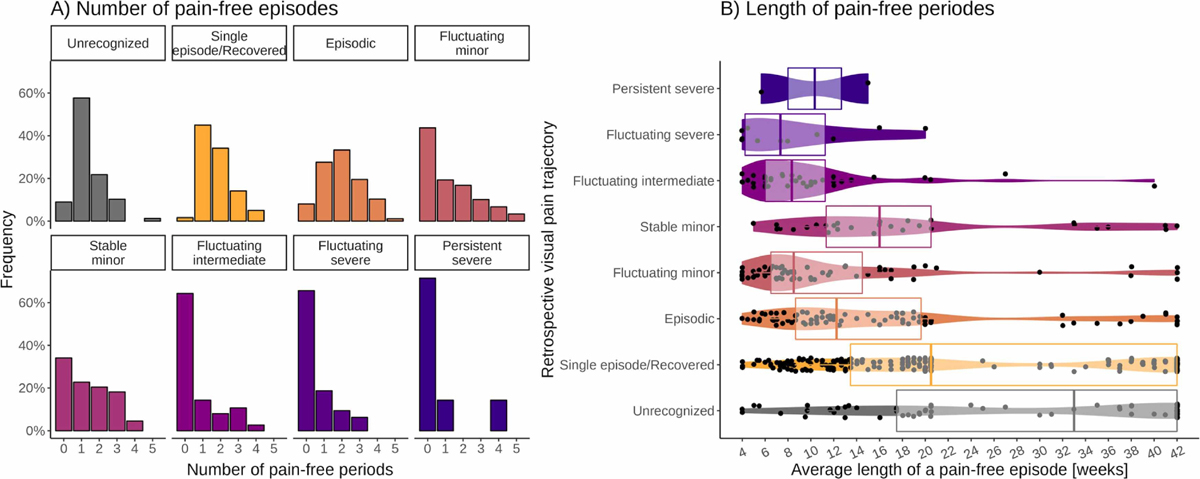
Figure 4 There was a clear trend for pain intensity and frequency across VPTs: the minor and episodic VPT classes had the lowest pain intensity, increasing towards the moderate and severe VPTs. Those choosing the Fluctuating minor VPT generally reported higher pain intensity than those choosing Stable minor, especially for weeks in pain (Figure 3).
Episodes
Pain-free periods
In the episodic VPT classes, the majority reported at least two pain-free periods, but in contrast to how we had defined episodic, some participants reported no pain-free periods. For the minor VPT classes, around half of the participants reported pain-free periods. In the moderate and severe VPT classes, most participants reported no pain-free periods (Figure 4.A).
Participants selecting either Unrecognized or Episodic (single or multiple) VPT classes had a relatively large chance of experiencing long pain-free period(s) compared with the other VPT classes. However, substantial variation in the average length of the pain-free period was observed for all VPT classes (Figure 4.B).
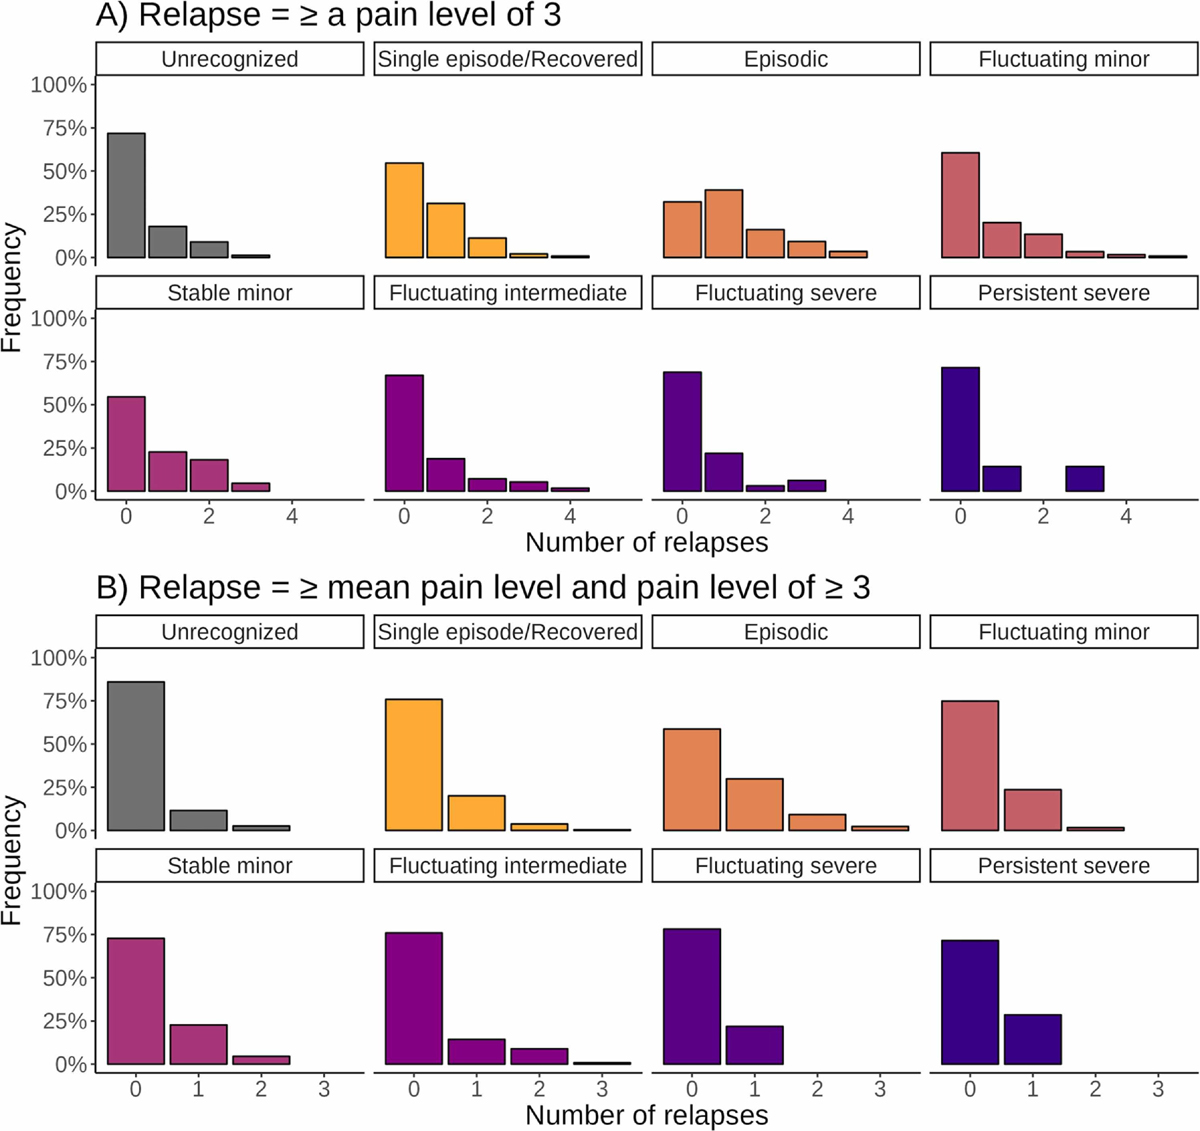
Figure 5 Relapse
Independent of the definition, relapses were not common in this cohort, with the majority not experiencing relapses. As expected, more relapses were reported for reaching pain levels of at least 3 (definition A, Figure 5.A) than for reaching at least 3 and at least the mean pain intensity (definition B, Figure 5.B). The participants selecting Unrecognized, Episodic, and mild VPTs had the most relapses, but relapses were found across all VPTs. Differences did exist in the Episodic VPT between the two definitions. When using definition A, the majority of participants experienced a relapse (58%), whereas, for definition B, only 32% experienced a relapse, which was consistent with the remaining VPTs.
Fluctuations
Variation on top of a general trend
Less than 20 weeks of pain was most frequently reported in the mild VPT classes, whereas participants in the moderate and severe intensity classes primarily reported more than 20 weeks of pain and were hence included in the analysis of variation on top of the pain course trend (Supplementary file 1).
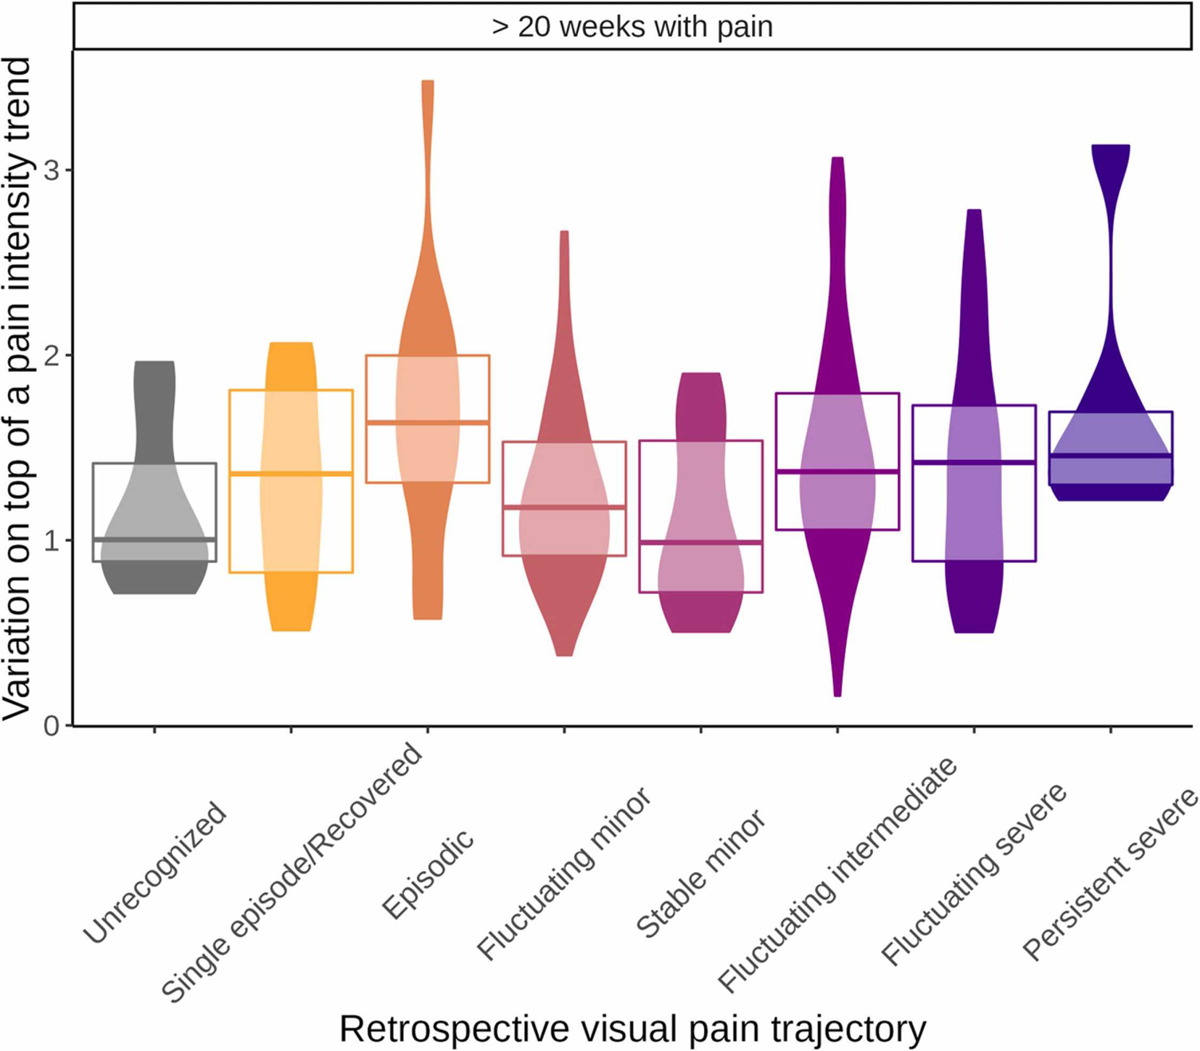
Figure 6 Differences between VPT classes were not pronounced among those with more than 20 weeks of pain. The Episodic VPT had the highest median standard deviation of the deviations from the line, and with considerable range of variation. Single episode/Recovered, Stable minor, and Unrecognized VPT classes had the lowest median standard deviation of the deviations from the line, with less range of variation. Notably, there were no distinct differences in the standard deviation of the deviations from the line between participants selecting minor fluctuating/stable or severe fluctuating/persistent (Figure 6).
Flare-up
We visually inspected periods looking back (from 2 to 8 weeks) and a range of increases in pain (1 to 10) (https://caspernim.shinyapps.io/painflareups/). Approximately half of the participants experienced flare-ups, which were more common in episodic and persistent severe VTPs. However, it was uncommon for participants to experience numerous flare-ups. No combination of time periods and pain increases resulted in the presence of flare-ups being distinctly different between VPTs (Supplementary file 4).
Sensitivity analysisThe potential impact of recall bias
The results using only the data of weeks 40 to 52 were very similar to those obtained in the main analysis. Only the Single episode/Recovered VPT class had slightly lower pain scores at the end of follow-up (Supplementary file 5).
The potential impact of using reported pain frequency instead of reported pain intensity
When using the data from all weeks and all participants, a strong (? = 0.94) correlation between the reported pain frequency and the reported pain intensity could be observed. However, the strength of correlation diminished substantially when including the weeks with pain only (? = 0.30) (Supplementary file 6).
There were minor differences when comparing the results based on the reported pain frequency with those from the main analysis based on the reported pain intensity. First, the drop in the initial weeks was less pronounced for the weekly overview, and more variation could be observed in moderate and severe VPT classes. Secondly, when switching from average pain intensity to average days with pain, Persistent severe and Fluctuating severe changed their position in the ranking of the VPT classes, whereas otherwise, the ranking was similar. Regardless, the results concerning the variation on top of a trend (fluctuations) were consistent across the analysis approaches (Supplementary file 6).
Synthesis of the results from a clinical perspective
Table 3 Table 3 describes the pain characteristics expected during the prior 52-weeks of a participant selecting each VPT class. In general, there was a substantial variation in the pain characteristics of the 52-week LBP course within a VPT class, and the difference in the distribution between a VPT class and the whole population was often not very pronounced. This means that knowing the VPT did not provide distinct information about the prospectively reported course, although, for some VPTs valuable information was obtainable concerning pain frequency and intensity. For example, in participants choosing Single episode/Recovered, the 80% range of the relative frequency of weeks with pain ranged only from 0% to 31%. In contrast, in the whole population, it ranged from 0% to 100%, and in participants choosing Persistent severe, the 80% range of the average pain intensity in weeks with pain ranged from 4.9 to 6.8 in contrast to 2.0 to 5.7 in the whole population.
Discussion
This study investigated the degree to which conclusions about the individual LBP course (assessed by weekly SMS data) can be drawn based on a people with LBP retrospectively characterizing their trajectory via choosing a VPT class. The investigation was based on studying the distribution of certain characteristics of the LBP course within and across the VPT classes.
Systematic differences between the classes were observed concerning pain intensity and frequency. However, there was substantial variation within each VPT class. Distinct differences in characteristics related to episodes or fluctuation could not be observed. Therefore, from a clinical perspective, we conclude that VPT classes cannot be used as a proxy for the LBP course and - that VPTs provide only limited direct information on LBP courses.
While not directly explored, our results suggest that people with LBP do not recognize established LBP patterns used in the VPT classes (episodic, fluctuating, and persistent). This was most visible in the inspection of the raw data, which indicated a frequent mismatch between patterns observable in the SMS data and the VPT class chosen. In this cohort, participants rarely reported that they did not recognize their pattern among the presented VPT, implying that they could match their experienced courses to these VPT classes. Further, we previously demonstrated that specific transitions between VPT classes over time were associated with changes in pain and disability.34 Taken together, this suggests that VPTs should be interpreted as meaningful information on the subjective experience of the LBP course, which can differ from observable LBP courses.
It has previously been demonstrated that prospectively identified LBP trajectories relate to many pain characteristics, with low-intense patterns being milder in all aspects than high-intensity patterns and episodic LBP being milder than fluctuating and persistent patterns. [23] Thus, the presence of pain-free periods indicates a less severe condition. However, the results of this study suggest that many people with LBP recalling their pain as episodic did not have pain-free periods (defined as 4 weeks with NRS <2). This implies that they either did not consider or understand the difference between episodic and fluctuating patterns, or they perhaps recalled periods with low pain inference but pain intensity above 1 as pain-free when describing their perceived course. This would align with a Delphi-derived definition of LBP episodes, suggesting that an episode is not present until the pain intensity exceeds NRS = 2.37 It may also be that they recalled shorter pain-free periods as lasting 4 weeks. To make the consequences of our chosen definitions transparent, we have made all individual SMS-captured data points available (https://caspernim.shinyapps.io/lbptrajectory/).
Further, an observed “mismatch” between VPT and SMS measured patterns was that recall did not reflect measured fluctuations. This may be surprising, considering that persistent and fluctuating pain could represent very different pain experiences. This may indicate that people with LBP do not recognize their experience of fluctuating pain in the VPTs, or the weekly measures may pick up fluctuations that are merely noise and not important to the experiences. This supports prior qualitative work, which similarly shows that people with LBP did not describe weekly variations in pain intensity as fluctuating pain. [19]
The apparent discrepancies between VPTs and weekly measures of pain were not explained by recall bias. Instead, the “mismatches” may indicate that choice of VPT classes captures features that extend beyond traditional pain intensity and pain offset captured by the weekly pain measures. Hence, the VPT classes reported may have a value on their own, which merits investigation in further research.
In this cohort, ongoing LBP was almost always fluctuating rather than persistent at a stable level. This is similar to prior findings that “ongoing and fluctuating subgroups might be collectively considered ongoing LBP with or without fluctuations”. [23] However, given our low participant numbers for the Severe VPT class, such a finding requires confirmation in samples that include a higher number of severely affected people.
A direct comparison is not possible between our results and those by Dunn et al. who evaluated agreement between the VTQ-Pain and latent class analysis-derived patterns in general practice. [10] We found a poorer match between the VPT and the actual course. However, this can be partially due to our stricter criteria for a “match”, as individual patterns within the latent classes will show some variation, and previously considered matches do not require that the VTQ-Pain reflects specific course characteristics. [27] Subtle differences existed between the VPT we used and the VTQ-Pain.10 In summary, VPTs seem, to some degree, to reflect groups with distinct and differing LBP courses, but do not reflect the detailed LBP courses we attempted to capture here.
We allowed participants to select an Unrecognized VPT not included in the VTQ-Pain, but around 90% of the participants recognized a specific VPT. The images used to illustrate the VPT classes differed between our study and past work by Dunn et al, particularly for the persistent VPT classes. Specifically, persistent pain was illustrated by a straight line, whereas the VTQ-Pain displayed a slight fluctuating line. This likely provided little distinction for participants as this class was selected by the minority in both studies. Differences may have occurred between our studies for Fluctuating categories based on these graphic differences but also potentially due to differences in wording. The VTQ-Pain explicitly asks participants to recall fluctuating LBP (“back pain can change over time, with pictures to show how their pain might go up or down … pick the one option that you think comes closest to how your pain has been over the last year”). In comparison, the VPT we used had neutral language without much direction (“choose the option that best describes how your back has been over the last year”). Therefore, participants completing the VTQ-Pain may better recognize fluctuations given these differences. Finally, differences in our two studies’ finding may also reflect differing participant populations (general practice versus chiropractic practice [18]). It is unknown how population differences may have impacted the findings of the different tools.
Clinical and research perspectives
People with LBP choices of VPT cannot be used as a proxy for the actual course but appear related to aspects of the experienced pain intensity and pain frequency during the previous year. Although not capturing the nuanced details of the experienced LBP course, VPT classes may provide important information about patients’ perceptions of their LBP condition. This implies that clinicians can still use VPT to inform a dialogue about patients’ perceptions of their condition. However, researchers should try to understand why patients recall or perceive similar prospectively registered trajectories differently. Future research should involve consumers (e.g., people with LBP) to clarify whether the VPT reflects another “reality” or whether VPT classes require updating to better reflect the lived experience. On the other side, researchers should try to understand why people with LBP recall or perceive similar prospectively registered trajectories differently. Future research should involve consumers (e.g., people with LBP) to clarify whether the VPT reflects another “reality” or whether they have to be updated to reflect the lived experience better. Moreover, questions remain: what may differ between those selecting different VPTs having experienced similar pain patterns? What role may VPT classes play in patient communication, treatment, and prognosis of LBP in a reliable, evidence-based manner?
Methodological limitations
One limitation of our study relates to the representativeness of our sample. Only 52% of our sample had sufficient SMS and VPT class data to be included in the analysis. The non-responder analysis revealed that those not included had a higher risk profile, lower back beliefs, and longer pain duration at baseline. It cannot be excluded that this selection influences the observed associations. [14] However, we have no reason to believe that participants with a better agreement between the VPTs and the SMS tracking were less willing to answer SMS’s or participate in the study. The drop-out profile does imply that participants likely to select the more severe classes were lost more frequently, making the results related to severe persistent pain more uncertain.
Our study is based mainly on acute chiropractic patients, which is not representative of all people with LBP that seek care. It cannot be excluded that people with LBP experiencing the same pain patterns over a more extended period tend to align VPTs to the prospective trajectories to a higher degree. Such sample characteristics may have also partly contributed to differing results from past work (Dunn et al.) given the latter’s recruitment of participants from general practice. [10]
It is possible that limitations in pain recall underlying poor matching of the chosen VPT and the actual course of pain during a year. Past work has shown that pain recall may be more influenced by recent events. [22, 36] Thus, recently experiencing an increase in pain as part of a fluctuating process, a relapse, or a flare-up just prior to VPT class selection may incline patients to select a VPT that reflects the recent pain increase rather than the entire pain course (over 12 months). Further, recent changes may be more memorable based on the magnitude and/or duration of pain increase as well as the risk profile of the patient. However, we obtained very similar results when restricting our analysis to only data from the final 13 weeks, suggesting that recency-biased recall was unlikely to underlie our results. Similarly, while it cannot be excluded that patients’ decisions were influenced by the number of days with pain instead of the pain intensity, our sensitivity analyses evaluating pain frequency found very similar results to that of pain intensity.
Another consideration is that participants rated their VPTs at follow-up. While this is sufficient to answer our research question and refers to a situation where people with LBP look back 52 weeks, clinicians would typically be informed about the trajectory from the VPTs at the point of consultation. We do not know if VPTs would be interpreted differently if presented during an initial visit for a flare-up or following recovery from a flare-up.
Despite multiple attempts to capture fluctuations in this longitudinal data, we could not capture differences between VPT classes representing persistent/stable or fluctuating pain. It cannot be excluded that other measures of fluctuation may better detect a difference (if present) or that we simply cannot measure this aspect using a single parameter. Alternatively, it may reflect that the fluctuations captured by weekly measures are “noise” and unimportant to most people with LBP. [19] Similarly, it might be necessary to consider combinations of pain intensity and frequency or to allow varying time windows from person to person to explain the choice. While the reliability of an 11-point numerical rating scale is good when tested four weeks apart in chronic pain and LBP populations, [4, 13] we do not know what the measurement error is when applying SMS pain-tracking. It might be that some fluctuating SMS trajectories actually represent persistent pain that appears to fluctuate as even the same person may rank the same pain intensity differently from week to week. Further, the definitions chosen to categorize data are also important, as we saw substantially fewer relapses when tailoring our definition to the individual’s average pain level (Definition B) as opposed to how relapses are typically defined. [37] Future research into VPT classes should consider these aspects of outcome measurement and data collection timing. However, even if we can explain the choice of VPT by more complex mechanisms, it remains valid that simple conclusions about the prospective trajectory cannot be drawn from knowledge of the retrospective VPT. Finally, our analysis was exploratory and data-driven, which involved multiple analyses. Given the exploratory nature of our study, we did not preregister the analysis plan. If future studies aim to test specific hypotheses, preregistering the analysis plan would be a feasible approach.
Conclusion
The visual pain trajectories chosen by people with LBP to illustrate their 1-year course of LBP reflected the experienced pain intensity. However, the pain patterns (episodic, fluctuating, and persistent) were not systematically recognized, and the experienced course varied amongst participants within the same VPT. This implies that the VPTs are related to some aspects of the experienced low back pain course but are not a proxy for the SMS measured trajectories. Apparent mismatches between the experienced course of low back pain and the choice of VPT class warrant further investigation.
Appendix A. Supplementary material
CRediT authorship contribution statement
CGN: Conceptualization, Formal Analysis, Funding Acquisition, Investigation, Writing – Original Draft Preparation, WV: Conceptualization, Formal Analysis, Investigation, Supervision, Writing – Review & Editing, AD: Conceptualization, Investigation, Writing – Review & Editing, AK: Conceptualization, Funding Acquisition, Investigation, Supervision, Writing – Review & Editing.
Acknowledgments
We want to acknowledge all the patients and clinicians who helped make these cohorts a reality. Thanks to research assistant Gitte Jakobsen for day-to-day contact with the clinics and to OPEN patient data Exploratory Network for access to REDCap and technical support. We would also like express our gratitude to the reviewers and the Editor for their valuable feedback throughout the peer-review process.
Disclosures
This analysis was funded by The Danish Foundation for Chiropractic Research and Post-graduate Education (Grant no. A3461). Data collection and management of the database were funded by The Danish Foundation for Chiropractic Research and Post-graduate Education (Grant no. N5550). The conduct of the study was financed by a grant from The Danish Foundation for Chiropractic Research and Post-graduate Education.
AK’s position at the University of Southern Denmark has been financially supported by The Danish Chiropractic Fund for Research and Post Graduate Research. WV’s work at the Basel Academy has been financed by the Chiropractic Knowledge Hub. The authors declare no other conflicts of interest
Data statement
Application forms to use the described data for research projects are available from the Chiropractic knowledge hub (contact Orla Lund Nielsen [o.nielsen@kiroviden.sdu.dk]). The coding used for the analysis is available upon request to the corresponding author.
References:
L. Ahlstrom, A. Grimby-Ekman, M. Hagberg, L. Dellve
The work ability index and single-item question: Associations with
sick leave, symptoms, and health–a prospective study of
women on long-term sick leave
Scandinavian Journal of Work, Environment & Health, 36 (2010), pp. 404-412A.M. Boonstra, R.E. Stewart, A.J.A. Köke, R.F.A. Oosterwijk, J.L. et al.
Cut-Off Points for Mild, Moderate, and Severe Pain on the Numeric
Rating Scale for Pain in Patients with Chronic Musculoskeletal Pain:
Variability and Influence of Sex and Catastrophizing
Frontiers in Psychology, 7 (2016), p. 1466Chang W., Cheng J., Allaire J.J., Sievert C., Schloerke B. et al.
Shiny: Web Application Framework for R [Internet]. 2021. Available from:
https://CRAN.R-project.org/package=shiny
Accessed July 7th, 2022.J.D. Childs, S.R. Piva, J.M. Fritz
Responsiveness of the numeric pain rating scale in patients with low back pain
Spine, 30 (2005), pp. 1331-1334N. Costa, M.L. Ferreira, J. Setchell, J. Makovey, T. Dekroo, A. Downie, A et al.
A Definition of "Flare" in Low Back Pain: A Multiphase Process Involving
Perspectives of Individuals With Low Back Pain and Expert Consensus
The Journal of Pain, 20 (2019), pp. 1267-1275T. da Silva, P. Macaskill, A. Kongsted, K. Mills, C.G. Maher, M.J. Hancock
Predicting pain recovery in patients with acute low back pain:
Updating and validation of a clinical prediction model
European Journal of Pain, 23 (2019), pp. 341-353R.A. Deyo, M. Bryan, B.A. Comstock, J.A. Turner, P. Heagerty, J. et al.
Trajectories of symptoms and function in older adults with low back disorders
Spine, 40 (2015), pp. 1352-1362Downie, AS, Hancock, MJ, Rzewuska, M, Williams, CM, Lin, CW, and Maher, CG.
Trajectories of Acute Low Back Pain: A Latent Class Growth Analysis
Pain. 2016 (Jan); 157 (1): 225–234Dunn, K.M., Campbell, P., and Jordan, K.P.
Long-term Trajectories of Back Pain: Cohort Study With 7-year Follow-up
BMJ Open. 2013 (Dec 11); 3 (12): e003838Dunn KM, Campbell P, Jordan KP.
Validity of the Visual Trajectories Questionnaire for Pain
J Pain 2017 (Dec); 18 (12): 1451–1458Dunn KM, Jordan K, Croft PR.
Characterizing the Course of Low Back Pain:mbr> A Latent Class Analysis
American J Epidemiology 2006 (Apr 15); 163 (8): 754–761E. Elm, D.G. von, Altman, M. Egger, S.J. Pocock, P.C. Gřtzsche
STROBE Initiative: The Strengthening the Reporting of Observational
Studies in Epidemiology (STROBE) statement:
Guidelines for reporting observational studies
Lancet, 370 (2007), pp. 1453-1457P. Euasobhon, R. Atisook, K. Bumrungchatudom, N. Zinboonyahgoon, N.
Reliability and responsivity of pain intensity scales
in individuals with chronic pain
Pain, 163 (2022), pp. e1184-e1191M.M. Finnern, D. Kleinböhl, H. Flor, J. Benrath, R. Hölzl
Deconstructing chronicity of musculoskeletal pain:
Intensity-duration relations, minimal dimensions
and clusters of chronicity
Scandinavian Journal of Pain, 18 (2018), pp. 363-377S. Grřn, R.K. Jensen, T.S. Jensen, A. Kongsted
Back beliefs in patients with low back pain: A primary care cohort study
BMC Musculoskeletal Disorders, 20 (2019), p. 578Hartvigsen J, Hancock MJ, Kongsted A, Louw Q, Ferreira ML, Genevay S, Hoy D, Karppinen J et al.
What Low Back Pain Is and Why We Need to Pay Attention
Lancet. 2018 (Jun 9); 391 (10137): 2356–2367
This is the second of 4 articles in the remarkable Lancet Series on Low Back PainHestbaek L, Leboeuf-Yde C, Manniche C.
Low Back Pain: What Is The Long-term Course?
A Review of Studies of General Patient Populations
European Spine Journal 2003 (Apr); 12 (2): 149–165Hestbaek L, Munck A, Hartvigsen L, Jarbol DE, Sondergaard J, Kongsted A.
Low Back Pain in Primary Care: A Description of 1250 Patients
with Low Back Pain in Danish General and Chiropractic Practice
Int J Family Med. 2014 (Nov 4); 2014: 106102L. Hestbaek, C. Myburgh, H.H. Lauridsen, E. Boyle, A. Kongsted
Contrasting Real Time Quantitative Measures (Weekly SMS) to Patients’
Retrospective Appraisal of Their One-year’s Course of Low Back Pain;
A Probing Mixed-methods Study
Chiropractic & Manual Therapies 2019 (Feb 26); 27: 12Hill JC, Dunn KM, Lewis M, et al.
A Primary Care Back Pain Screening Tool:
Identifying Patient Subgroups For Initial Treatment
(The STarT Back Screening Tool)
Arthritis and Rheumatism 2008 (May 15); 59 (5): 632–641S.J. Kamper, T.R. Stanton, C.M. Williams, C.G. Maher, J.M. Hush
How is recovery from low back pain measured?
A systematic review of the literature
European Spine Journal, 20 (2011), pp. 9-18Z. Karimi, A. Pilenko, S.M. Held, M.I. Hasenbring
Recall Bias in Patients with Chronic Low Back Pain:
Individual Pain Response Patterns Are More Important Than Pain Itself!
International Journal of Behavioral Medicine, 23 (2016), pp. 12-20Kongsted A, Hestbaek L, Kent P.
How Can Latent Trajectories of Back Pain be
Translated into Defined Subgroups?
BMC Musculoskelet Disord. 2017 (Jul 3); 18 (1): 285A. Kongsted, T.S. Jensen, K. Doktor, L. Hestbćk
Effects of weekly pain monitoring on back pain outcomes:
A non-randomised controlled study
Chiropractic & Manual Therapies, 29 (2021), p. 37Kongsted A, Kent P, Axen I, Downie AS, Dunn KM.
What Have We Learned From Ten Years of
Trajectory Research in Low Back Pain?
BMC Musculoskelet Disord. 2016 (May 21); 17 (1): 220Kongsted, A, Kent, P, Hestbaek, L, and Vach, W.
Patients With Low Back Pain Had Distinct Clinical Course Patterns
That Were Typically Neither Complete Recovery Nor Constant Pain.
A Latent Class Analysis of Longitudinal Data
Spine J. 2015 (May 1); 15 (5): 885–894A. Kongsted, A.M. Nielsen
Latent Class Analysis in health research
Journal of Physiotherapy, 63 (2017), pp. 55-58A. Kongsted, O.L. Nielsen, H.W. Christensen, J. Hartvigsen
The Danish Chiropractic Low Back Pain Cohort (ChiCo):
Description and Summary of an Available Data Source
for Research Collaborations
Clinical Epidemiology, 12 (2020), pp. 1015-1027E. Laerum, A. Indahl, J.S. Skouen
What is "the good back-consultation"? A combined qualitative and quantitative
study of chronic low back pain patients’ interaction with
and perceptions of consultations with specialists
Journal of Rehabilitation Medicine, 38 (2006), pp. 255-262H.H. Lauridsen, J. Hartvigsen, C. Manniche, L. Korsholm, N. Grunnet-Nilsson
Danish version of the Oswestry Disability Index for patients with
low back pain. Part 1: Cross-cultural adaptation, reliability
and validity in two different populations
European Spine Journal, 15 (2006), pp. 1705-1716L.G. Macedo, C.G. Maher, J. Latimer, J.H. McAuley, P.W. Hodges, W.T. Rogers
Nature and determinants of the course of chronic low back pain
over a 12-month period: A cluster analysis
Physical Therapy, 94 (2014), pp. 210-221Myhrvold BL, Irgens P, Robinson HS, Engebretsen K, Natvig B, Kongsted A, et al.
Visual Trajectory Pattern as Prognostic Factors for Neck Pain
European J Pain 2020 (Oct); 24 (9): 1752–1764National Scientific Ethics Committee:
What to notify? Available from:
http://en.nvk.dk/how-to-notify/what-to-notify
Accessed March 28, 2020.C.G. Nim, A. Kongsted, A. Downie, W. Vach
Temporal stability of self-reported visual back pain trajectories
Pain, 163 (2022), pp. e1104-e1114D.L. Patrick, R.A. Deyo, S.J. Atlas, D.E. Singer, A. Chapin, R.B. Keller
Assessing health-related quality of life in patients with sciatica
Spine, 20 (1995), pp. 1899-1908C.D.N. Rasmussen, A. Holtermann, M.B. Jřrgensen
Recall Bias in Low Back Pain Among Workers: Effects of
Recall Period and Individual and Work-Related Factors
Spine, 43 (2018), pp. E727-E733T.R. Stanton, J. Latimer, C.G. Maher, M.J. Hancock
A modified Delphi approach to standardize low back pain recurrence terminology
European Spine Journal, 20 (2011), pp. 744-752O. Tamcan, A.F. Mannion, C. Eisenring, B. Horisberger, A. Elfering, U. Müller
The course of chronic and recurrent low back pain in the general population
Pain, 150 (2010), pp. 451-457H. Wickham, M. Averick, J. Bryan, W. Chang, L. McGowan, R. François, G.
Welcome to the Tidyverse
Journal of Open Source Software, 4 (2019), p. 1686C.M. Williams, J. Latimer, C.G. Maher, A.J. McLachlan, C.W. Cooper, M.J
PACE - The first placebo controlled trial of paracetamol for acute
low back pain: Design of a randomised controlled trial
BMC Musculoskeletal Disorders, 11 (2010), p. 169
Return to LOW BACK PAIN
Return to TRAJECTORIES OF LOW BACK PAIN
Since 4-13-2023
| Home Page | Visit Our Sponsors | Become a Sponsor |
Please read our DISCLAIMER |