

National Trends in the Utilization and Expenditure of
Chiropractic Care in U.S. Adults: Analysis of the
2007-2016 Medical Expenditure Panel Survey
This section is compiled by Frank M. Painter, D.C.
Send all comments or additions to: Frankp@chiro.org


FROM: J Manipulative Physiol Ther 2024 (Sep 27): S0161-4754(24)00044-7 ~ FULL TEXT
OPEN ACCESS Baojiang Chen, PhD • Henry S. Brown, PhD • David Douphrate, PhD
Jud Janak, PhD • Kelley Pettee Gabriel, MS, PhD
Trent Peng, PhD, DC
Department of Biostatistics,
University of Texas Health Science Center at Houston,
School of Public Health in Austin,
Austin, Texas.

Objective: This study aimed to examine the trends in the utilization and expenditure of chiropractic care in a representative sample of US adults, aged ≥18 years.
Methods: Serial cross-sectional data (2007-2016) from the Medical Expenditure Panel Survey (MEPS) were examined. Weighted descriptive statistics were analyzed to obtain national estimates of chiropractic utilization and expenditure, and time-series linear regression was used to assess trends over time. Socio-demographic characteristics and musculoskeletal diagnoses associated with chiropractic use were also reported.
Results: A statistically significantly increasing trend was observed for the number of adults receiving chiropractic care (p < .05), number of visits (p < .05) and utilization rate (P < .05) from 2007 to 2016. A similar trend was not found for chiropractic expenditure during this period (P > .05). The mean number of visits was 8.3 visits per year, with a mean expenditure of $86.94 USD per visit and $721.43 USD per person per year. Mean age of adult chiropractic users each year ranged between 48.6 and 51.2 years old, and users were primarily female (56.3%–60.4%), White persons (90.1%–93.5%), and privately insured (77.3%–82.8%). The most prevalent musculoskeletal diagnoses associated with chiropractic use were low back conditions (45.4%–58.1%), inflammatory/degenerative disc or joint conditions (21.2%–26.8%) and head and neck complaints (9.8%–13.7%).
Conclusion: The findings showed statistically significant increasing trends for the number of adult chiropractic users, the number of visits, and percent utilization of chiropractic care from 2007 to 2016. Conversely, we found a statistically null trend for the total annual expenditure on chiropractic care during the same time period. Findings from this analysis imply that, while chiropractic care appears to be growing, it may still be under-utilized, and more efforts should be devoted to ensuring sustained growth and a larger role in the management of musculoskeletal health.
Keywords: Adults; Chiropractic; Complementary therapies; Integrative medicine.
From the FULL TEXT Article:
Introduction
The prevalence of musculoskeletal conditions has been steadily rising in recent years. Globally, an estimated 1.71 billion people experience musculoskeletal disorders in 2019. [1] Among the musculoskeletal conditions, low back pain (LBP) is the most common, representing the most prevalent condition in 134 of the 204 countries studied. [1] Lifetime prevalence of LBP in adults worldwide is approximately 40%, while 12–month prevalence is approximately 23%. [2] The burden of the highly prevalent LBP on society has been demonstrated in the Global Burden of Disease (GBD) study, an ongoing examination of the burden of specific health conditions on the global population. [3]
When the 369 diseases included in the 2019 GBD study were ranked by Disability-Adjusted Life Years (DALY), a measure that combines years lost due to premature death and years of life lost due to disability (YLDs), LBP ranked 9th, accounting for 2.5% of the total DALYs. [3] When YLDs were used as the sole measure, LBP ranked first, accounting for 7.1% of all YLDs. The persistent, disabling, and chronic nature of LBP contributes to the high associated costs. The annual medical costs in the treatment of LBP and neck pain were approximately 134 billion United States Dollars (USD) in 2016, the highest among the 154 conditions analyzed, surpassing costly non-musculoskeletal conditions such as diabetes. [4] Considering the high prevalence, disease impact, and high costs, clinically effective treatment options for LBP deserves increased attention.
Traditional medical care for LBP typically involves pharmaceutical interventions, such as paracetamol (Tylenol), non-steroidal anti-inflammatory drugs, skeletal muscle relaxants, anti-depressants, or opioids. [5, 6] However, these pharmaceutical interventions are either found to be ineffective for LBP in clinical trials, or do not have sufficient evidence to support its use in the treatment of LBP. [7] Additionally, given the ongoing opioid epidemic in the U.S., and the need to discourage opioid prescription, alternative, non-pharmaceutical treatment options for musculoskeletal conditions are being explored.
Chiropractic care is one of the most utilized complementary and integrative health (CIH) approaches in the United States (U.S.). [8] Chiropractors treat a variety of musculoskeletal complaints, with the majority being spinal complaints such as neck pain and LBP. [9] Chiropractors adopt a conservative, drug-free approach to patient care, using therapies such as spinal manipulation, physical therapeutic modalities, rehabilitative exercises, and diet and physical activity recommendations. [10, 11] The primary treatment option in chiropractic care, spinal manipulation, has shown efficacy for the treatment of LBP in several clinical trials. [11–13] Therefore, chiropractic care may be helpful in mitigating the current musculoskeletal and opioid epidemic, and its utilization should be further explored. However, studies reporting trends in the utilization and expenditure of chiropractic care in adults are scarce, creating a knowledge gap. [14–16]
Therefore, to fill this knowledge gap, the purpose of this study was to examine the trends in the utilization and expenditure of chiropractic care in a representative sample of US adults, aged ≥18 years.
Based on prior research studies, we hypothesized:1) an increase in the utilization of chiropractic care from 2007 to 2016,
2) an increase in the expenditure of chiropractic care from 2007 to 2016, and
3) adult chiropractic users in the U.S. would primarily be middle aged or older, female sex, White persons, and presenting with LBP or neck pain. [14, 17]
Methods
A secondary data analysis using the Medical Expenditure Panel Survey (MEPS), from 2007 to 2016 was conducted.
Study Design
The MEPS is a large-scale, ongoing collection of healthcare use data from U.S. households since 1996, conducted by the Agency for Healthcare Research and Quality, part of the U.S. Department of Health and Human Services. The primary purpose of MEPS is to sample the general U.S. population and derive nationally representative estimates of healthcare use, costs, and health insurance coverage. Specific information on healthcare use was self-reported by a designated person in the household through computer assisted personal interview, and the collected data were then verified with the healthcare providers to ensure accuracy. Each year, a new cohort (ie, panel) is selected from the respondents to the previous year's National Health Interview Survey. Each panel of participants is followed for a period of 2 years and interviewed a total of five times (rounds). Due to the special design with 2 years of follow-up, two panels are thus included in each annual file. For the purpose of this study, only adults aged 18 years and older were included in the analysis. This study was a secondary data analysis using the publicly available MEPS database. The study proposal was sent to the Committee for the Protection of Human Subjects at the University of Texas Health Science Center (Houston, TX) for review and was exempted from oversight.
Data Collection
The full-year consolidated files of MEPS were used to evaluate trends of chiropractic utilization and expenditure in the 10–year period (2007–2016). The MEPS full-year consolidated file includes specific information on healthcare use throughout the year, such as the type of providers visited, frequency of visits, total charges (eg, amount charged by the healthcare provider for services provided), and total expenditure (eg, amount paid out-of-pocket by the respondent and/or the insurance company). Additional information collected in the full-year consolidated file includes the respondent's demographic and socio-economic characteristics, region of residence, health status, and insurance coverage. For the purpose of this study, if a respondent stated seeing a chiropractor in the past 12 months, specific information related to number of chiropractic visits and costs would then be queried and recorded in the full-year consolidated file. In addition to data on chiropractic expenditure and utilization, basic demographic characteristics (ie, age, sex, race and ethnicity) and insurance status (eg, privately insured, publicly insured, or uninsured) of the chiropractic users were collected in order to assess basic utilization patterns in the adult population.
Information on the medical condition associated with chiropractic utilization was found in the Medical Condition (MC) file. Specifically, the respondent's unique identification number, which is assigned by MEPS, was used to link the MC file with the Office-Based Provider Visit file, which contains expenditure and provider type information for each office visit, in order to determine the diagnosis associated with the chiropractic visit. The MC file records medical diagnosis codes using the International Classification of Diseases (ICD) codes, 9th (pre-2015) or 10th (2016 and beyond) edition. Due to protection of participant confidentiality, the ICD-9 codes were truncated to three digits, which limit specificity of the diagnosis. Considering that chiropractors primarily treat musculoskeletal conditions, non-musculoskeletal ICD-9 codes were excluded. Also, with the transition to ICD-10 codes by MEPS in 2016, merging datasets containing ICD-9 and ICD-10 diagnostic codes would create challenges. Therefore, the 2016 data were excluded from the analysis that examined the medical condition associated with chiropractic visits. Information on the specific musculoskeletal ICD-9 codes included in the analysis can be found in the Supplemental file.
Statistical Analysis
MEPS utilizes a multi-stage, complex sampling design and uses the oversampling feature to sample minority populations. [18] To account for the specific sampling techniques and selection probabilities, MEPS has provided person-level sample weights for analysis. In all analyses, sample weights were applied to ascertain accurate national representativeness of the civilian and non-institutional U.S. population. Weighted frequencies and proportions were estimated for each included variable to obtain national estimates.
Chiropractic utilization rate was calculated by dividing the number of adult chiropractic users (defined as having at least 1 recorded chiropractic visit) by the total number of respondents. A linear regression with study year as the covariate was conducted to examine linear trends of chiropractic utilization rate and expenditure from 2007 to 2016. Linear regression with number of adult respondents as the dependent variable was performed to determine associations with population growth on utilization and expenditure. The measures of association were reported as beta-coefficients (β), 95% confidence intervals (CI) and P-value for statistical significance. We used the Consumer Price Index (CPI) from the Bureau of Labor Statistics to adjust the expenditure data for inflation, using 2016 USD figures. [19]
The main statistical analysis was performed using STATA software, version 13 (Stata Corp LLC). A 2–sided Type I error level of 0.05 was used to determine statistical significance.
Results

Table 1
page 4The analytic sample is described in Table 1, which includes socio-demographic and access-to-care characteristics. The overall number of chiropractic users ranged from a minimum of 11.9 million (2008) to a maximum of 15.3 million (2013) persons per year. The mean age of chiropractic users ranged from a minimum of 48.6 years old (2007) to a maximum of 51.2 years old (2014). The adult chiropractic users were predominantly female [minimum and maximum across years: 56.3% (2015), 60.4% (2014)] and White persons [90.1% (2015), 93.5% (2009)]. Most of the chiropractic users were privately insured [77.3% (2007), 82.8% (2016)]. Also, privately insured individuals had the highest utilization rate [6.0% (2007), 7.8% (2013)], compared to the publicly insured or uninsured.
Table 2
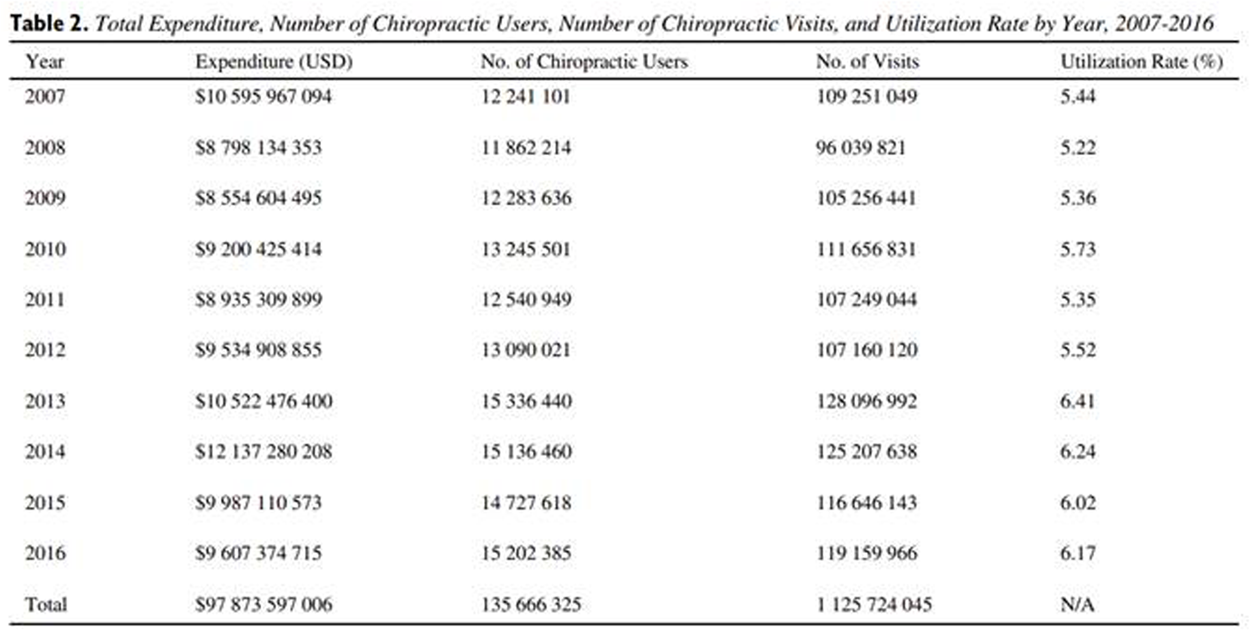
Table 3 Table 2 presents the total expenditure, number of chiropractic users, number of chiropractic visits, and utilization rate for chiropractic care by year, from 2007 to 2016. Annual expenditure on chiropractic care (adjusted for inflation) in adults ranged from $8.6 billion in 2009 to $12.1 billion in 2014. The number of chiropractic users ranged from a minimum of 11.9 million persons (2008) to a maximum of 15.3 million persons (2013). In terms of the total number of chiropractic visits, the minimum number was 96.0 million visits (2008), and the maximum was 128.1 million visits (2013). With utilization rate, the lowest percentage found was 5.22% (2008), while the highest was 6.41% (2013). Based on the accumulated data, the mean number of visits per person was 8.3 visits per year. Also, the mean expenditure per visit and total annual expenditure per user was $86.94 USD and $721.43 USD, respectively.
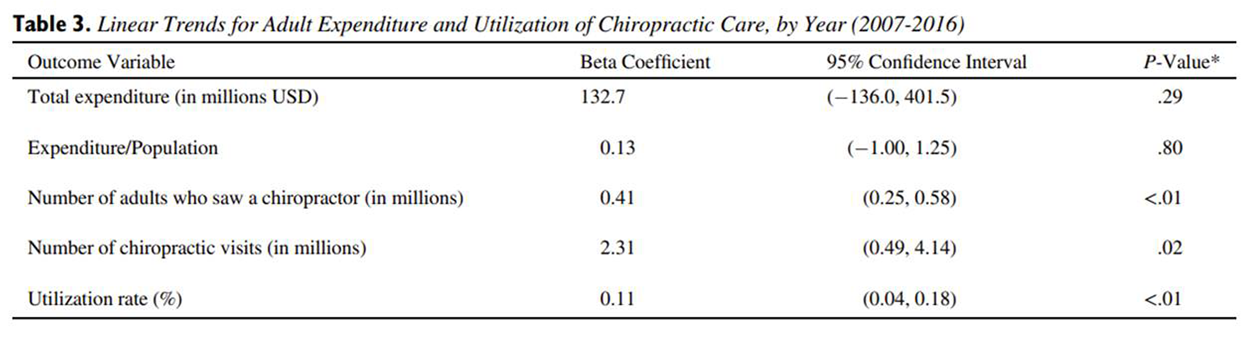
Results from the trend analysis using the time-series linear regression model are shown in Table 3. Statistically significant linear trends were observed with the number of chiropractic users (β = 0.41 million, 95% CI: 0.25–0.58 million persons), as well as the number of chiropractic visits (β = 2.31 million, 95% CI: 0.49–4.14 million visits). A statistically significant increasing trend was also found with utilization rate of chiropractic care (β = 0.11%, 95% CI: 0.04–0.18%). The linear trend for total annual expenditure on chiropractic care and expenditure over population between 2007 and 2016 were both statistically null (P > .05).
Table 4
page 6The frequency and percentage of ICD-9 diagnoses corresponding with each chiropractic visit from 2007 to 2015 are listed in Table 4. The distribution of diagnoses was generally consistent across years with only minor fluctuations. The most prevalent musculoskeletal complaint (minimum and maximum percentage across years) seeking chiropractic care was low back conditions [45.4% (2008), 58.1% (2011)], followed by inflammatory/degenerative joint or disc conditions [21.2% (2011), 26.8% (2014)], head/neck conditions [9.8% (2011), 13.7% (2009)], soft-tissue conditions [5.3% (2007), 15.0% (2008)], curvature of the spine [2.4% (2008), 6.7% (2013)], and non-spinal strain/sprain [1.0% (2011). 4.3% (2007)].
Discussion
In this study, we examined the trends of utilization and expenditure for chiropractic care and characteristics of chiropractic users, using an analytic sample representative of U.S. adult population. Three key findings were observed from the results. First, there was no difference in total expenditure for chiropractic care from 2007 to 2016, after adjusting for inflation. Second, a statistically significant trend suggesting an increase in the number of chiropractic users, number of visits, and utilization rate for chiropractic care were found over the same 10–year period. Third, chiropractic users during this period were primarily female sex, White persons, privately insured, and with a diagnosis of back disorders. A discussion of these major findings follows.
The total annual expenditure on chiropractic care in U.S. adults did not increase significantly from 2007 to 2016, which is a novel finding when considering prior studies observed a significant increase in spending on chiropractic care during earlier periods (2002 to 2008, [20] and 1997 to 2016). [15] One possibility for the observed expenditure pattern is the economic recession that occurred in the U.S. in the late 2000s, which coincided with the study period. [21] The economic downturn might have affected affordability of chiropractic care, resulting in reduced spending. This is supported by a study by Clarke et al. [22] that revealed an overall reduction in the utilization of CIH approaches in adults from 2007 to 2012. Additionally, a sharp increase in utilization and expenditure data was observed in our study after 2012, suggesting a rebound from the Great Recession around that time (signaled by the recovery of the real Gross Domestic Product to pre-recession levels in mid-2011), [23] and/or expanded healthcare coverage from the Patient Protection and Affordable Care Act, introduced in the second quarter of 2010. [24]
However, another possible explanation for the observed trend may be the declining insurance reimbursements for healthcare in general, since expenditure equals the total amount of payment by the patient and/or the insurance company. This is evidenced by a study which demonstrated decreased Medicare reimbursement for physician services in which Medicare reimbursement for physician services decreased at an average rate of 1.61% from 2000 to 2020. [25] Overall, this trend in expenditure is likely a reflection of the circumstances at the time, and expenditure on chiropractic services should be expected to grow in the future.
The number of chiropractic users and number of visits increased statistically significantly over the 10–year period (2007–2016), no differences found across years for total annual expenditure. As previously stated, these metrics may infer growth and increased popularity of chiropractic care in the U.S. However, alternative explanations for the increased number of chiropractic users are also possible, such as increased out-of-pocket allopathic costs. With the advent and increased popularity of high-deductible health plans offered by employers in recent years, patients are faced with steadily increasing out-of-pocket healthcare costs. Dieleman et al. [4] examined the trends of expenditure in the U.S. for 154 health conditions from 1996 to 2016, and found statistically significant increases in out-of-pocket expenditures for low back and neck pain, at an annualized rate of 4.6% per year. Since out-of-pocket expenditures on standard medical treatments (ie, pharmaceuticals, injections, and surgery) for musculoskeletal complaints are generally higher than those spent on CIH approaches, patients with these conditions may be more inclined to use CIH treatments, such as chiropractic care, as a substitute to the more expensive conventional medical treatments. Therefore, even though demand for chiropractic care may have increased, it is unclear whether the demand is due to increased popularity, or chiropractic care being a more financially affordable substitute (or a combination of both).
Utilization rate is another metric to measure growth in chiropractic care in this study. Our analysis on utilization rate for chiropractic care showed a statistically significant increase from 2007 to 2016. With an aging U.S. population (i.e. the baby boomers reaching retirement age between 2011 and 2029) and the projected increase in people with chronic back pain, utilization and expenditure on healthcare associated with the care of LBP is expected to accelerate. [26] In fact, the current available data for U.S. healthcare expenditure already illustrates this trend; the health condition with the highest amount of spending in 2016 was low back and neck pain ($134 billion, 95% CI: $122.4, $146.9 billion). [4]
As previously stated, current evidence underscores the ineffectiveness of conventional medicine in addressing spinal pain, and prescription of opioids for pain poses the additional risk for overuse. In contrast, chiropractic care not only has shown effectiveness in addressing spinal complaints, but also shows promise in reducing long-term healthcare costs compared to those treated with opioid analgesics. [27] Moreover, chiropractic care may help prevent opioid overuse, as chiropractic users have shown reduced odds of opioid prescription than non-recipients. [28]
These studies further strengthen the argument for expanded chiropractic utilization. While the increasing utilization rate for chiropractic care from our analysis is encouraging to the chiropractic profession, the rates (5.22%–6.41%) are similar to, if not slightly lower, than the utilization estimates from other studies in the current study period or prior to 2007 (7.5%–9.1%). [9, 14, 29, 30] These differences might be attributable to dataset and study design (ie, inclusion of osteopathic manipulation vs. chiropractic care alone; global vs. U.S. rates). Still, the level of increase in chiropractic utilization rate over the 10–year period, while statistically significant, appears small, and may not meet the anticipated exponential demand for LBP care. Therefore, both the chiropractic profession and healthcare policymakers should prioritize ways to improve chiropractic utilization in the general U.S. population. For example, both our study and prior research have shown that chiropractic users are consistently of a certain demographic profile (ie, female sex, White persons). [9, 14, 31]
Also, our analysis showed that the publicly insured and uninsured individuals had lower utilization rates, compared to those privately insured. Therefore, efforts to further research and address the disparities to access chiropractic care should be promoted. Further, more efforts should be devoted to educating the public on accessing chiropractic care, encouraging multidisciplinary management of LBP and cross-referrals among medical providers and chiropractors, increasing the evidence base for chiropractic care, and advocating for the expansion of insurance coverage for chiropractic care.
Strengths
Several strengths exist in this study. First, the MEPS uses a large sample and complex sampling design that incorporates sample weights to ensure the analytic sample representative of the US adult population.
Second, expenditure data were collected with structured, computer-assisted personal interviews and verified with medical providers to improve accuracy of the collected data.
Third, our statistical analysis adjusted for the effects of inflation and population growth when evaluating chiropractic expenditure, thus allowing more accurate expenditure estimates.
Limitations
First, self-reported expenditure on chiropractic care can be prone to recall errors, resulting in inaccurate data. To remedy this issue and minimize errors, personnel from the MEPS also verify the collected expenditure data with the medical provider delivering the service.
Second, while this serial cross-sectional study is effective in analyzing utilization trends, it is a descriptive, observational study and therefore there remains a potential for residual confounding.
Third, MEPS is a U.S. general population survey. Therefore, results from this analysis are not representative of other nations.
Fourth, the ICD-9 codes provided in the public-use MC files of the MEPS are truncated to three digits, thus limiting accurate assessment of the diagnoses related to seeking chiropractic care.
Fifth, we did not find any diagnosis of segmental dysfunction (ICD-9 code 739) in the analyzed data, a diagnosis commonly used by chiropractors. The reason for the exclusion in the MC files was not provided in the dataset documentation. However, we do not believe this exclusion resulted in the exclusion of corresponding expenditure data in the full-year consolidated file, as the expenditure data were verified with chiropractors’ offices and collected independent of medical diagnoses. However, similar to the fourth limitation, interpretation of the medical diagnoses associated with chiropractic care should be with caution, given this limitation.
Finally, the 2016 MC file contains the updated ICD-10 diagnosis codes and were excluded from the medical conditions section of the analysis to prevent errors with translating to ICD-9 codes.
Future Studies
Future prospective research should examine the factors associated with chiropractic utilization and expenditure. Future studies should also assess disparities in the access to chiropractic care in order to decrease the societal burden of musculoskeletal conditions such as low back pain.
Conclusion
This study examined the trends of chiropractic utilization and expenditure using a nationally representative sample of U.S. adults above 18 years old. Overall, our analysis showed statistically significant increasing trends for the number of adult chiropractic users, the number of visits, and percent utilization of chiropractic care from 2007 to 2016. Conversely, we found a statistically null trend for the total annual expenditure on chiropractic care during the same time period. Findings from this analysis imply that, while chiropractic care appears to be growing, it may still be under-utilized, and more efforts should be devoted to ensuring sustained growth and a larger role in the management of musculoskeletal health.
Practical Applications
Our analysis revealed the utilization and expenditure patterns for chiropractic care in adults
Recent 10–year trends suggest significant overall increases in number of chiropractic users, number of visits, and percent utilization
Total expenditure for chiropractic visits did not significantly increase from 2007 to 2016
Mean age of chiropractic users ranged between 48.6 and 51.2 years old, and were primarily female, White, and privately insured.
Contributorship Information
Concept development (provided idea for the research): T.P., K.P.G.
Design (planned the methods to generate the results): T.P., B.C., H.S.B., K.P.G.
Supervision (provided oversight, responsible for organization and implementation, writing of the manuscript): K.P.G., D.D., J.J.
Data collection/processing (responsible for experiments, patient management, organization, or reporting data): T.P.
Analysis/interpretation (responsible for statistical analysis, evaluation, and presentation of the results): T.P., B.C., H.S.B., K.P.G., D.D., J.J.
Literature search (performed the literature search): T.P.
Writing (responsible for writing a substantive part of the manuscript): T.P.
Critical review (revised manuscript for intellectual content, this does not relate to spelling and grammar checking): B.C., H.S.B., K.P.G., D.D., J.J.
Funding Sources and Conflicts of Interest
No funding sources or conflicts of interest were reported for this study.
References:
Cieza, A, Causey, K, Kamenov, K.
Global estimates of the need for rehabilitation based on the Global
Burden of Disease study 2019: a systematic analysis for
the Global Burden of Disease Study 2019
Lancet. 2020; 396:2006-2017Manchikanti, L, Singh, V, Falco, FJE.
Epidemiology of low back pain in adults
Neuromodulation. 2014; 17:3-10Abbafati, C, Abbas, KM, Abbasi-Kangevari, M.
Global burden of 369 diseases and injuries in 204 countries and
territories, 1990–2019: a systematic analysis for the
Global Burden of Disease Study 2019
Lancet. 2020; 396:1204-1222Dieleman, JL, Cao, J, Chapin, A.
US Health Care Spending by Payer
and Health Condition, 1996-2016
JAMA 2020 (Mar 3); 323 (9): 863–884Chou, R
Pharmacological management of low back pain
Drugs. 2010; 70:387-402Maher, C, Underwood, M, Buchbinder, R
Non-specific low back pain
Lancet. 2017; 389:736-747Chou, R, Deyo, R, Friedly, J.
Nonpharmacologic Therapies for Low Back Pain:
A Systematic Review for an American College
of Physicians Clinical Practice Guideline
Annals of Internal Medicine 2017 (Apr 4); 166 (7): 493–505Clarke, TC, Barnes, PM, Black, LI.
Use of yoga, meditation, and chiropractors among
U.S. adults aged 18 and over
NCHS Data Brief. 2018; 325:1-8Beliveau, PJH, Wong, JJ, Sutton, DA.
The chiropractic profession: a scoping review of utilization rates,
reasons for seeking care, patient profiles, and care provided
Chiropr Man Ther. 2017; 25:1-17Christensen, MG, Hyland, JK, Goertz, Christine, M.
Overview of Survey Responses
Practice Analysis of Chiropractic 2015.
National Board of Chiropractic Examiners, 2015 p. 76-85
Coulter, ID, Crawford, C, Hurwitz, EL.
Manipulation and Mobilization
for Treating Chronic Low Back Pain:
A Systematic Review and Meta-analysis
Spine J. 2018 (May); 18 (5): 866–879Ruddock, JK, Sallis, H, Ness, A.
Spinal manipulation vs sham manipulation for nonspecific
low back pain: a systematic review and meta-analysis
J Chiropr Med. 2016; 15:165-183Paige, NM, Miake-Lye, IM, Booth, MS.
Association of Spinal Manipulative Therapy With Clinical
Benefit and Harm for Acute Low Back Pain:
Systematic Review and Meta-analysis
JAMA. 2017 (Apr 11); 317 (14): 1451–1460Adams, J, Peng, W, Cramer, H.
The Prevalence, Patterns, and Predictors of Chiropractic
Use Among US Adults: Results From the 2012
National Health Interview Survey
Spine (Phila Pa 1976) 2017 (Dec 1); 42 (23): 1810–1816Davis, MA, Sirovich, BE, Weeks, WB
Utilization and expenditures on chiropractic care
in the United States from 1997 to 2006
Health Serv Res. 2010; 45:748-761Stevans, JM, Zodet, MW
Clinical, demographic, and geographic determinants of variation in
chiropractic episodes of care for adults using the
2005-2008 medical expenditure panel survey
J Manipulative Physiol Ther. 2012; 35:589-599Ndetan, H, Evans, MW, Hawk, C.
Chiropractic or Osteopathic Manipulation for Children
in the United States: An Analysis of Data from the
2007 National Health Interview Survey
J Altern Complement Med. 2012 (Apr); 18 (4): 347–353MEPS HC-192
2016 Full Year Consolidated Data File. 2018.Statistics USB of L. Consumer Price Index.
https://www.bls.gov/cpi/. Accessed March 10, 2019.Davis, MA, Martin, BI, Coulter, ID.
US Spending on Complementary and Alternative Medicine
During 2002-08 Plateaued, Suggesting Role
in Reformed Health System
Health Affairs 2013 (Jan); 32 (1): 45–52Travers, JL, Cohen, CC, Dick, AW.
The Great American Recession and forgone healthcare:
do widened disparities between African-Americans
and Whites remain?
PLoS One. 2017; 12, e0189676Clarke, T, Black, L, Stussman, B.
Trends in the use of complementary health approaches
among adults: United States, 2002–2012
Natl Health Stat Report. 2015; 79:2002-2012Investopedia team.
2008 Recession: what it was and what caused it.Manchikanti, L, Caraway, DL, Parr, AT.
Patient Protection and Affordable Care Act of 2010:
reforming the health care reform for the new decade
Pain Physician. 2024; 14:E35-E67Pollock, JR, Bollig, TR, Haglin, JM.
Medicare reimbursement to physicians decreased for common
emergency medicine services from 2000 to 2020
Ann Emerg Med. 2020; 76:615-620Smith, M, Davis, MA, Stano, M.
Aging Baby Boomers and the Rising Cost of Chronic Back Pain:
Secular Trend Analysis of Longitudinal Medical Expenditures
Panel Survey Data for Years 2000 to 2007
J Manipulative Physiol Ther. 2013 (Jan); 36 (1): 2–11Whedon, JM, Kizhakkeveettil, A, Toler, A.
Long-Term Medicare Costs Associated with Opioid
Analgesic Therapy vs Spinal Manipulative Therapy
for Chronic Low Back Pain in a Cohort of Older Adults
J Manipulative Physiol Ther 2021 (Sep); 44 (7): 519-526Corcoran, KL, Bastian, LA, Gunderson, CG.
Association Between Chiropractic Use and Opioid
Receipt Among Patients with Spinal Pain:
A Systematic Review and Meta-analysis
Pain Medicine 2020 (Feb 1); 21 (2): e139–e145Barnes, PM, Bloom, B, Nahin, RL
Complementary and Alternative Medicine Use Among
Adults and Children: United States, 2007
Natl Heal Stat Rep. 2007 (Dec 10); 12: 1-24Barnes, PM, Powell-Griner, E, McFann, K.
Complementary and alternative medicine use
among adults: United States, 2002
Adv Data. 2004; 1-19Hurwitz, EL, Chiang, LM
A comparative analysis of chiropractic and general practitioner patients
in North America: Findings from the joint Canada/
United States survey of health, 2002-03
BMC Health Serv Res. 2006; 6:1-17
Return to LOW BACK PAIN
Return to SPINAL PAIN MANAGEMENT
Since 12-03-2025
| Home Page | Visit Our Sponsors | Become a Sponsor |
Please read our DISCLAIMER |