

The Reliability of Lumbar Motion Palpation Using
Continuous Analysis and Confidence Ratings:
Choosing a Relevant Index of AgreementThis section is compiled by Frank M. Painter, D.C.
Send all comments or additions to: Frankp@chiro.org


FROM: J Can Chiropr Assoc. 2016 (Jun); 60 (2): 146–157 ~ FULL TEXT
OPEN ACCESS Robert Cooperstein, MA, DC and Morgan Young, DC
Palmer Center for Chiropractic Research,
San Jose, CA, USA.
FROM: Motion Palpation: Chapter 5INTRODUCTION: Most studies show motion palpation unreliable. This study's primary objective was assessing its reliability using a continuous measure methods, most-fixated level paradigm, stratified by examiners' confidence; and the secondary objective was comparing various indices of examiner agreement.
METHODS: Thirty-four minimally symptomatic participants were palpated in side posture by two experienced examiners. Interexaminer differences in identifying the most-fixated level and degree of examiner confidence were recorded. Indices of agreement were: Intraclass correlation coefficient, Mean and Median Examiner Absolute Examiner Differences, Root-Mean-Square Error and Bland-Altman Limits of Agreement.
RESULTS: Three of four reliability indices (excluding intraclass correlation) suggested on average examiners agreed on the most fixated motion segment, and agreement increased with confidence. Statistical measures of data dispersion were low. The analyses of subgroups were "fragile" due to small sample size.
DISCUSSION: Although subject homogeneity lowered ICC levels, the other reliability measures were not similarly impacted. Continuous measures statistical analysis demonstrates examiner agreement in situations where discrete analysis with kappa may not.
CONCLUSION: Continuous analysis for the lumbar most-fixated level is reliable. Future studies will need a larger sample size to properly analyze subgroups based on examiner confidence.
There are more articles like this @ our:
CHIROPRACTIC SUBLUXATION PageKEYWORDS: chiropractic; confidence rating; continuous analysis; lumbar; motion palpation; reliability
From the FULL TEXT Article:
Introduction
Motion palpation (MP) of the spine and sacroiliac joints is an assessment tool that is integral to most manual therapy practitioners and is taught within the core curriculum of virtually every chiropractic college. Most studies show MP to be unreliable, with concordance not much above chance levels. [1-4] Possible explanations for the general poor interexaminer reliability of MP have involved variation in procedure [5], poor interexaminer spinal level localization leading to possible misreported discrepancies, [6, 7] incorrect spinal landmarks [8-10], and variations in patient anatomy. [11] Moreover, few previous studies allowed examiners to identify different degrees of fixation; this most likely lowered reported levels of agreement since it was not reasonable to expect agreement where one or both examiners did not find the subject especially fixated.
Despite the reported low reliability of spinal MP, the authors were able to develop an alternative study design that ultimately demonstrated higher degrees of interexaminer reliability in the thoracic [12] and cervical [13] spines. Rather than having the examiners in their study rate individual spinal levels as fixated or non-fixated, the examiners were asked to identify the location within a defined spinal range that was the “most-fixated” (in this paper the term “most-fixated” characterizes a vertebra that is perceived by the examiner to exhibit more resistance to movement with palpatory pressure than other vertebrae in a defined range). In addition, the examiners were asked to state whether they were “confident” or “not-confident” in their finding, so as to allow analysis of subject subgroups that were stratified by the degree of examiner confidence. The primary goal of the present study was the adoption of this “most-fixated” level paradigm to study the interexaminer reliability of motion palpation of the lumbar spine. The secondary goal was to explore the properties of various indices of examiner agreement.
Methods
This study was approved by the Institutional Review Board of the Palmer College of Chiropractic, and all subjects provided written informed consent. The subjects constituted a convenience sample of 35 chiropractic college students who were either asymptomatic or had low back/leg pain ≤2 on a 0–10 pain scale. The eligibility criteria excluded subjects who had received manual therapy in the lumbar spine or sacroiliac joints on the day of the study. The pre-established number of subjects to be used in this study was based upon the work of Eliasziw et al. [14]; the sample size required at the 5% significance level with 80% power is approximately 35 subjects. It is reasonable to consider an intraclass correlation (ICC) value of 0.60 to be minimally acceptable for interexaminer reliability, based on a scale by which reliability is judged “poor” for values less than 0.40, “fair” between 0.40 and 0.59, “good” between 0.60 and 0.74, and “excellent” for values between 0.75 and 1.00. [15] Although these verbal pegs for ICC values are arbitrary, according to Cicchetti [15] they are widely accepted by biostatisticians. The two examiners in this study were both licensed and experienced chiropractors (one 30 years, the other 10 years of experience) who routinely utilize MP. The subjects did not speak to the examiners during the examination; the examiners were situated on opposite ends of the research laboratory, masked as to each other’s examination findings. Two research assistants escorted subjects through the experiment, ensuring that the examiners alternated in assessing them to prevent order effects, and recorded the data.
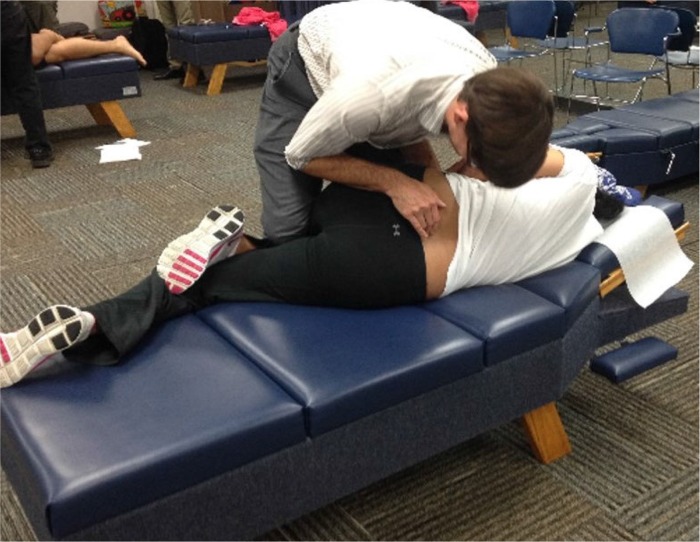
Figure 1
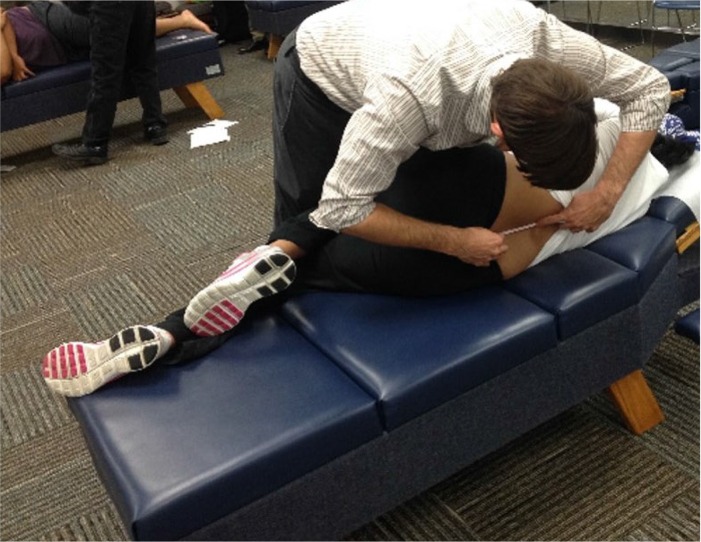
Figure 2
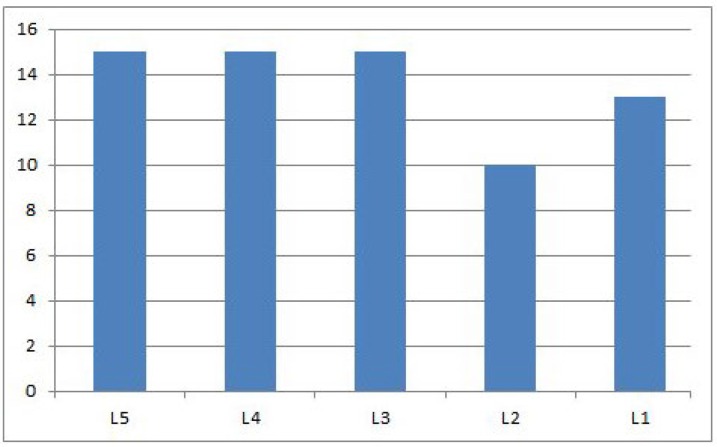
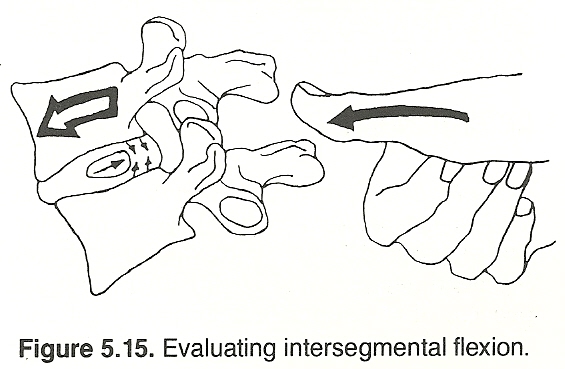
Figure 5 Subjects were first asked to lie prone on a treatment bench. One of the examiners then placed skin marks using a water-soluble pen at the putative locations of the vertebra prominens (VP), S2, and T12. The same examiner measured the distance from VP to S2, as a proxy for subject height, to be used subsequently in the analysis of data subsets. For the examiners to perform MP, the subjects were positioned with the left side up, with the left upper hip and knee flexed, as if to receive a manipulative procedure commonly called a “pull move”. [16] Other studies have used a similar method to assess lumbar motion. [17-20] The examiner then applied overpressure at the tested spinal level using the distal aspect of his right middle finger (see Figure 1). While doing so, he used his left hand to apply anteroposterior pressure to the subject’s crossed arms, and his right thigh to traction and apply posteroanterior pressure to the subject’s left thigh. The examiners successively assessed each of the spinous processes (SPs) of the lumbar spine. After identifying the most-fixated spinal level, each examiner measured its distance to the S2 pen mark, and the data were recorded by a research assistant (Figure 2). The examiner also stated whether he was “confident” or “not confident” in his finding. Although there was some variation in the amount of time between examinations, at least 5 minutes elapsed between palpatory procedures by the two examiners.
Examiner agreement was assessed by determining the difference in the measured distances of the most-fixated segment from the reference mark at S2. Interexaminer reliability was calculated using the following 4 statistical functions: (a) Intraclass Correlation Coefficient (ICC); (b) Mean Absolute Examiner Differences (MeanAED); (c) Median Absolute Examiner Differences (MedianAED); and Bland-Altman Limits of Agreement (LOA). These statistical functions were calculated for the entire data-set as well as for various subsets based on gender, VPS2 distance (a surrogate for height), age, and degree of examiner confidence. Mean Absolute Deviation (MAD/mean) and Median Absolute Deviation (MAD/median) were calculated to assess the degree of data dispersion. To illustrate the impact of high subject homogeneity on ICC, the authors constructed and analyzed a hypothetical dataset in which the examiner differences were mathematically identical to those seen in the actual dataset for each of the 34 study subjects, but in which the findings of the most-fixated segment were deliberately distributed more evenly over the lumbar spine (Figure 5).
Results
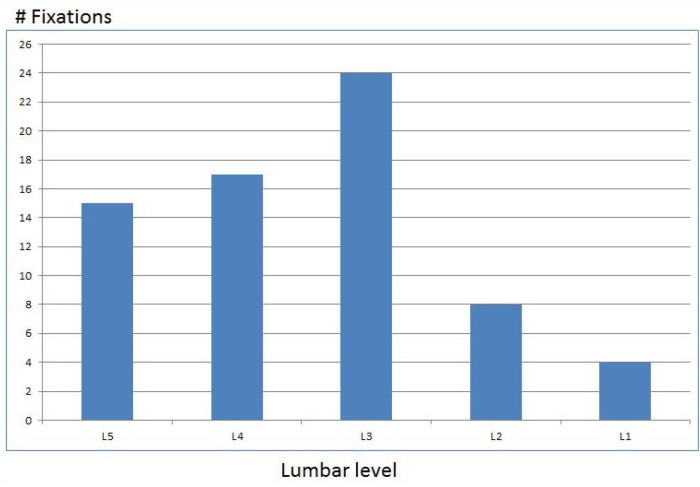
Figure 3

Table 1
Table 2 Of 35 subjects recruited, 34 fit the inclusion criteria (19 females, 54.3%); one subject reported back pain 4/10 and was thus excluded. The mean age was 25.4 (s=3.4) years; and mean VP-S2 distance was 48.1 (s=4.6) cm. The mean pain level was 0.5 (s=0.7) on a 0–10 numeric pain scale. The distance from S2 to the most-fixated segment ranged from 1.0 to 15.0cm (mean=6.9cm, s=3.0), for 68 assessments, 2 assessments for each of 34 participants. Among 68 assessments, in 2 cases the distance to S2 was <2 cm, suggesting the examiner may have identified the sacrum as the most-fixated level. Under the heuristic assumption that this range included 5 brackets spanning L1 to L5; and assuming an average lumbar spine length of some 20 cm [21], which corresponds to 4 cm/level; the finding of fixation was usually in the lower lumbar spine with L3 being the most commonly found most-fixated level (Figure 3).
One of the examiners did not share the conviction of the other examiner in the utility of the palpatory procedure, but opined that this did not impact his effort to attempt detecting the most-fixated lumbar segment. The less confident palpator scored 12/34 (35%) assessments as “not confident” whereas the more confident palpator scored 7/34 (21%) as “not confident”. In analyzing the data, we combined the subset in which one examiner lacked confidence (n=11) with the subset in which both lacked confidence (n=4), because not doing so would have left subsets that were too small to meaningfully analyze. ICC (2,1), MeanAED, MedianAED, MAD/mean, and MAD/median values are reported in Table 1; and Bland-Altman LOA in Table 2. For the entire dataset (n=34) the Shapiro-Wilk statistic was used to verify normality at the 95% threshold, with W=0.98. The distribution of all subsets was also normal.
For the n=34 sample as a whole, ICC(2,1)=0.39, which would be judged “poor” according to commonly-cited cutoffs for qualitative ratings corresponding to ICC values. [15] Although ICC values in Table 1 did not suggest a relation between examiner confidence and interexaminer agreement; male gender, greater VP-S2 distance (i.e., being “taller”), and age (i.e., being “older”) were directly related to higher ICC values. In the hypothetical dataset (Figure 5) in which the examiner differences were mathematically identical to those seen in the actual dataset (Figure 3), but in which the findings of the most-fixated segment were deliberately distributed more evenly over the lumbar spine, ICC rose from 0.39 (“poor”) to 0.70 (i.e., “good”). Therefore, ICC in this study was (misleadingly) lowered by the homogeneity of the subjects, with the most-fixated level mostly in the lower lumbar spine.
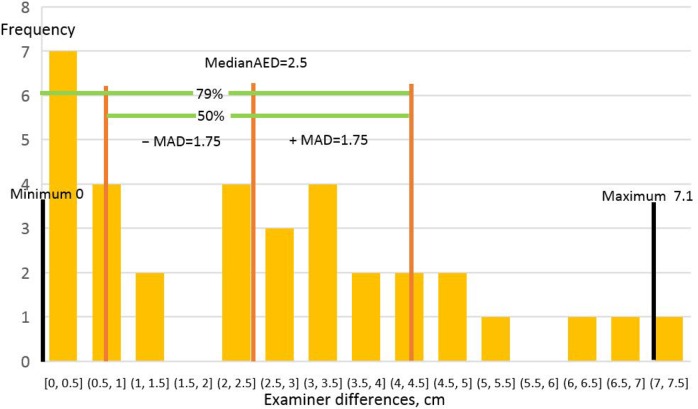
Figure 6 MeanAED values ranged from 2.4–2.9 cm and MedianAED from 2.1 to 3.2 cm among the subsets. These values were all well under 4.0cm, the vertical height of a typical lumbar vertebra [21], suggesting the examiners agreed on average in identifying the most-fixated level, or at least the motion segment containing it. Although for the full dataset interexaminer agreement based on ICC calculations had been judged “poor”, the MeanAED and MedianAED values of 2.6cm and 2.5cm respectively for the full dataset suggested otherwise. Since their values increased to 2.9cm and 3.2cm respectively if at least one examiner lacked confidence, it may be said that less confidence was associated with less examiner agreement. There was higher interexaminer agreement in the younger and taller subsets, but there was no gender effect. MAD/mean and MAD/median, measures of data dispersion, were quite uniform among all datasets, ranging from 1.6 to 1.8cm for MAD/mean and 1.4 to 1.8cm for MAD/median. Since these values were <2cm, it may be said that the variability of interexaminer differences was low, less than half the height of a lumbar vertebra. Stated otherwise, examiner distances from the average most fixated level were small and formed a tight distribution around these average examiner differences (Figure 6).
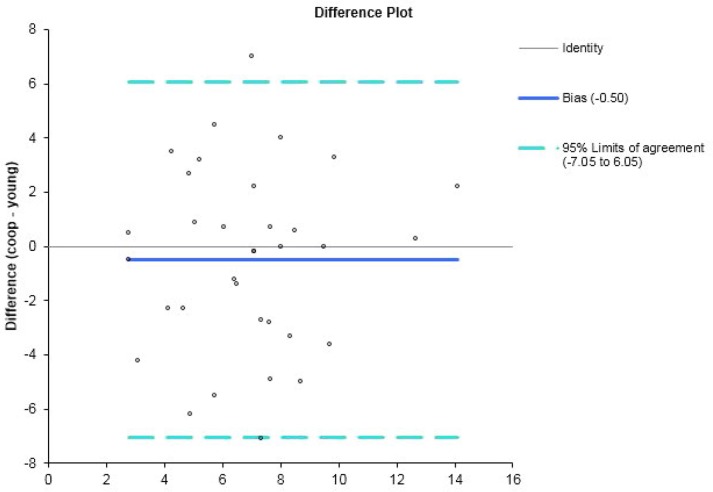
Figure 4 The Bland-Altman Limits of Agreement (LOA) analysis also suggested high interexaminer agreement on the most-fixated level, with higher agreement (smaller LOAs and smaller SDs) when the examiners were both confident; and also when the subjects were male, taller, and/ or younger. These findings are quite consistent with the MeanAED and MedianAED results, save for the impact of gender, which was negligible in these latter. For the full dataset, the 95% LOA = –7.05, 6.05cm; SD=3.34cm; and fixed bias = 0.50cm. Figure 4 is the Bland-Altman plot and histogram of examiner differences; the scatter plot and histogram of examiner differences demonstrated they formed a normal distribution, consistent with the Shapiro-Wilk results. There was a trend for more confidence to result in smaller SDs, reflecting greater examiner agreement: in the n=19 subgroup when both examiners were confident, the SD decreased from 3.34cm to 3.19cm, whereas in the n=15 subgroup where one or both of the examiners lacked confidence the SD increased to 3.63cm.
The square root of the mean squared error (MSE) yields root-mean-square error (RMSE), another measure of examiner accuracy. In this study, combined RMSE=3.3mm.
Discussion
Most MP studies asked examiners to rate each tested level as fixated or not, then used kappa to calculate the reliability. Although the kappa statistic is used to assess examiner agreement reported as discrete data, the palpation findings recorded as continuous data in this study were amenable to being analyzed using the ICC statistical function, as well as other indices of agreement for continuous data. Judging agreement by how near the examiners’ findings were to one another may be a more sensitive and clinically relevant method of determining agreement than assessing agreement at each spinal level examined. It may capture the essence of how MP is usually done in a typical clinical setting: the palpator generally examines a relevant spinal region looking for the most-fixated place(s).
Previous studies that required each rater to find the subjects fixated or not at each spinal level put a very stringent demand on the examiners, in that they were required to identify all fixations as if they were of the same severity. When many of the subjects in a study are minimally symptomatic, they may not have clinically relevant fixations to identify in the first place. Allowing examiners to rate their level of confidence in their findings enabled this study to explore whether examiners’ agreement depends to some extent upon their degree of confidence. The objective of this study was to assess the interexaminer reliability of lumbar MP by (a) defining agreement as relative proximity to each other’s findings as to the most-fixated level; and (b) taking into account the examiners’ confidence in their palpation findings. In an annotated review of MP (1) that included 48 MP studies, only Potter et al. [22] used a most-fixated segment paradigm and continuous analysis similar to the present study, and also used ICC to calculate interexaminer agreement. Since their study was an intra-examiner study and furthermore used other findings in addition to MP to assess agreement, the results cannot be compared with the results of the present study.
According to Bruton et al. [23], the physiotherapy and medical literature alike show little consistency in the use of reliability indices for continuous data. In a systematic review of the methods used to assess interexaminer reliability in continuous measures studies, Zaki et al. [24] reported that the ICC index was the most popular method used from 2007–9, with 25/42 (60%) of the included studies having used it. In a related systematic review, Zaki et al. [25] also reported that the most frequently used index of agreement in concurrent validity studies was the Bland-Altman LOA method, having been used in 178/210 (85%) of included studies; ICC was the 4th most frequently used among the 5 methods tabulated, used in only 7% of the studies. Bland and Altman themselves [26] took the position that the LOA agreement method can be used for either interexaminer reliability or inter-instrument agreement studies.
Although the power analysis supported enrolling approximately 35 subjects in order to have confidence in our reliability estimates, an even larger number would have been required to have similar confidence in analyzing subsets of the data that were stratified by gender, age, and VP-S2 distance. To mitigate this effect, for the purposes of analysis we combined the subset in which one examiner lacked confidence (n=11) with the subset in which both lacked confidence (n=4). When a sample size is small, the results of the analysis can be altered considerably by shifting a very small number of data points from one clinical result to another. Walsh [27] has described a Fragility Index: “the minimum number of patients whose status would have to change from a nonevent to an event to turn a statistically significant result to a nonsignificant result.” As an example using the present study’s results, if the 2 examiners had agreed exactly on subject 13, rather than disagreed by 7.1cm (the largest disagreement in the study for a single data point), the ICC(2,1) value for the entire dataset would have increased from the reported 0.39 to 0.46. This increase would have changed the interpretation of the reliability from “poor” to “fair.” Conversely, if the 2 examiners had disagreed on subject 31 by 3.2cm (the largest disagreement in the small subset where neither examiner was confident), the ICC(2,1) for this n=4 subset would have decreased from 0.75 to 0.31, therefore from “excellent” to “poor.”
For the n=34 full dataset, the calculated ICC(2,1)=0.39, which would be judged “poor” according to commonly-cited cutoffs for qualitative ratings corresponding to ICC values: interexaminer reliability is judged “poor” for values less than .40, “fair” between .40 and .59, “good” between .60 and .74, and “excellent” for values between” .75 and 1.0 (15). The fragility of the data among the subsets suggests caution in interpreting these results. That stated, the ICC calculations suggest there was higher interexaminer reliability in palpating males, older subjects, and subjects with a greater VP-S2 distance (essentially taller subjects, since VP-S2 distance was a proxy measure for height). Interexaminer reliability was lower when both examiners were confident compared with when at least one lacked confidence. These ICC results differed from those obtained in our prior thoracic motion palpation study [12] in which shared examiner confidence was clearly associated with increased interexaminer reliability, and our prior cervical study [13] in which re-analysis of the published data also shows higher agreement with more examiner confidence. Since MeanAED, MedianAED, and LOA all showed higher confidence associated with higher examiner agreement, the authors hypothesized that the ICC results, being the outlier among the 4 indices of examiner agreement, were misleading.
Despite its popularity in interexaminer reliability studies, ICC suffers from the limitation that its value decreases when subject variability is relatively low; i.e., the subjects are relatively homogeneous. [28] This results from the fact that ICC is a ratio of the variance within subjects to the total variance (the sum of within and between subject variance). When within subjects variance is small, ICC levels are misleadingly low even when the examiners tend to agree. In the present study, with a preponderance of findings at L3 and the most-fixated level usually toward the lower lumbar spine (as seen in Figure 3), ICC values may have been diminished for reasons other than examiner disagreement. To clarify this point, the authors constructed a hypothetical dataset in which the examiner differences were mathematically identical to those seen in the actual dataset for each of the 34 study subjects, but in which the findings of the most-fixated segment were deliberately distributed more evenly over the lumbar spine (see Figure 5). In this hypothetical dataset, the ICC was 0.70 (i.e., “good”) despite examiner differences being equal, subject for subject, to those seen in the more homogeneous actual dataset (Figure 3) where ICC=0.39 (i.e., “poor”). This study’s ICC calculation inverts a situation that is frequently discussed: sometimes a finding is found to be statistically significant, but clinically irrelevant. In our study, the ICC value statistically suggested “poor” agreement, even though examiners agreed on the most-fixated level most of the time, based on the other 3 indices of agreement used in this study.
To present the results of the present study in a more clinically meaningful way, and to mitigate against the impact of subject homogeneity, the authors also calculated values for Mean and Median Absolute Examiner Differences, which are measures of examiner agreement that are robust in relation to subject homogeneity. MeanAED is the simple average of the absolute values of the examiner differences, and MedianAED the median value of such differences. For any given value of Mean or Median Absolute Examiner Differences, the population of examiner differences may exhibit large, modest, or low variability. The root mean squared error (RMSE) (the square root of the summed squared errors, divided by the sample size), was calculated in conjunction with MeanAED and MedianAED. Because RMSE, unlike these other calculations, involves squaring errors, the level of agreement diminishes rapidly when the examiner differences are large. Therefore it is a more conservative estimate of examiner agreement. The more similar the examiners’ ratings, the more RMSE approaches MeanAED and MedianAED. In the present study the RMSE of 3.3cm, corresponding to 83% of a thoracic spinal level, is thus a more conservative estimate of examiner agreement than the MeanAED of 2.6cm and the MedianAED of 2.5cm.
Mean/MAD and Median/MAD were calculated to determine the dispersion of examiner differences. Calculating MAD/mean involves (a) calculating the mean of absolute examiner differences, (b) subtracting this value from each difference and converting to an absolute value; and (c) calculating the mean of this derived set of values. Calculating MAD/median [29] involves (a) identifying the median value of absolute examiner differences, (b) subtracting this value from each difference and converting to an absolute value; and (c) calculating the median of this derived set of values. Since Mean/MAD and Median/MAD values are in the same units as those of the variables being characterized, their values can be very easily understood relative to the clinical situation at hand.
Measures of dispersion tell us how spread out the data values are. The simplest measure of dispersion is range (the difference between the maximum and minimum values), but it is very impacted by extreme minimum or maximum values. Consequently, range is not robust to outliers. SD and variance, although very widely used, are not robust either, since a data point very distant from the others can substantially increase their values. The MAD/mean function is less sensitive to outliers, and MAD/median is not sensitive at all. Median is preferred to mean calculations [29, 30] because median analysis (a) is less sensitive to outliers at the far left and right tails of the distribution of examiner differences; and (b) it facilitates the detection and exclusion of such outliers (depending on a subjective judgment for threshold). Unlike the other measures of dispersion, the value of MAD/median has not already been altered by these outliers at the extremes of the distribution. In the present study, using the “conservative” threshold of 3 (meaning data points larger than the median ± 3* MADe/median be removed) or even the “poorly conservative” threshold of 2 (30), no data points qualified as outliers.
For the total dataset, MeanAED and MedianAED were 2.6 and 2.5cm respectively (in a normal distribution, the mean and median tend to be close), corresponding to about 65% of one lumbar level, given the length of an average lumbar vertebra is 4cm. [21] The fact that these values increased to about 3.0cm when at least one examiner was not confident suggests that examiner confidence tended to increase reliability. This was in spite of the fact that ICC calculations had not demonstrated that effect, presumably due to subject homogeneity. With MedianAED for the full dataset=2.5cm and MAD/median=1.8cm, it may be deduced that 50% of examiner differences were ≤1.8cm distant from 2.5cm. Figure 6 represents these relationships. It shows that the overall range of examiner differences was 0.0–7.1cm, and that the MedianAED was 2.5cm. It also shows that that 50% of examiner differences were 0.75–4.25cm; and that 79.4% of examiner differences were below 4.25cm, which is only slightly greater than the average lumbar vertebral height of 4.0cm.
The Bland-Altman calculation of limits of agreement (LOA) [26, 31] is yet another measure of examiner agreement that, like mean and median analysis, is not impacted by subject homogeneity. LOA plots per-subject examiner differences vs. examiner means. A horizontal line is added to reflect fixed bias (intersecting the Y axis at the Grand Mean of examiner differences). Two more horizontal lines are added to show 95% confidence intervals (1.96*SD of examiner differences). LOA analysis depends on the assumption of a constant mean and SD throughout the range of measurements, and a normal distribution of examiner differences. Inspection of the scatter plot and histogram of examiner differences validated these assumptions for this study’s data. Since the LOA are derived after having squared examiner differences, they will generally suggest lower levels of examiner agreement then absolute indices of agreement, which do not involve squaring differences; they are thus more conservative. Like these other absolute indices, the LOA are in the same units as the variables being measured, and are thus can be easily interpreted in clinical terms.
In this study, for the full dataset, the LOA = –7.05, 6.05 cm, with SD=3.34cm. This may be interpreted as follows: 68% of examiners’ findings for the most-fixated segment were ≤3.34cm apart, which is equivalent to 83.5% of the height of one lumbar vertebra. Thus the examiners had a 68% chance of agreeing on the most-fixated level, or at least the motion segment (consisting of 2 vertebra) including it. They had a 95% chance of being ≤ 6.68cm apart, equivalent to 1.67 vertebral heights, equivalent to agreeing at least on the motion segment that included the most-fixated level. Among the subsets analyzed, the most important observation was that higher examiner confidence was associated with greater interexaminer reliability, consistent with the mean and median analyses, but not the ICC results.
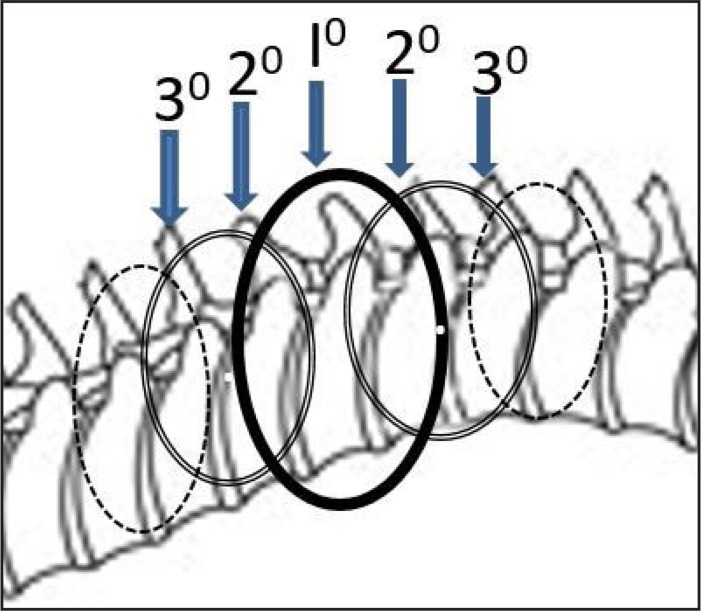
Figure 7 It is instructive to relate these findings to the practice of motion palpation. In all likelihood abject segmental specificity on a putative site of care is not required, since an intervention would generally address a motion segment consisting of 2 vertebrae. Christensen [32] considered motion palpators to agree when their findings were ± 1 spinal segment; as did Harlick [33] in a study of the accuracy of static spinal palpation. More likely than not, the examiners in this study identified the same or adjacent vertebrae as the most-fixated. To take the reasoning one step further, an adjacent vertebra is itself included within yet another motion segment, so addressing a given vertebra will have an impact not only on the 2 immediate neighboring vertebrae, but on 2 other vertebrae once removed from the given motion segment, most likely a smaller (damped) impact. Figure 7 models the impact of an intervention on a single vertebra. The intervention’s largest sphere of influence is hypothetically on the immediately adjacent vertebrae, with a smaller sphere of influence on those once-removed.
For MP to be clinically useful, it must not only be found reliable but also valid. Few studies have reported on the content validity (i.e., have defined a reference standard) for motion palpation. Najm [34] found only 5 that satisfied the inclusion criteria in a 2003 systematic review showing equivocal validity. In 3 of the studies the palpators examined a mannequin which featured variable and controllable segmental stiffness; the other 2 studies used pain as a reference standard. At least one additional study could have been included, in which masked palpators examining the sacroiliac joint were unable to identify known cases of ankylosing spondylitis as fixated. [35] Another study was published at a later date [36], in which masked palpators were able to detect fixation at congenital block vertebrae. The relevance of using mannequins to simulate in vivo spinal stiffness remains to be seen, and the presence of pain at spinal segments is at best a surrogate measure for spinal stiffness. On the other hand, deploying subjects with acquired or congenital joint fusions comprises an excellent vehicle for studying the content validity of MP.
Study limitations
Since the integrity of reliability studies depends on the independence of the examiners’ observations, there is always a risk that the first palpatory procedure is to some degree a clinical intervention, enough so to impact upon the second palpatory procedure. Allowing at least 5 minutes to elapse between observations, and alternating the order of examiners, was expected to ensure as much as possible the independence of observations and reduce the risk of fixed bias. This study did not include an intra-examiner reliability module. The sample size was under-powered for the analysis of subgroups. A power analysis was performed to justify the sample size for ICC analysis, but not for LOA analysis. This reinforces the need for a priori sample size estimates for all possible between group comparisons and not just on the main question. The appropriate sample size for LOA analysis depends on the accuracy sought for the 95% confidence intervals around the limits, which is given by the formula +/– 1.96 root(3/n) s (where s is the SD of the differences between measurements, and n = sample size) (38).
In our study, the 95% confidence interval around the limits was approximately ±2cm; this would most likely be judged relatively large by Bland, who suggests a sample size of 100 to achieve a tighter confidence interval around the limits. [37] The subjects were relatively homogeneous in the levels most commonly found the most-fixated, depressing ICC values, but not the other measures of interexaminer agreement (MeanAED, MedianAED, and LOA). The fact that examiner 1 did not share the conviction examiner 2 had in the palpatory procedure may have impacted the analysis of confidence. Lack of confidence in an examiner’s rating of the most-fixated motion segment might have resulted from either not finding any motion segment significantly fixated, or alternatively due to having found multiple segments significantly but indistinguishably fixated. Subjects were palpated unilaterally, left side up only. The subjects in the study were relatively young and healthy; the results obtained may have been different in another study population with different characteristics.
Conclusions
Although subject homogeneity in this study, with most fixations detected in the lower lumbar spine, apparently depressed the ICC index of interexaminer agreement, the other 3 indices used in this study did in fact suggest the examiners on average tended to identify the same vertebral level or motion segment as the most-fixated. These more robust measures suggested examiner confidence, and to a lesser extent subject demographic factors, impacted on examiner agreement. Using a continuous measures methodology may be more practical for detecting examiner agreement than using level-by-level discrete analysis. The authors would suggest the most-fixated level paradigm best captures the operational definition of motion palpation as it is usually done, and is thus more clinically relevant than level-by-level analysis of agreement. Our results raise the possibility that the present inventory of reliability studies performed in the manual therapy professions, by having used mostly discrete study designs (certainly for MP) may have underestimated clinically relevant examiner agreement, thereby unduly discouraging further research and clinician interest in such research. Moreover, depending solely on ICC calculations to assess interexaminer agreement may result in flawed conclusions, when the subject population is relatively homogeneous. Greater reliance on variance-insensitive statistical functions would mitigate against that possibility. Future studies designed to analyze subsets of the data should use enough subjects to result in credible conclusions.
Disclosure:
This research project was internally funded by the institution. The authors have no commercial conflicts of interests to report in relation to the project.
REFERENCES:
Haneline M, Cooperstein R, Young M, Birkeland K.
An annotated bibliography of spinal motion palpation reliability studies.
J Can Chiropr Assoc. 2009;53(1):40–58Haneline MT, Cooperstein R, Young M, Birkeland K.
Spinal Motion Palpation: A Comparison of Studies That Assessed
Intersegmental End Feel vs Excursion
J Manipulative Physiol Ther. 2008 (Oct); 31 (8): 616–626Seffinger MA, Najm WI, Mishra SI, Adams A, Dickerson VM, Murphy LS, et al.
Reliability of spinal palpation for diagnosis of back and neck pain:
a systematic review of the literature.
Spine. 2004;29(19):E413–425Hestbaek L, Leboeuf-Yde C.
Are chiropractic tests for the lumbo-pelvic spine reliable and valid?
A systematic critical literature review.
J Manipulative Physiol Ther. 2000;23(4):258–275Marcotte J, Normand MC, Black P.
Measurement of the pressure applied during motion palpation and reliability for
cervical spine rotation.
J Manipulative Physiol Ther. 2005;28(8):591–596Billis EV, Foster NE, Wright CC.
Reproducibility and repeatability: errors of three groups of physiotherapists in locating
spinal levels by palpation.
Man Ther. 2003;8(4):223–232Huijbregts PA.
Spinal motion palpation: a review of reliability studies.
J Man Manip Ther. 2002;10(1):24–39.Cooperstein R, Haneline M.
Spinous process palpation using the scapular tip as a landmark vs a radiographic criterion standard.
J Chiropr Med. 2007;6(3):87–93Cooperstein R, Haneline MT, Young MD.
The location of the inferior angle of the scapula in relation to the spinal level of prone patients.
J Can Chiropr Assoc. 2009;53(2):121–128Haneline M, Cooperstein R, Young M, Ross J.
Determining spinal level using the inferior angle of the scapula as a reference landmark:
a retrospective analysis of 50 radiographs.
J Can Chiropr Assoc. 2008;52(1):24–29Chakraverty R, Pynsent P, Isaacs K.
Which spinal levels are identified by palpation of the iliac crests and the posterior superior iliac spines?
J Anat. 2007;210(2):232–236Cooperstein R, Haneline M, Young M (2010)
Interexaminer Reliability of Thoracic Motion Palpation Using
Confidence Ratings and Continuous Analysis
J Chiropractic Medicine 2010 (Sep); 9 (3): 99–106Cooperstein R, Young M, Haneline M (2013)
Interexaminer Reliability of Cervical Motion Palpation Using Continuous Measures
and Rater Confidence Levels
J Can Chiropr Assoc. 2013 (Jun); 57 (2): 156–164Eliasziw M, Young SL, Woodbury MG, Fryday-Field K.
Statistical methodology for the concurrent assessment of interrater and intrarater reliability:
using goniometric measurements as an example.
Phys Ther. 1994;74(8):777–788Cicchetti DV.
Guidelines, criteria, and rules of thumb for evaluating normed and standardized assessment
instruments in psychology.
Psychological Assessment. 1994;64(4):284–290.Bergmann T, Peterson DH.
Chiropractic Technique.
St. Louis: Elsevier; 2011. pp. 35–83.Lundberg G, Gerdle B.
The relationships between spinal sagittal configuration, joint mobility, general low back mobility
and segmental mobility in female homecare personnel.
Scand J Rehab Med. 1999;31(4):197–206Inscoe E, Witt P, Gross M, Mitchell R.
Reliability in evaluating passive intervertebral motion of the lumbar spine.
J Man Manip Ther. 1995;3:135–143.Strender LE, Sjoblom A, Sundell K, Ludwig R, Taube A.
Interexaminer reliability in physical examination of patients with low back pain.
Spine. 1997;22(7):814–820Gonnella C, Paris SV, Kutner M.
Reliability in evaluating passive intervertebral motion.
Phys Ther. 1982;62(4):436–444Terazawa K, Akabane H, Gotouda H, Mizukami K, Nagao M, Takatori T.
Estimating stature from the length of the lumbar part of the spine in Japanese.
Med Sci Law. 1990;30(4):354–357Potter NA, Rothstein JM.
Intertester reliability for selected clinical tests of the sacroiliac joint.
Phys Ther. 1985;65(11):1671–1675Bruton A, Conway JH, Hogate ST.
Reliability: What is it, and how is it measured.
Physiother. 2000;86(2):94–99.Zaki R, Bulgiba A, Nordin N, Azina Ismail N.
A systematic review of statistical methods used to test for reliability of medical instruments
measuring continuous variables.
Iran J Basic Med Sci. 2013;16(6):803–807Zaki R, Bulgiba A, Ismail R, Ismail NA.
Statistical methods used to test for agreement of medical instruments measuring continuous variables
in method comparison studies: a systematic review.
PLoS One. 2012;7(5):e37908Bland JM, Altman DG.
Statistical methods for assessing agreement between two methods of clinical measurement.
Lancet. 1986;1(8476):307–310Walsh M, Srinathan SK, McAuley DF, Mrkobrada M, Levine O, Ribic C, et al.
The statistical significance of randomized controlled trial results is frequently fragile:
a case for a Fragility Index.
J Clin Epidemiol. 2014;67(6):622–628Lee KM, Lee J, Chung CY, Ahn S, Sung KH, Kim TW, et al.
Pitfalls and important issues in testing reliability using intraclass correlation coefficients
in orthopaedic research.
Clin Orthop Surg. 2012;4(2):149–155Leys CL, C, Klein O, Bernard P, Licata L.
Detecting outliers: Do not use standard deviation around the mean, use absolute deviation
around the median.
J Experim Soc Psychol. 2013;49(4):764–766.Pham-Gia T, Hung TL.
The mean and median absolute deviations.
Mathemat Comput Model. 2001;34(7–8):921–936.Bland JM, Altman DG.
Comparing methods of measurement: why plotting differences against standard method is misleading.
Lancet. 1986;346:1085–1087Christensen HW, Vach W, Vach K, Manniche C, Haghfelt T, Hartvigsen L, et al.
Palpation of the upper thoracic spine: an observer reliability study.
J Manipulative Physiol Ther. 2002;25(5):285–292Harlick JC, Milosavljevic S, Milburn PD.
Palpation identification of spinous processes in the lumbar spine.
Man Ther. 2007;12(1):56–62Najm WI, Seffinger MA, Mishra SI, Dickerson VM, Adams A, Reinsch S, et al.
Content validity of manual spinal palpatory exams – A systematic review.
BMC Complement Altern Med. 2003;3:1Mior SA, McGregor M, Schut B.
The role of experience in clinical accuracy.
J Manipulative Physiol Ther. 1990;13(2):68–71Humphreys BK, Delahaye M, Peterson CK:
An Investigation into the Validity of Cervical Spine Motion Palpation Using Subjects
with Congenital Block Vertebrae as a 'Gold Standard'
BMC Musculoskelet Disord 2004 (Jun 15); 5 (1): 19Bland J.
How can I decide the sample size for a study of agreement between two methods of measurement?
[cited 2015 Dec. 12]. Available from:
https://www-users.york.ac.uk/~mb55/meas/sizemeth.htm
Return to SPINAL PALPATION
Return to LOCATING SUBLUXATIONS
Since 1-10-2019
| Home Page | Visit Our Sponsors | Become a Sponsor |
Please read our DISCLAIMER |