Thermographic Pattern Calculator
A product of research: applied to the analysis of vertebral subluxation.
Created by the Sherman College of Straight Chiropractic Research Department.
This software was developed as a special tool to help researchers and practitioners assess the similarity between pairs of thermographic scans. The program uses data exported from the TyTron C-3000 and calculates a set of congruence factors using 5 different algorithms.
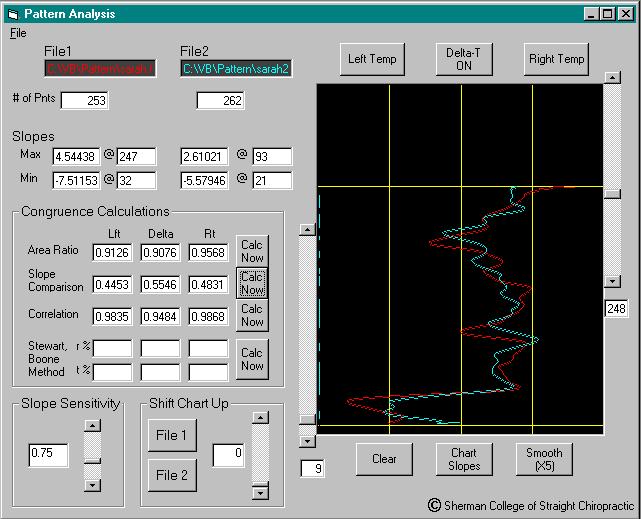 View a screen shot from the software
Additional credits: Monte Penrod, BS; Torsten Stein, BS; John F. Hart, D.C., Associate Professor; Joseph J. Donofrio, D.C., Assistant Professor; Jason Haralambous, D.C.; and Eric Mierzejewski, D.C., co-authors of papers linked below. Also to M.S. Stewart, DW Riffle, and WR Boone for original work on statistical methods used in The Pattern Calculator, and to Roger Titone, M.S., for development of the TyTron C-3000 infrared scanner.
Archives:
- Abstract of the project from the 1999 Upper Cervical Conference
- Full-length technical paper in CRJ 2000; 7(2) 65-69.
- Abstract of the project from the 2001 Vertebral Subluxation Research Conference
- Abstract of the project from the February 2004 JMPT; Stability of Paraspinal Thermal Patterns During Acclimation, pp. 109-117, by John Hart, D.C. and Ed Owens, D.C.
Feedback to jhart@sherman.edu