

Cost-Efficiency and Effectiveness of Including Doctors
of Chiropractic to Offer Treatment Under Medicaid:
A Critical Appraisal of Missouri Inclusion of
Chiropractic Under Missouri MedicaidThis section is compiled by Frank M. Painter, D.C.
Send all comments or additions to: Frankp@chiro.org


FROM: J Chiropractic Humanities 2019 (Dec 10); 26: 31–52 ~ FULL TEXT
OPEN ACCESS John R. McGowan, PhD, Leonard Suiter, DC, FICC
Department of Accounting,
Richard A. Chaifetz School of Business,
Saint Louis University,
St. Louis, Missouri.
FROM: Liliedahl ~ JMPT 2010 (Nov)OBJECTIVES: The objectives of this study were to critically evaluate the methodology and conclusions of the fiscal notes prepared by the state of Missouri for including doctors of chiropractic (DCs) under Missouri Medicaid and to develop a dynamic scoring model that calculates the savings if DCs were allowed to offer treatment under Missouri Medicaid.
METHODS: We used a secondary analysis to determine the cost-saving assumptions to be incorporated into a dynamic model. We reviewed the literature on efficiency and effectiveness of DC–delivered care regarding the most reliable assumptions concerning cost savings and utilization. The assumptions for percentage savings from DC–provided care and the avoidance of spinal surgeries were then combined in the dynamic scoring model to determine projected cost savings from adding DCs as covered providers under Missouri Medicaid. The actual cost of opioid abuse in Missouri was then determined as a basis to measure cost savings from adding DC care as an alternative therapy for the management of neck and low back pain.
DISCUSSION: The Missouri Health Division initially used the static scoring approach to evaluate proposals to cover DC care under Missouri Medicaid. This approach only considers added costs from a legislative change. Because of this, we proposed that the Missouri Health Division used flawed methodology and data in their calculations for the fiscal note regarding the cost of including care from DCs under Missouri Medicaid. After consideration of the approach used in this study, the Committee adopted some important elements of dynamic scoring. Based on our computations and the dynamic scoring model, we determined that there would be a cost savings to the state of Missouri of between $14.1 and $49.2 million once DCs are included as covered providers under Missouri Medicaid. This study also supports the proposition that treatment by DCs for neck and lower back pain may reduce the use and abuse of opioid prescription drugs.
There are more articles like this @ our:
Cost-Effectiveness Page and ourCONCLUSION: Policymakers may unintentionally rely on flawed assumptions and methodologies such as static scoring, which we propose results in flawed conclusions. Legislative options involve some additional cost. The issue is whether proposed legislative options offer more effective outcomes along with more efficient cost. Using a dynamic scoring model to incorporate savings from 3 primary sources, we found that
(1) chiropractic care provides better outcomes at lower cost,
(2) chiropractic treatment and care leads to a reduction in cost of spinal surgery, and
(3) chiropractic care leads to cost savings from reduced use and abuse of opioid prescription drugs.Key Indexing Terms Chiropractic, Comparative Effectiveness, Research, Medicaid, Health Care Costs
From the FULL TEXT Article:
Introduction
The benefits of care provided by doctors of chiropractic (DCs) have been demonstrated by research throughout the US health care system. [1–4] Reimbursement for such care is now provided by Medicare in all 50 states, and by Medicaid in most states. The decision to provide coverage in each state is based on policymakers’ perceptions of both benefits and cost. The cost of including doctors of chiropractic as covered physicians is often misunderstood. Policymakers may rely on flawed assumptions and methodologies to conclude that adding another provider is more expensive and less effective than current care. This article proposes that DCs deliver care that is more effective and less costly than the current model. This study considers the cost and effectiveness of care delivered by DCs compared with other forms of treatment. Although there are potentially numerous beneficial clinical outcomes [5] from DC treatment, perhaps the greatest clinical outcome is the reduction of neck and low back pain. The analysis for this study is based on research that has been conducted to date.
The purpose of this study was to critically evaluate the methodology and conclusions of the fiscal notes prepared by the state of Missouri for including DCs under Missouri Medicaid. This study also estimated a dynamic scoring model that specifically incorporates cost savings from changes in human behavior. The 3 major changes incorporated in the model are (1) cost savings from DC care vis-ŕ-vis traditional doctor of medicine/doctor of osteopathy (MD/DO) care, (2) cost savings from reductions in spinal surgery, and (3) cost savings from reduced use and abuse of opioid prescription drugs.
Methods
We considered the shortcomings of the static scoring methodology used by the Missouri Health Division (MHD) to evaluate DC care as an alternative to traditional MD/DO care under Missouri Medicaid. We used a dynamic scoring approach to measure costs and savings from adding DCs under Missouri Medicaid. After critically evaluating the methodology and data employed by MHD for their fiscal notes, the next 3 sections of this study document the savings percentages employed under the dynamic scoring model.Section 1 examines each Missouri fiscal note beginning with FY11. We critically evaluated the assumptions and methodologies used by MHD to score the cost of adding DCs as covered providers under Missouri Medicaid. To date, Missouri fiscal notes have only considered the additional costs from adding DC care under Missouri Medicaid. This approach is called static analysis. Dynamic scoring was incorporated in this analysis, which factors in changes in human behavior as patients migrate from traditional medical to DC care.
Section 2 involved a search of the literature to determine whether DC care is more cost-effective vis-ŕ-vis traditional MD/DO care. We used Google Chrome and Internet Explorer with the search terms “cost effectiveness of chiropractic care” and “cost efficiency of chiropractic care.” We identify key studies that document such cost savings.
Section 2 examines published studies on the effectiveness and cost-effectiveness of DC care. This section described the extent of savings that might accrue to the state of Missouri from approving DC care along with traditional medical care in Medicaid. The percentages documented in this section will be incorporated into the dynamic scoring model.
Section 3 examines the increasing incidence of spine surgery in the United States. The question of whether DC care leads to a reduction in the need for spinal surgeries was considered. We used Google Chrome and Internet Explorer with the search terms “cost of spinal surgery” and “does chiropractic care reduce the need for spinal surgery.” We reviewed the resulting studies identified from these search terms. We found studies documenting savings from the avoidance of spinal surgery as a result of DC care. Data from these studies were also used in the dynamic scoring model.
Section 4 examines the opioid drug epidemic both in Missouri and across the United States. We used Google Chrome and Internet Explorer with search terms “opioid abuse and impact of chiropractic” to identify articles that explore the link between DC care and the reduction in use and abuse of opioid prescription drugs. We critically evaluated recent estimates from the MHD on the amount of savings that would accrue to the state from reduced use and abuse of opioid prescription drugs. We developed our own methodology to compute savings from the reduced use of opioid drugs in Missouri as a result of DC care.
Section 5 uses the data derived from sections Section 2: Studies on the Effectiveness of Treatment by DCs, Section 3: Increasing Incidence of Spine Surgery, Section 4: The Opioid Analgesics Epidemic to help construct the dynamic scoring model. The starting point for the model is the identification of health care expenditure in the United States and Missouri for treatment of neck and low back pain. Next, we explored the literature to ascertain how many people are likely to seek DC care once it is approved by the state. We then subtracted savings from the lower cost of DC care vis-ŕ-vis traditional MD/DO care from total medical expenditures. The second area of savings in the model was reduction in spinal surgeries. This savings percentage from section 3 of the study was added into the dynamic scoring model. The final and potentially largest component of savings was then incorporated into the model. Reduction in opioid prescription drug abuse provides the largest category of savings in the dynamic scoring model. The study concludes with a summary discussion of how Medicaid costs would be affected by allowing DCs as an option for Missourians to treat their neck and low back pain.
Results
Our critical review of the Missouri Fiscal Notes data and methodologies identified several errors and shortcomings that were eventually corrected by the state. Based on our analysis, the state made the following revisions to their data or methodologies. They used proper procedure codes, they dropped seniors who were otherwise covered by Medicare from their cost projections, and they eliminated the unrealistic category of cost for medically unnecessary services. Most importantly, the MHD incorporated a major element of the dynamic scoring model by estimating $25 million in savings from reduced use and abuse of opioid prescription drugs in Missouri. When combined with the other elements of savings in our model, we determined that total savings from adding DCs as covered providers to Medicaid would be between $14.1 and $49.2 million.
Section 1: Missouri Fiscal Notes: From Static to Dynamic Scoring
An effort to include DCs as a provider option under Missouri Medicaid has been under way for at least 15 years. Ever since fiscal year (FY) 2008, the Committee on Oversight (Committee) has prepared a fiscal note each year in an attempt to estimate the cost associated with this proposed legislative change. Between FY2009 and FY2011, the Committee indicated the cost was simply unknown. Starting with FY2011, the Committee estimated the additional cost associated with the inclusion of DCs under Missouri Medicaid. The Committee has refined and changed their assumptions over the years. This study explains why these assumptions have been flawed but have been showing improvement beginning with revised estimates for FY2015. The biggest change has been a movement from static to dynamic scoring. The next section discusses these 2 approaches to calculating the fiscal impact of legislative change.
The Omission of Dynamic Scoring Leads to Faulty Conclusions
Dynamic scoring considers the changes in human behavior that result from legislative change while static scoring does not. Static scoring falsely assumes that nothing changes except additional costs. In a recent Harvard briefing paper on budget policy, Zenk notes that Congress has been required to use dynamic scoring ever since 2015. [6] He also explains how dynamic scoring can have enormous effects on fiscal policy. This is a key point and major omission by the Committee in their estimates of the effect of adding DCs as a provider option under Missouri Medicaid.
Policymakers make suboptimal decisions when they ignore that human behavior typically changes with new legislative policies. For example, patients with back pain typically decide between MD/DOs and DCs to pursue treatment for their back pain. This fact should be incorporated in any model that scores the impact of this proposed legislative change. An earlier version of this study was presented to the Missouri Senate at a hearing in spring 2017. The estimation model employed in this study embraces dynamic scoring. This means that changes in human behavior are factored into the analysis. To their credit, the Committee has now incorporated several elements of dynamic scoring with their most recent estimates for FY2018. The initial flaws in their approach, along with the more recent positive elements, are discussed in the next section.
Committee’s Approach to Calculating Fiscal Notes
As part of our review of the Committee’s methodology to calculate fiscal notes, we argue 2 points. First, numbers should be reasonably accurate. Second, cost savings from changes in human behavior, or dynamic scoring, should be included. Regarding the second point, the Committee did show some openness to the consideration of dynamic scoring with their comment in a February 15, 2015, fiscal note. They indicated that access to care by chiropractic physicians would lead to a reduction in the number of general physician (MD/DO) visits. However, they left off any further discussion of this offset at that time. Concerning the importance of accuracy, we point out issues with both the procedure codes and the number of Missouri Health Network (MHN) adults used for their calculations. Regardless of the number of individual MHN members included, we stress that savings will accrue to the state of Missouri because of savings identified in this study.
Fiscal Note Methodology

Table 1 The Committee initially used static scoring to calculate cost to the state. The 3 primary elements initially used by the Committee for the calculation are the number of people projected to use DCs under Missouri Medicaid, the estimated number of visits per year, and the estimated cost of each visit. These total estimated costs are shown first in Table 1, along with the breakdown between general revenue and the federal funds. The Missouri General Revenue Fund is responsible for about one-third of the total cost, and federal funds cover the remaining two-thirds. The details and assumptions used for the Committee’s calculations are presented next.
Projected MHN Participants Using a DC
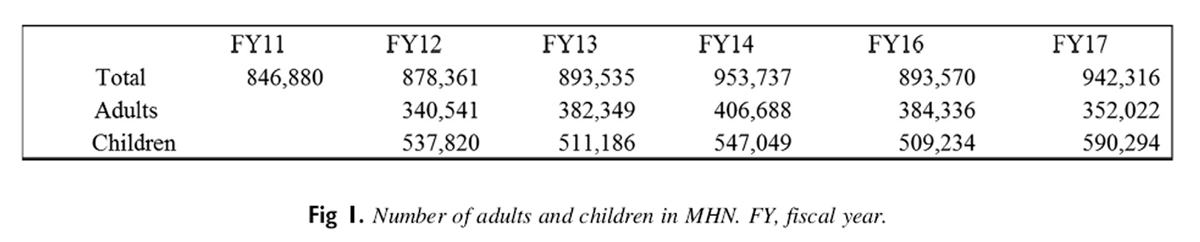
Figure 1 The number of adults and children in the MHN are used to calculate the number of people who would seek care from a DC under Medicaid. Total participants reported in the fiscal notes for fiscal years 2011 through 2017 are shown in Figure 1. In light of the 2016 estimate by the Department of Health and Human Services of 964,598, we believe the Committee’s estimate of 942,316 is reasonable. This number includes 590,294 children and 133,762 seniors and people with disabilities covered by both Medicaid and Medicare. [7] Because these seniors are eligible for Medicare, they should not be counted with the adults who could seek insurance coverage through Medicaid. The next step taken by the Committee was to estimate the number of MHN enrollees who would take advantage of DC access. According to the National Center for Health Statistics, 8.6% of adults and 2.8% of children had used DC- or DO-delivered manipulation within the previous 12 months. [8] Using this assumption, the MHD chose to use 9% for adults and 3% for children as the estimate of the percentage of the MHN population that will see a DC. In our judgment, this estimate is also reasonable.
In summary, we believe that the estimates of the numbers of individuals used by MHD to estimate the projected cost of DC inclusion are reasonable except for the inclusion of adults who are also eligible for Medicare. The 133,762 seniors and people with disabilities should therefore not be included for the Medicaid cost projections. Accordingly, the number of adults who would take advantage of DCs under Medicaid should be reduced to 19 643 ([352 022 – 133 762] × 9%) for FY2017. The number of children who would see a DC in Missouri is projected to be 17,709 (590 294 × 3%). Accordingly, the total projection of adults and children who would see a DC in Missouri under Medicaid would be 37,352 (19,643 + 17,709). This number is considerably smaller than the 49,391 projected by the MHD for FY2017.
Estimated Number of Visits per Year
The fiscal note dated February 16, 2015, contained the following language regarding the number of annual visits to a DC: “The number of medically necessary DC visits that will be authorized for each participant is not known.” [9] This fiscal note assumed a series of 8 visits per year. It is possible that some participants would receive more visits and others would receive fewer visits. The fiscal note for the following year, dated March 9, 2016, contained language to support almost the doubling of the number of visits each year. Per this note, the number of annual medically necessary chiropractic visits for each participant was assumed to be 14.4.
Average Cost of a Visit to the Chiropractor
That same fiscal note, dated March 9, 2016, also explained how the MHD computed the average cost of a visit to a DC as $28.93. It stated, “It is assumed under this legislation that chiropractors would, at a minimum, bill for manipulative treatment and certain physical therapies using the procedure codes 98925, 98926, 98927, 98928, and 98929.” [10] The fiscal note also pointed out that these codes are currently used for osteopathic manipulative treatment. This assumption is not correct and is another reason the fiscal note is flawed. As defined in the American Medical Association Current Procedural Terminology book, the standard for coding, these osteopathic manipulative treatment codes are typically not used by chiropractic physicians. The direct comparison for chiropractic physicians are the codes 98940, 98941, 98942 and 98943.
Relative Value Units Employed to Calculate Costs
Relative value units (RVUs) are the result of a 10–year study by the American Medical Association and the Centers for Medicare & Medicaid Services. They are designed to establish parity in fees between specialties. On January 1, 1992, the resource-based relative value scale (RBRVS) became the official Centers for Medicare & Medicaid Services payment methodology for physician services provided to Medicare patients. Under the RBRVS, RVUs are based on the human resources and other costs associated with the delivery of a specific procedure or service. There are 3 RVU components in the RBRVS methodology. These components represent physician work, practice expense, and malpractice expense. Finally, the fee is ultimately determined as the product of the RVU and the dollar conversion factor (DCF). The DCF is a multiplier that converts the RVU into a fee. The purpose behind the DCF is to manage costs in the health care industry.
When comparing relative cost of care by chiropractic physicians and that of general-practice physicians, it is important to use the proper RVUs. When the proper codes are used, the average RVU for chiropractic physicians is 4.15 compared to 8.34 for osteopathic physicians. Both of these RVU figures would then be multiplied by the DCF to determine cost.
Additional Physical Therapy Costs for Children
The Committee also included additional cost for children receiving physical therapy under both fee-for-service (FFS) and under managed care. Total projected cost for physical therapy is just over $82,000. This projected cost is small. Physical therapy is not a federally mandated Medicaid service. [11] Therefore, any costs projected to cover physical therapy for children should be minimal.
FY2011: The First Year With Projected Costs
As displayed in Table 1, the FY2011 estimate projected the cost for adding DC care under the FFS portion of the Missouri Medicaid budget. The number of adults in the MHN was first multiplied by the estimated percentage of patients who would seek care from DCs. Next, this figure was multiplied by the estimated number of chiropractic visits per year and finally by the estimated average cost. The resulting cost estimate was just over $16 million. Federal funds are available to cover approximately two-thirds of these costs or nearly $11 million. The Missouri budget is responsible for the remaining one-third or $5.3 million. For the next 4 years after FY11, there were 2 significant changes in assumptions used for this computation. First, the number of adults covered under the MHN decreased from over 800 000 to an average of just less than 400,000. Second, the cost of physical therapy for 500 children was included for FY2016. In summary, total cost estimates over the next 5 fiscal years remained fairly level around $11 million.
FY2017: Fiscal Note Methodology Takes an Unrealistic Twist
Table 2
Panel A
Table 2
Panel BOn March 9, 2016, the Committee published a revised cost projection for fiscal years 2017 through 2019. Panel A of Table 2 shows this cost projection. The total number of individuals in the MHN in FY2017 increased to 942,316 from 893,570 in FY2016. Despite this modest increase, the total cost of FFS remained stable at $11,251,713 owing to the reduction in the number of children in FFS under physical therapy. A significant new category of cost added under FFS for FY2017 was managed care (MC). Along with one-time system cost of $250,000, the new MC category proposed the additional cost of $7,167,561. When combined with the FY2017 FFS cost of $11,251,713, total cost projection increased to $18,419,214. This increase represents a 63.7% increase.
With this increase, the Committee was just getting started with their escalation of FY2017 cost projections. The Committee invented another category of cost called “upper range medically unnecessary costs.” These are shown in panel B of Table 2. For the first time, the Committee created a new category of cost for people who have a medical necessity for treatment but receive nonmedically necessary services. They also created a second new category of cost for people who do not have a medical necessity for services and seek nonmedically necessary services. Panel A of Table 2 summarizes the typical cost projections for both FFS and MC. This cost is labeled “lower range typical costs.” They do not include the new categories.
The new categories are shown in panel B of Table 2. With the addition of these 2 categories, total projected cost increased to nearly $33 million in FY2017 and almost $34 million for FY2019. If only medically necessary services are covered, then by definition neither of these 2 new categories should be covered. Accordingly, it is not clear why policymakers made this assumption that suddenly 32,183 (30 651 + 15 325) patients in FFS would seek varying degrees of “medically unnecessary” and therefore uncovered services. Similarly, the MHD assumed that 28 110 (18 740 + 9370) patients under managed care would seek “medically unnecessary” services. It could be that owing to the high degrees of satisfaction expressed by those who see DCs compared with other forms of care, the Committee is concerned that patients will overconsume services provided by DCs. [12–15] We argue that although a small percentage of the population may seek medically unnecessary chiropractic services, these are not covered services and would be no greater than for patients visiting an MD/DO for traditional medical care. Therefore, it should be ignored because it is not a valid incremental cost.
FY2018: Fiscal Note Reverses Course and Displays Cost Savings
Table 3
Table 4
Table 5
As noted earlier, we first presented the results of this study to the Missouri Senate in the spring 2017 session. After this presentation, the Committee published another revised cost estimate as shown in Table 3. Total projected average costs plummeted to their lowest levels to date at just under $9 million. The major changes in this new estimate were the elimination of the projected medically unnecessary costs and the duplication of costs from having seniors included who were otherwise covered by Medicare. The Committee remained busy with their consideration of the cost estimates for the impact of this bill. In less than 30 days on May 5, 2017, the Committee published another cost impact for SB209. A change in the rates of reimbursement increased projected costs slightly to just over $9 million as shown in Table 4. Most of the cost savings projected in the first estimate for FY2018 were retained in this revised fiscal note.
FY2019: Fiscal Note Incorporates Major Cost Savings: Reduced Opioid Use
The final and most recent cost estimate for FY2019 was published by the Committee on February 9, 2018. This estimate is shown in Table 5. The first change incorporated in this estimate is an increase in the average cost of a chiropractic visit to $20.48 from $16.07. The other major change incorporated in this estimate is the inclusion of a major element from the dynamic scoring model. The Committee included an estimate of cost savings from reduced reliance on opioid prescription drugs. As shown in Table 5, the Committee projected total savings of $29,400,000 ($10.2 million in the general fund and $19.1 million in federal funds) by FY2021 from reduced reliance on opioid prescription drugs. We strongly support Missouri policymakers for taking this important step toward the inclusion of the important elements of the dynamic scoring model.
Section 2: Studies on the Effectiveness of Treatment by DCs
Spine pain is a pervasive health care problem in the United States. Patients with spine pain typically seek care from MDs, DOs, DCs, physical therapists, or some combination thereof. Dagenais determined that the distribution of providers for this treatment is 61% MD/DO, 28% DC, and 11% from a combination of providers. [16] Given the availability of such different treatment methods for spine pain and similar problems, it is more important than ever to identify high value and cost-effective services. Health economists apply the cost-benefit test and define the most effective services as those that prevent diseases and cost less than alternative measures. Conversely, services that have low satisfactory outcomes and higher cost fail the cost-benefit test. Regardless of which type of provider is used, the goal for policymakers should be to provide incentives for high-value services and disincentives for low-value services. “Across the board budget cuts that fail to make such qualitative distinctions are the equivalent of substituting a meat cleaver for a surgeon’s scalpel.” [17] Over the past several years, a number of key benchmarks have been documented for both effective (high-value) and cost-effective (relatively low-cost) approaches to treatment for low-back and neck pain. These milestones and conditions have been identified through an increasing number of studies and reports. [17] The purpose of this section is to carefully survey and briefly summarize published studies on both the cost savings and efficacy of care provided by DCs. We use both Google Chrome and Internet Explorer and the search terms “cost savings,” “efficacy,” and “chiropractic care” to discover the articles and studies discussed in this section. The data documented in this section will be incorporated into the dynamic scoring model.
Individuals With DC Insurance Have Lower Annual Health Care Costs
This comprehensive study determined that access to managed DC care lowers overall health care expenditures through numerous avenues, including (1) substitution of DC–delivered care for traditional MD/DO-provided care, especially for spine treatment; (2) treatment profiles with a more conservative yet less invasive approach; and (3) DC–managed care that leads to lower health care costs. Legoretta concluded that both lower overall health care costs and stronger clinical results resulted from systematic access to managed DC care. [18]
In this study entitled “Comparative analysis of individuals with and without chiropractic,” claims data outcomes were analyzed over a 4–year period. They compared health care expenditures of 700,000 health plan members who had a chiropractic benefit with 1 million members of the same plan without the same benefit. They concluded that members with insurance covering DCs had lower annual total health care expenditures ($1,463 vs $1,671 per member per year with 1% level of significance) compared to those without DC coverage. Moreover, there was a 1.6% decrease in total annual health care costs associated with DC coverage (with 1% level of significance) at the health plan level. Next, members who sought treatment for back pain who had DC coverage also had lower utilization (17.5 vs 22.7, P < .01), low back surgery (3.3 vs 4.8, P < .01), hospitalizations (9.3 vs 15.6, p < .001), and magnetic resonance imaging (43.2 vs 68.9, P < .01) per 1000 episodes of plain radiographs. Finally, average back paid episode-related costs were lower for patients with DC coverage ($289 vs $399, P < .01).
DC–Delivered Care Effective for Acute and Chronic Low Back Pain
In 2007, a joint study between the American Pain Society and the American College of Physicians (APS-ACP) considered nonpharmacologic therapies available for acute and chronic low back pain. [19] They analyzed evidence from systematic reviews and randomized controlled trials about nonpharmacologic therapies for low back pain. The study considered all therapy treatments in patients with nonspecific low back pain or with patients who may or may not have complained of sciatica. They concluded that when chiropractors use treatments including spinal manipulation, exercise, cognitive-behavioral therapy, and interdisciplinary rehabilitation, all are shown to be moderately effective for chronic or subacute low back pain.
Spinal manipulation was also recognized by the panel in their guidelines as an effective treatment for both acute and chronic low back pain. The panel noted that over 90% of spinal manipulations are performed by DCs. [20] These guidelines are also consistent with 1994 Guidelines on Acute Lower Back Pain in Adults published by the US Agency for Healthcare Policy and Research. As noted in Bigos et al, expert panels performed a full review of all existing research before preparing both the APS-ACP guidelines and the earlier Agency for Healthcare Policy and Research guidelines. [21]
The Cost-Effective Nature of DC–Delivered Services for Back and Neck Pain
The nation’s largest health insurer, United Health Group (UHC), published a study in 2007.22 This study, performed by American Chiropractic Network Group (ACN), a subsidiary of UHC, demonstrated that orthopedic conditions contribute to more medical expenses than any other condition. In addition, back and neck pain account for a percentage greater portion of orthopedic expenses than other orthopedic conditions. Another significant conclusion of the report is that DC–delivered services for back and neck pain are significantly more cost-effective when compared with all alternative approaches. The UHC group also concluded that the most significant factor in lowering cost was the profession of the doctor with whom care begins.
To summarize these results, when a DC initiates care, the adjusted total episodic costs are lower than for care started with a primary care MD/DO. Moreover, orthopedists, physical medicine rehabilitation physicians, and other practitioners also exhibit significantly higher costs. The 2 chief conclusions in this report are (1) “When the first provider seen is a conservative provider [ie, a DC], treatment appears to be characterized by spinal manipulation and active/passive therapies” [22] and (2) “When the first provider seen is a PCP [primary care physician], spine care appears to be characterized by radiology, pharmacy, hospitalization and surgery.” [22] The report concluded that the alignment of decision making with current clinical evidence by Minnesota DCs produced large improvement in disability at a low episode cost.
Mercer Study Concludes DC–Delivered Care Is Cost-Effective
In 2009, Arnold Milstein of Mercer Health and Benefits and Niteesh Choudhry of Harvard Medical School compared DC–delivered care to that provided by medical physicians. [22] Choudhry and Milstein noted that the annual cost for treatment of neck pain by chiropractic physicians was $302 lower than treatment from medical physicians. Similarly, they concluded, “When considering effectiveness and cost together, chiropractic physician care for low back pain and neck pain is highly cost-effective and represents a good value in comparison to medical physician care and to widely accepted cost-effectiveness thresholds.”
The authors also indicate, “Our findings in combination with existing US studies published in peer-reviewed scientific journals suggest that DC delivered care for the treatment of low back and neck pain is likely to achieve equal or better health outcomes at a cost that compares very favorably to most therapies that are routinely covered in US health benefit plans.” [23] In other words, both value and clinical outcomes show marked improvement with the addition of DC coverage for the treatment of low back and neck pain in US employer–sponsored health benefit plans.
Seeking DC Treatment First Saves 40% on Health Care Costs
It has been estimated that 80% of Americans experience lower back pain at some time in their lives. [24] The impact is tremendous. Dieleman et al estimated total US spending on personal health care expenditures. As part of their analysis, they also determined that $87.6 billion was spent annually on low back and neck pain. [25] This rate of spending indicates that spine pain is among the top 10 most costly conditions treated in the United States. These expenditures do not include those from the decrease in employee productivity. This study first interviewed patients and concluded that spinal manipulation was a very safe treatment and provided mild to moderate relief from low back pain and appeared to be as effective as conventional medical treatments.
They next set out to investigate the cost-effectiveness of spinal manipulation treatments by DCs. Over a 2–year period, a BlueCross BlueShield (BCBS) of Tennessee study examined their intermediate and large group fully insured population of 85,000 subscribers. [26] The objective of the study was to compare the costs of care from MDs vs DCs. To facilitate this comparison, the BCBS subscribers could choose between MDs and DCs through self-appointment, and there were no limits imposed for the number of MD/DC visits allowed and no differences in copays. Therefore, the data from this study reflect the costs and outcomes when chiropractic physician and medical physician services are compared on an even playing field.
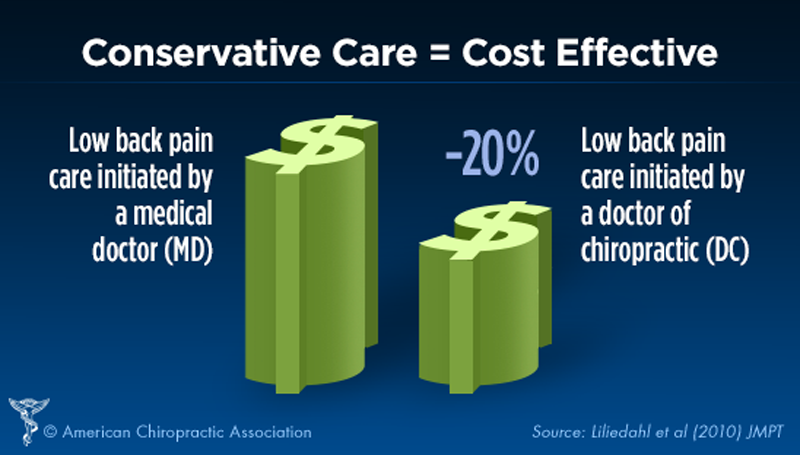
They concluded that patients who experience low back pain and seek treatment first from a DC rather than an MD/DO save 40% on average of health care–related costs. In addition, after risk adjusting for patient’s costs, they found that episodes of care started with a DC were 20% less expensive than episodes started with an MD/DO. The researchers estimated that for the 85,000 subscribers of BCBS of Tennessee, DC–initiated episodes of care could lead to an annual cost savings of approximately $2.3 million. The study concluded with the recognition that insurance companies may be inadvertently paying more for care with restricted access to DC–initiated care than if such restrictions were removed.
DC–Delivered Treatment Is Cost-Effective: APS-ACP Guidelines
Lin et al recognized that health care costs for low back pain (LBP) are growing rapidly in the United States. [27] Hence, they emphasized the importance of providing treatments that were both effective and cost-effective. The main goal of their review was to consider if the guideline-endorsed treatment for LBP was cost-effective. The 3 types of data that they extracted were the type and perspective of the economic evaluation, the treatment comparators, and the relative cost-effectiveness of the treatment comparators. The scope of the evaluation included twenty-six studies. Spinal manipulation was determined to be cost-effective for both subacute and chronic low back pain. This review also determined that other modalities normally within the DC’s scope of practice such as exercise, acupuncture, and interdisciplinary rehabilitation were also cost-effective and endorsed in the APS-ACP guidelines.
Seeing a DC Does Not Increase Overall Medical Spending
Health care costs associated with use of complementary and alternative medicine (CAM) (chiropractic, homeopathy, herbalism, acupuncture, and massage) by patients with spine concerns had not been studied in a national sample prior to a recent study. [28] The objective of this study was to determine the total and spine-specific medical expenditures among CAM and non-CAM users with spine problems. The Medical Expenditure Panel Survey Study investigated 12,036 records to assess the cost of treating patients with low back and neck pain. The authors estimated the expenditures for care among CAM and non-CAM users and included a DC–specific analysis of expenditures for DC users vs non-DC users.
As insurance coverage has increased, CAM use among patients with spine problems has increased. [8, 29–31] Moreover, adults in the United States who chose DC care, the most common type of CAM used by people with spine problems, has increased by 57% from 1997 to 2006. [32]
This study by Martin et al also conducted an exhaustive analysis on the same key question posed in this study. [28] Does the consumption of DC and CAM services reduce the need for more expensive medical care, or does it merely supplement and add on to medical cost rather than replacing it? [33] They studied claims data from large insurers and cost-effectiveness studies and concluded that CAM coverage does not increase health care costs for the general population. [34–38] Before the Martin study, a national sample had not been examined for the impact of CAM use on total health care costs or for specific types of services (eg, inpatient, outpatient, prescriptions, and emergency services).
Martin also considered the proposition that treatment by CAM providers lowers cost when compared with treatment from traditional medical providers. The report questioned whether differences in demographic, clinical, and treatment preferences might be significant when comparing CAM and non-CAM users. As an example, CAM users might be younger, more physically active, and less obese or have a higher level of education and income than non-CAM users. [39] To further understand this question, they estimated both total spine-specific costs with self-reported spine problems for both CAM and non-CAM users, drawing data on health care utilization and cost from a nationally representative survey. To adjust observed differences, both linear regression and propensity score matching were used. Observed differences for CAM and non-CAM users included demographic, clinical, socioeconomic, and health status.
The study recognized that DCs provided approximately 75% of all CAM services. The analysis also determined that overall medical spending was not increased from seeking care from CAM or a DC. Adjusted annual health care costs among DC users were $424 lower for spine-related costs when compared with non-CAM users.
The BCBS study cited earlier by Liliedahl indicated a cost savings of 40% when individuals first see a chiropractic physician. The implication is that DCs could provide treatment for 60% of this cost or $461.93 (.6 × $769.88). When dividing this figure by 8 assumed annual visits (Missouri fiscal note 2016) to the chiropractic physician, the resulting cost is $57.74 per visit, which is reasonably close to the cost of an average visit to the chiropractic physician. Additionally, hospitalization expenditures were significantly lower for those who used complementary and alternative providers, including DCs.
Canadian Study: DCs Provide More Cost-Effective Than Usual Care
Paul Bishop conducted a hospital-based study at the University of British Columbia. [40] This study is unique and cutting edge, as it was the first to compare Clinical Practice Guidelines (CPG)-based treatment to traditional medical and usual care when treating patients with significant lower back pain. The CPG-based treatment included spinal manipulation therapy from DCs. A primary conclusion of the study was that the CPG-based treatment led to stronger gains in function for patients. In other words, the DC–delivered spinal manipulations were very effective. They compared guideline-based care (including chiropractic spinal manipulation) for low back pain compared to usual care administered by primary care medical physicians. They found (1) guidelines-based care that included spinal manipulation delivered by DCs was significantly more effective than “usual care” and (2) care by primary care MDs was highly guideline-conflicted.
DC–Delivered Manipulation Less Costly Than Physiotherapy or GP Care
The Tsertsvadze et al study reviewed trial-based economic evaluations comparing the management of spine-related conditions by manual therapy vs other alternative interventions. [41]
They analyzed trial-based economic evaluations on cost-effectiveness or cost utility; interventions of manual therapy for treatment of spinal, shoulder, and ankle pain were compared with other alternative treatments. They found that manual therapy techniques were more cost-effective for low back and shoulder pain and disability than care delivered by general practitioners (GPs) alone or with exercise, spinal stabilization, GP advice, advice to remain active, or brief pain management. Manual therapies evaluated include osteopathic spinal manipulation, physiotherapy manipulation or mobilization, and DC–delivered manipulation either alone or with other treatment.
More specifically, the Tsertsvadze study showed DC–delivered manipulation to be less costly and more effective for neck pain than the alternatives. Evidence showed manual therapy to be economically advantageous compared with other treatments of musculoskeletal conditions. Finally, the manual therapy techniques evaluated appeared to be more cost-effective than usual care.
DC–Delivered Treatment 38% More Effective Compared to GP Care
According to Schneider, of patients receiving manipulation performed by DCs, 94% had a 30% reduction in low back pain after 4 weeks. In contrast, 56% of medical care recipients had the same reduction. [42] This suggests a 38% increase in effectiveness by seeing a DC first. The study determined that patients were better off when informed of nonpharmacologic therapies for low back pain before using other riskier and less effective treatments. They also determined that manual-thrust manipulations (MTMs) performed by DCs achieved improved short-term pain reduction compared with common medical treatments.
They compared how effective MTM was compared to mechanical-assisted manipulation (MAM) and manipulation vs usual medical care. The most common type of manipulation used by DCs is MTM. This study showed that this type of manipulation (MTM) provided short-term improvement in disability and pain over MAM or usual medical care for acute low back pain.
The authors randomly selected 107 adults with recent low back pain. They compared outcomes from different therapeutic approaches: spinal manipulation (MTM or MAM); usual medical care; or advice to be physically active, avoiding bed rest. Each manipulation group received 8, 15–minute office visits at 2 visits per week. The usual care group received 3 office visits consisting of a 30–minute initial visit and 2, 15–minute follow-ups. All groups completed their treatment within 4 weeks.
At 4 weeks, significant reductions in self-reported pain and disability were noted in the MTM group over either the MAM or usual medical care group. At 3 and 6 months, there was no significant difference among the 3 groups. For patients with acute or subacute low back pain, the authors determined that MTM should be considered for short-term relief.
DC Treatment Lowers Costs and Increases Positive Outcomes
More US adults have chronic pain than heart disease, diabetes, and cancer combined. [43] The type of pain considered in this study includes headache, neck or back pain, arthritis, or joint pain along with other chronic pain. Chronic neck pain constitutes a substantial burden to society, although it is often considered benign. [44] In the United States, neck pain is one of the top musculoskeletal disorders in the adult population. [45] Moreover, the fourth most pervasive reason for disability globally is neck pain. Between 1990 and 2010, the United States has experienced a 29% increase in neck pain. [46] Even though neck pain is such an acute problem in the United States, little data are available comparing the cost-effectiveness of common treatments. To address the shortage of cost data for comparative treatments of neck pain, Leininger et al (2016) compared the cost-effectiveness of home exercise and advice (HEA), spinal manipulative therapy (SMT) plus HEA, and supervised rehabilitative exercise (SRE) plus HEA. The research design for the Leininger study consisted of a cost-effectiveness analysis and a randomized clinical trial. The patient sample consisted of a total of 241 older adults (≥65 years) with chronic mechanical neck pain. [47]
The results of the Leininger et al study indicated that total costs for SMT with HEA were 5% lower than HEA (mean difference: –$111) and 47% lower than SRE + HEA (mean difference: –$1932), [32] which also resulted in a greater reduction of neck pain over the year relative to HEA and SRE+. Differences in disability and quality-adjusted life years favored SMT + HEA.
Summary of Literature on Cost Savings From DC Care
Although all the studies mentioned earlier document the savings from DC treatment compared to traditional MD/DO care, a few of them provide specific dollar amounts or percentages. First, the Mercer study concluded that the annual cost of treatment of neck pain by chiropractic physicians was $302 lower than that from medical physicians. Second, Legorreta examined over 700,000 health care plans to conclude that members with insurance coverage for DCs had lower total annual health care expenditures. Third, the largest study examined in this section was a 2–year analysis of data from 85,000 BCBS subscribers. In this study, Liliedahl determined that patients with low back pain who seek treatment first from a DC rather than an MD/DO save an average of 40% on health care costs. Moreover, they also concluded that the risk-adjusted percentage is 20% for savings from those who seek DC care first. We incorporate these results of 40% and 20% savings, respectively, into our dynamic scoring model presented later in this study.
Section 3: Increasing Incidence of Spine Surgery
There is an 80% chance that people will have back pain at some point in their lives. [48] To treat this pain, medical physicians are quite likely to recommend over-the-counter pain medication or prescription medication to temporarily relieve the pain. Depending on the doctor’s assessment and the patient’s response, spine surgery may become a likely recommendation. [49, 50] However, as discussed later, research shows that DCs are the safest and most effective alternative to surgery for most cases of back pain. The purpose of this section is to survey the literature and document both the typical costs associated with spine surgery and to ascertain whether and to what degree that certain surgeries may be avoided through care provided by DCs. The data documented in this section will also be incorporated in the dynamic scoring model.
Published research has shown that spine surgeries can be avoided through DC–managed care. For example, Keeney observed reduced odds of surgery for those who first saw a chiropractor. Approximately 42.7% of workers who first saw a surgeon had surgery in contrast to only 1.4% who saw a chiropractor. [51] Daubs found that conservative management techniques are preferred to surgery with patients who experience personality disorders. [52] Mirza found that the chances of having spine surgery were higher if the patient was initially seen at a private practice site vs an academically affiliated hospital. [53] Finally, Jain determined that those who are chronic users of opioids have more negative postoperative outcomes. [54]
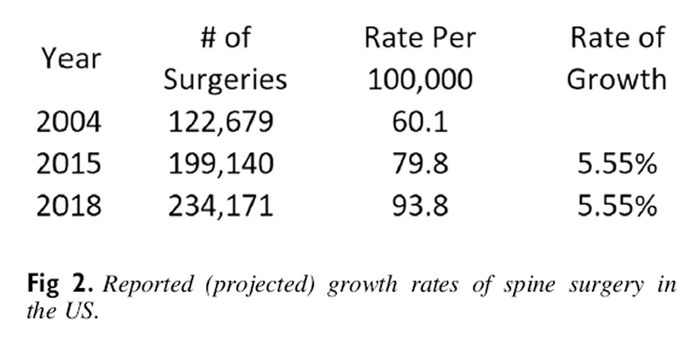
Figure 2 Another recent study by Deyo concluded that back pain is overtreated with spine surgeries in the United States. Deyo argued that the dramatic rise in lumbar fusion rates occurred despite the absence of any specific reports of clarified indications or better efficacy. They drew on Medicare Expenditure Panel Survey data to show that from 1991 to 2000, lumbar spine fusion rates for degenerative conditions increased 220% to 61.1 from 19.09 per 100,000. [55] Martin projected subsequent increases in spine fusion rates from 2004 to 2015. [56] They determined that elective lumbar fusion rates increased from 122,679 cases in 2004 (60.4 per 100,000) to 199,140 (79.8 per 100,000) in 2015. The age bracket with the greatest increases was the group 65 or older, where the estimate grew to 170.3 per 100,000. These reported growth rates for spine surgeries are shown in Figure 2. The computed average growth rate between 2004 and 2015 is 5.55%. Using this average growth rate, the number of projected spine surgeries is 93.8 per 100,000 by 2018.
Cost of Spine Surgery
Per numerous sources, total costs related to spine surgery are projected to be well more than $100,000. [49, 57, 58] Back surgeries are among the most expensive operations performed. Consider the following initial per-surgery costs for various types of back surgeries:
Anterior cervical fusion: $44,000
Cervical fusion: $19,850
Decompression surgery: $24,000
Lumbar laminectomy: $18,000
Lumbar spinal fusion: $34,500
According to Deyo, the average hospital expenses for just surgical decompression and complex fusions alone start at just more than $23,000 for the former and more than $80,000 for the latter. This cost is independent of such others as hospitalization, X-rays, or medications. [59]
Another recent study conducted at Rush University Medical Center in Chicago considered the cost-effective limit for spine surgery. This study was the first to systematically follow health care expenditures along with health outcomes. They concluded that $100,000 was the maximum cost whereby spine surgery procedures are considered cost effective. [60]
Complications From Spine Surgery
Deyo and colleagues examined Medicare claims from 2002 to 2007 to evaluate the rate of problems or complications from spine surgery. They found that while the rates of surgery declined in total, the rate of complex lumbar fusion surgeries increased over 14–fold from 1.29 to 19.8 per 100,000 beneficiaries. They also found a correlation between complicated surgeries and potentially mortal complications. For example, the risk of severe complications was just more than 2% for patients having decompression surgery by itself. The rate grew to 5.6% for those having complex spine surgeries56 Another study collected data and evaluated 338 patients who experienced lumbar spine surgery between 2007 and 2011. They determined that 55 patients exhibited at least 1 complication from surgery. They also concluded that being over age 65 was not a predisposing risk factor for surgery. [61]
DC Treatment Effective: Leads to 60% Reduction in Spinal Surgery
McMorland et al compared the cost and benefit of DC–delivered spinal manipulation and lumbar microdiscectomy in patients with low back pain associated with disk herniation. [62]
They considered the minimally invasive surgical procedure known as a microdiscectomy, where the surgeon removes the part of the disc that is putting pressure on a nerve root or the spine. The study concluded that 60% of patients with sciatica benefited from spinal manipulation after attempting medical management and failing to experience any improvement.
Cost Savings Through the Avoidance of Spinal Surgeries
As explained earlier, the rate of growth in spine surgeries in the United States has been more than 33 persons per 100,000 since 2004. In light of the research showing that DC–managed care can reduce the incidence of spinal surgery, it is reasonable to suppose that a number of surgeries could be avoided through routine DC management. The calculation to compute such savings is discussed under the dynamic scoring model in the final section of this study. One fact is sure, patients in the Missouri Medicaid system would benefit from the avoidance of spinal surgeries, and this would lead to significant cost savings for the state.
Section 4: The Opioid Analgesics Epidemic
Prescription opioid use is steadily increasing across the United States and in Missouri. Opioid abuse affects all branches of society. More than 130 people die each day in the United States from opioid overdose. The misuse of prescription pain relievers, heroin, and synthetic opioids such as fentanyl and other opioids constitute a serious national crisis. [63] This includes the cost of health care, lost productivity, addiction treatment, and criminal justice impacts. [64] The opioid abuse rate in Missouri is worse than the national average. For example, in 2017 in Missouri, there were 952 overdose deaths due to opioids. This rate is higher than the national rate of 14.6 deaths per 100,000 persons. [65] The Missouri Hospital Association estimated the total “economic burden” of prescription opioid misuse in the United States was $685 billion annually and estimated that the cost of the opioid abuse in Missouri as greater than $14 billion. [66]
How to Reduce Opioid Costs Related to Low Back and Neck Pain
The purpose of this section is to consider the impact of opioid abuse on costs related to low back and neck pain. [67] Recent published research has shown that the rate of opioid use is lower for patients who receive treatment from DCs (19%) when compared to non-recipients (35%). Moreover, the probability of getting a prescription for opioids was 55% lower in the chiropractic recipient cohort. Opioid prescription refills were also 78% lower for patients who received treatment from DCs in average annual per-person costs. [68] This is an example of a growing body of research that is promoting DC–delivered care as an alternative to the use and abuse of opioid prescription drugs. [69] The inclusion of chiropractic care under Medicaid has spread to 27 states. [70]
Policymakers Prioritize DC Management Over Painkillers and Surgery
The latest research in back pain has also bolstered Oregon policymakers’ decision to allow DCs as another treatment option under Medicaid. One of the researchers cited in this study, Dr. Richard Deyo, served on the task force that advised the Oregon Health Evidence Review Commission. As pointed out in this study, Deyo also informed the Commission that large, randomized trials have shown how DC–delivered therapy is equally effective and more cost-efficient that usual medical care. Dr. Ariel Smits, medical director for the Health Evidence Review Commission, criticized the prior state of affairs in the Oregon Health Plan (OHP). Before the policy change, 8% of OHP members in 2013 saw a medical provider for back conditions, and over half of those patients received narcotics. The 2015 National Survey on Drug Use and Health sought to document the extent of the overprescription of opioids in the United States. [71] The survey revealed that nearly 38% of the US population, or 92 million adults, took doctor-prescribed Oxycontin or Percocet. The fact that DCs do not prescribe opioids provided further impetus for the OHP to begin covering DCs in 2016.
This research in Oregon led to a major legislative change in 2016 when many Oregon patients with chronic back pain were given a host of new treatment options. [72] The addition of DC–managed care represents a huge shift from previous policy, which heavily favored narcotics as the first line of defense against pain. [73, 74] For example, in 2013, more than half of all OHP Medicaid patients received narcotics. Before this change, many OHP members who had back pain had been left with no choice but to take drugs. Policymakers recognize that DCs treat low back and neck pain without resorting to the prescription of opioids or any other type of drugs. After considering the recommendations of the Health Evidence Review Commission, policymakers in Oregon concluded that the old policy could be contributing to Oregon’s high rate of narcotic abuse.
Missouri Policymakers Recognize Chiropractic Alleviates Opioid Cost
As noted earlier, in their fiscal note dated February 9, 2018, the Missouri Oversight Committee recognized the savings that would accrue to the state if individuals sought DC care rather than traditional MD/DO care for neck and low back pain. This new direction for treatment is reflected in the press release by MO (Missouri) HealthNet. [75] The Missouri Department of Social Services announced that new treatment options for chronic pain will be available to MO HealthNet participants beginning with the second quarter of 2019. The director made the following announcement: “MO HealthNet providers simply need more options to effectively treat chronic pain. Such treatment options include physical therapy, cognitive-behavioral therapy, chiropractic therapy, non-opioid medication therapy, and acupuncture. The addition of these treatment options should optimize health outcomes and ultimately enable Missourians to resume normal and active family and work life.” [75]
The director shed additional light on this belief that such treatments as DC care would lead to reductions in costs from the abuse of opioid prescription drugs. The director stated, “MHD estimates that the addition of these new covered services will actually reduce costs by lowering prescription drug costs, eliminating emergency room visits, and avoiding the need for other medical services.” [76] The actual costs savings estimate from reduction in opioid abuse is discussed under the dynamic scoring model.
Section 5: Dynamic Score Model: Impact of Savings on Total Costs
Cost Savings From Inclusion of DCs Under Missouri Medicaid
The projected cost savings from adding DC coverage are determined in the dynamic scoring model used in this study. Here we implement our savings estimates documented from earlier parts of this study. When determining cost savings from offering services provided by DCs, the first variable to identify is the projected costs of medical care expenditures for neck and low back pain in Missouri.
Step 1: Determine Missouri Expenditures for Low Back and Neck Pain
Table 6
We began our estimation of the dynamic scoring model by computing the 2018 estimated health care expenditures allocated to Missouri for low back and neck pain. We rely on data published by Dieleman et al for the starting point of our estimation. [25] The 2013 estimated amount spent on low back and neck pain is $87.6 billion. Updating this figure to 2018 using the average estimated growth rate of 6.5%, health care expenditures increase to $120 billion. [25] The next step in our calculation is to prorate these expenditures based on Missouri’s population to determine the 2018 estimated expenditures in Missouri for low back and neck pain. The 2018 estimated Missouri population is 6,147,851. [77] The estimated 2018 US population is 329,146,892. [78] Based on these population figures, the 2018 estimated expenditures in Missouri for neck and low back pain is $2.241 million. Finally, we allocate these expenditures to individuals within MHN based on population. As shown in the fiscal note for 2018, there are 226,489 adults in MHN. We divide this number by the Missouri population (excluding children and seniors) and multiply by $2.241 million. [79] The resulting figure is $106,402,200 for health care expenditures for individuals in MHN. This number is displayed in row 3 of Table 6.
Step 2: Determine Individuals in MHN Who Would Likely Seek DC Care
The next step is to identify the number of individuals who would likely seek DC care in MHN. The Committee used the percentage of 9% as the estimate of the population that would seek DC guided care. As we desire to estimate a range of savings, we also compute savings for both the 8% and 10% figures. This way we can accommodate the variance in this estimate over time. These percentages are displayed in row 1 of Table 5.
Step 3: Identify Savings Percentages From Employment of DC Care in MHN
The savings percentages determined from the Lilidahl study are 20% and 40%, respectively.26 These percentages, displayed in row 2 of Table 6, are used next to compute cost savings from offering DC care. We also compute savings assuming a 30% reduction in cost. Using these percentages, the initial savings are computed as the product of the following 3 variables: cost of usual medical care, percent of MHN participants who would choose to seek a DC, and percent savings through seeing a DC first vis-ŕ-vis usual medical care. Accordingly, the projected initial cost savings are between $2.5 and $6.4 million as shown in line 4 of Table 6.
Step 4: Determine Cost Savings From Reduction in Spinal Surgeries
As noted earlier, back pain is overtreated with spine surgeries in the United States. Deyo first projected that growth in spine surgeries in the United States grew to 60.1 per 100,000 between 1991 and 2000. [59] Similarly, Martin et al projected subsequent increases in spine fusion rates from 2004 to 2015. [56] They determined that elective lumbar fusion rates increased from 122,679 cases in 2004 (60.4 per 100,000) to 199,140 (79.8 per 100,000) in 2015. Using the computed average growth rate, we projected the rate of spine surgeries in 2018 as 93.8 per 100,000. Given the MHN number of adults in 2018 as 226,489, this translates to the rate of 2.26489 per 100,000. Next, multiplying this rate by the 2018 rate of 93.8 surgeries per 100,000, we arrive at total spine surgeries of 212. To arrive at cost, we multiply by 100,000. The resulting total cost of spine surgeries in MHN adults is $21,200,000 as displayed in row 6 of Table 2, Table 2.
Based on the McMorland et al study, 60% of spinal surgeries could be avoided through DC care. [62] Accordingly, we use a range of between 40% and 60% to compute cost savings from reductions of spinal surgeries in Missouri as shown in row 5. Finally, we multiply row 5 by row 1 to determine the total projected savings from reduced spinal surgeries in Missouri. This result is shown in row 7 where cost savings range from $339,000 to $848,000. In terms of cost savings, a significant reduction in the number of spinal surgeries could be highly impactful. For example, the total annual cost of 200,000 microdiscectomies in the United States is $5 billion. Cutting back on spinal surgeries would lead to a direct savings of $3 billion each year.
Step 5: Determine Cost Savings From Reduction in Opioid Prescription Abuse
According to a 2016 survey by the National Academy for State Health Policy, a dozen states have approved and implemented the use of alternative therapies to help patients manage their pain and limit their dependence on opioids. [73] The state of Missouri is now included in that list. The estimated cost of opioid abuse in Missouri is $14 billion and is shown in row 8 of Table 2, Table 2. The Committee arrived at the figure of $25 million as their estimate of savings from reduction in opioid dependence. They did not provide details for their computation. However, we can arrive at the $25 million by multiplying the $14 billion by 9% of individuals who would choose DC care times a modest 2% decrease in the cost of opioid abuse. We also included estimates with a 1% and 3% reduction in opioid cost.
The total savings from the dynamic scoring model can now be computed. As the Committee has included the primary savings from reduced reliance on opioid prescriptions, the relative differences in our estimates is quite modest. We project total cost savings from DC care to be between $14.1 and $49.3 million. The Missouri Committee estimated savings of approximately $25 million from the reduction in opioid abuse alone.
Outcomes
After presenting this information along with testimony to both House and Senate committees, the house passed the legislation with only 4 no votes and it passed the senate 32–0. Governor Mike Parsons then signed the legislation into law. Currently the Missouri Department of Health is developing an implementation process to include credentialing for DCs. Based on the new enabling legislation, we expect to see the addition of insurance coverage for chiropractic physicians in the annual budget that began July 1, 2019.
Summary
This study began with a review of the methodologies and data used by the MHD in their fiscal note computations regarding the inclusion of DC care for the state of Missouri. The MHD had used increasingly flawed assumptions and methodologies over the past years in their cost estimates. For example, cost estimates were based on assumptions that people would seek services that are not covered and that they did not need. On the positive side, the MHD did make a brief reference in the FY2015 fiscal note to the key idea that a visit to a DC leads to fewer trips to the medical physician office. However, they ignored any cost savings in their analysis. In other words, they used the flawed methodology of static scoring rather than the more accurate approach of dynamic scoring. The Committee did embrace a major element of dynamic scoring for the FY2018 fiscal note where cost savings from reduction in opioid abuse were identified.
The second section of this study examined current research on the cost-effectiveness of DC–delivered care compared to usual medical care. Several interesting and relevant conclusions emerged. First, people with insurance coverage that includes DCs had lower annual health care costs. For example, the BCBS study documented that those who seek DC–guided treatment first saved an average of 40% on annual health care costs. Second, they concluded that seeking treatment from a DC did not add to overall medical spending. [28] Thirdly, DC–directed treatment led to a 60% decrease in spinal surgeries. [62] Fourth, DC–directed care was 38% less costly than usual medical care. [42] Fifth, DC–delivered care lowered costs and increased positive outcomes. [43] In summary, these studies showed that for conditions covered by Medicaid and treated most often by DCs, care is more cost-effective than competing methods.
Section 3 of this study considered the impact of DC–provided care on the likelihood that patients would need or seek spinal surgeries to relieve neck and low back pain. Studies show that DC care can reduce the rate of spinal surgeries by 60%. We determined that such savings would add almost another million dollars of savings in the dynamic scoring model.
The fourth section of this study considered the financial impact of the opioid crisis in Missouri and other states. Another state that recently passed an initiative to include DCs under its Medicaid program is Oregon. As part of the approval process, Dr Deyo advised the Oregon Commission of the benefits of DC–delivered treatment in reducing patients’ tendencies to get hooked on painkillers. As a result, the state of Oregon added DCs in 2016 to the Medicaid options. After examining the evidence, the Oregon Commission concluded this would be a positive alternative to inadvertently contributing to the opioid epidemic in this country.
Too often, people who seek relief from lower back pain through usual medical care end up taking painkillers, which are addictive and lead to negative outcomes. Conversely, patients who visit DCs not only find relief from neck and lower back pain at lower annual cost, but also they report their outcomes to be more effective. There are now a dozen states that have embraced alternative therapies such as DC care to combat the cost of the opioid abuse epidemic. The MHD Committee estimated that such savings would exceed $25 million by 2019. Our dynamic scoring model estimated savings of up to $42 million.
The final section of this study incorporated the assumptions derived in earlier parts of this study and computed the total savings from DC care in the context of the dynamic scoring model. There are 3 primary components of savings in this model. First, savings from DC care ranged from $2.5 to $6.4 million. Second, savings from reduced costs of spine surgery are between $375,000 and $942,000. Third, the largest source of savings in the model is from reduced costs from reduction of opioid abuse. Savings in this category ranged from $11.2 to $42.0 million. Adding the 3 categories of savings brings the total between $14.1 and $49.2 million.
An earlier version of this study was presented at 2 separate hearings of the Missouri legislature in spring 2017. After this presentation, the Committee eliminated the consideration of medically unnecessary procedures. The Committee also made refinements in their methodology by using the proper procedure codes, eliminating the number of adults in MHN who are also covered by Medicare, and officially incorporating cost savings from reduction in opioid abuse into their analysis. The Missouri legislature recently approved DC care under Missouri Medicaid. This study played an important role in their decision.
Limitations of the Study and Future Research
When researchers adopt assumptions based on specific studies, there is a risk that the results may not be generalizable across other populations and periods. Although it is difficult to deny that human behavior responds to legislative change, it is hard to predict exactly how people will act. We use assumptions derived from peer-reviewed studies from other states’ experience when DC–delivered care is adopted. There is no guarantee that the Missouri population will respond in the same way as populations in other states. An extension of this study would be possible in states where DC care is added as an option for coverage. Costs could then be estimated to determine whether savings are, in fact, realized.
Conclusion
Policymakers may unintentionally rely on flawed assumptions and methodologies such as static scoring, which we propose results in flawed conclusions. Legislative options involve some additional cost. The issue is whether proposed legislative options offer more effective outcomes along with more efficient cost. Using a dynamic scoring model to incorporate savings from 3 primary sources, we found that (1) chiropractic care provides better outcomes at lower cost, (2) chiropractic treatment and care leads to a reduction in costs of spinal surgery, and (3) chiropractic care leads to cost savings from reduced use and abuse of opioid prescription drugs.
Practical Applications
This study brings to light the research showing both the efficacy and cost efficiency of care delivered by DCs compared to traditional medical care.
This information highlights the problems and cost from the increasing incidence of spine surgery.
The Missouri legislature used static scoring to determine the cost of including a competing provider group like DCs.
Finally, the study shows how the inclusion of care by DCs may reduce the severity of the opioid crisis.
Acknowledgments
We thank Dr Quinn James for his valuable suggestions for articles and his helpful input for analysis.
Funding Sources and Conflicts of Interest
This study was funded by the Missouri Chiropractic Association. No funding conflicts of interest were reported for this study.
Contributorship Information
Concept development (provided idea for the research): J.M., L.S.
Design (planned the methods to generate the results): JM., L.S.
Supervision (provided oversight, responsible for organization and implementation, writing of the manuscript): J.M., L.S.
Data collection/processing (responsible for experiments, patient management, organization, or reporting data): J.M., L.S.
Analysis/interpretation (responsible for statistical analysis, evaluation, and presentation of the results): J.M., L.S.
Literature search (performed the literature search): J.M., L.S.
Writing (responsible for writing a substantive part of the manuscript): J.M.
Critical review (revised manuscript for intellectual content, this does not relate to spelling and grammar checking): L.S.
References:
Boline, PD, Kassak, K, Bronfort, G, Nelson, C, and Anderson, AV.
Spinal Manipulation vs. Amitriptyline for the Treatment of Chronic
Tension-type Headaches: A Randomized Clinical Trial
J Manipulative Physiol Ther 1995 (Mar); 18 (3): 148–154Hoving JL, Koes BW, de Vet HC, van der Windt DA, Assendelft WJ, van Mameren H, et al.
Manual Therapy, Physical Therapy, or Continued Care by a General Practitioner
for Patients with Neck Pain. A Randomized, Controlled Trial
Annals of Internal Medicine 2002 (May 21); 136 (10): 713–722Nyiendo, J, Haas, M, and Goodwin, P.
Patient Characteristics, Practice Activities, and One-month Outcomes
for Chronic, Recurrent Low-back Pain Treated by Chiropractors and
Family Medicine Physicians: A Practice-based Feasibility Study
J Manipulative Physiol Ther 2000 (May); 23 (4): 239–245Korthals-deBos IBC, et al.
Cost Effectiveness of Physiotherapy, Manual Therapy, and General Practitioner Care
for Neck Pain: Economic Evaluation Alongside a Randomised Controlled Trial
British Medical Journal 2003 (Apr 26); 326 (7395): 911Health Source
21 benefits of chiropractic. Healthy Living
www.healthsourcechiro.com, Accessed 15th Jul 2019J. Zenk,
Dynamic scoring in practice Briefing Paper No. 64
Harvard Law School (May 9, 2017)Centers for Medicare & Medicaid Services
Medicaid & CHIP: July 2016 Monthly applications, eligibility determinations and monthly report.
September 27, 2016
https://www.medicaid.gov/medicaid/program-information/downloads/july-2016-enrollment-report.pdfBarnes PM , Bloom B , Nahin RL:
Complementary and Alternative Medicine Use Among Adults and Children:
United States, 2007
US Department of Health and Human Services,
Centers for Disease Control and Prevention,
National Center for Health Statistics, Hyattsville, MD, 2008.Rupert RL:
A Survey of Practice Patterns and the Health Promotion and Prevention
Attitudes of US Chiropractors Maintenance Care: Part I
J Manipulative Physiol Ther 2000 (Jan); 23 (1): 1–9L.R. No. 5439-01, Bill No. HB 1939, March 9, 2016, P. 3.
American Physical Therapy Association
What providers of pediatric physical therapy services should know about Medicaid
Section on Pediatrics, American Physical Therapy Association, Alexandria, VA (2009)I. Coulter, R. Hayes, C. Danielson
The chiropractic satisfaction questionnaire
Topics Clin Chiropr, 1 (4) (1994), pp. 40-43C. Goertz, B. Whittmer, K. Hegetschweiler, D. Elton, T. Allenbert
The chiropractic report card: patient satisfaction survey study
J Am Chiropr Assoc, 34 (10) (1997), pp. 40-47J. Posner, C. Glew
Neck pain
Annals of Internal Medicine 136 (10) (2002), pp. 758-759C. Sawyer, K. Kassak
Patient satisfaction with chiropractic care
J Manipulative Physiol Ther, 16 (1) (1993), pp. 25-32Dagenais, S, Brady, O, Haldeman, S, and Manga, P.
A Systematic Review Comparing the Costs of Chiropractic Care to other
Interventions for Spine Pain in the United States
BMC Health Serv Res. 2015 (Oct 19); 15: 474D. Redwood
Chiropractic Cost-Effectiveness
Health Insights TodayLegorreta, AP, Metz, RD, Nelson, CF, Ray, S, Chernicoff, HO, and Dinubile, NA.
Comparative Analysis of Individuals With and Without Chiropractic Coverage:
Patient Characteristics, Utilization, and Costs
Archives of Internal Medicine 2004 (Oct 11); 164 (18): 1985–1892Chou R, Huffman LH; American Pain Society.
Nonpharmacologic Therapies for Acute and Chronic Low Back Pain:
A Review of the Evidence for an American Pain Society/
American College of Physicians Clinical Practice Guideline
Annals of Internal Medicine 2007 (Oct 2); 147 (7): 492–504Shekelle PG, Adams AH, Chassin MR, Hurqitz EL, Phillips RB, Brook RH.
The Appropriateness of Spinal Manipulation for Low Back Pain:
Project Overview and Literature Review
Santa Monica: RAND; 1991. R-4025/1-CCR-FCERBigos S, Bowyer O, Braen G.
Acute Lower Back Pain in Adults. Clinical Practice Guideline
Guide Number 14.
Rockville: U.S. Department of Health and Human Services,
Public Health Service, Agency for Health Care Policy and Research; 1994.
AHCPR Pub. No. 95-0643.D. Elton
Conservative treatment of spinal complaints
ACN Group (UnitedHealth Group) (2007)Choudhry N, Milstein A.
Do Chiropractic Physician Services for Treatment of Low-Back and Neck Pain
Improve the Value of Health Benefit Plans? An Evidence-Based Assessment
of Incremental Impact on Population Health and Total Health Care Spending
Mercer Health and Benefits LLC ~ October 12, 2009Rubin
Epidemiology and risk factors for spine pain
Neurol Clin, 25 (2) (2007), pp. 353-371Dieleman JL, Baral R, Birger M, et al.
US Spending on Personal Health Care and Public Health, 1996-2013
JAMA 2016 (Dec 27); 316 (24): 2627-2646Liliedahl RL, Finch MD, Axene DV, Goertz CM.
Cost of Care for Common Back Pain Conditions Initiated with Chiropractic
Doctor vs Medical Doctor/Doctor of Osteopathy as First Physician:
Experience of One Tennessee-Based General Health Insurer
J Manipulative Physiol Ther 2010 (Nov); 33 (9): 640–643Lin C-WC, Haas M, Maher CG, Machado LAC, Tulder MW.
Cost-effectiveness of Guideline-endorsed Treatments for Low Back Pain:
A Systematic Review
European Spine Journal 2011 (Jul); 20 (7): 1024–1038B. Martin, M. Gerkovich, R. Deyo, et al.
The Association of Complementary and Alternative Medicine Use and
Health Care Expenditures for Back and Neck Problems
Medical Care 2012 (Dec); 50 (12): 1029–1036T.J. Kaptchuk, D.M. Eisenberg
Varieties of Healing 2: A Taxonomy of Unconventional Healing Practices
Annals of Internal Medicine 2001 (Aug 7); 135 (3): 196–204Eisenberg DM, Davis RB, Ettner SL, Appel S, Wilkey S, Van Rompay M, Kessler RC.
Trends in Alternative Medicine Use in the United States, 1990 to 1997:
Results of a Follow-up National Survey
JAMA 1998 (Nov 11); 280 (18): 1569–1575K. Pelletier, J. Astin
Integration and reimbursement of complementary and alternative medicine by managed care and insurance providers:
2000 update and cohort analysis
Altern Ther Health Med, 8 (1) (2002), pp. 38-39 42, 44Davis, MA, Sirovich, BE, and Weeks, WB.
Utilization and Expenditures on Chiropractic Care
in the United States from 1997 to 2006
Health Serv Res. 2010 (Jun); 45 (3): 748-761Metz, RD, Nelson, CF, LeBrot, T, and Pelletier, KR.
Chiropractic Care: Is It Substitution Care or Add-on Care
in Corporate Medical Plans?
J Occup Environ Med 2004 (Aug); 46 (8): 847–855Sarnat, RL and Winterstein, J.
Clinical and Cost Outcomes of an Integrative Medicine IPA
J Manipulative Physiol Ther 2004 (Jun) ; 27 (5): 336–347Haas M, Sharma R, Stano M.
Cost-effectiveness of Medical and Chiropractic Care for Acuteand Chronic Low Back Pain
J Manipulative Physiol Ther 2005 (Oct); 28 (8): 555–563Nelson CF, Metz RD, LaBrot T.
Effects of a Managed Chiropractic Benefit on the Use of Specific Diagnostic
and Therapeutic Procedures in the Treatment of Low Back and Neck Pain
Journal of Manipulative and Physiological Therapeutics 2005 (Oct); 28 (8): 564–569Grieves B, Menke JM, Pursel KJ.
Cost Minimization Analysis of Low Back Pain Claims Data for
Chiropractic vs Medicine in a Managed Care Organization
J Manipulative Physiol Ther 2009 (Nov); 32 (9): 734–739B. Lind, W. Lafferty, P. Tyree, P. Diehr
Comparison of health care expenditures among insured users and nonusers of complementary and alternative
medicine in Washington State: a cost minimization analysis
J Altern Complement Med, 16 (4) (2010), pp. 411-417H. Ndetan, S. Bae, M. Evans, R. Rupert, K. Singh
Characterization of health status and modifiable risk behavior among United States adults
using chiropractic care as compared with general medical care
J Manipulative Physiol Ther, 32 (6) (2009), pp. 414-422Bishop PB, Quon JA, Fisher CG, Dvorak MF.
The Chiropractic Hospital-based Interventions Research Outcomes (CHIRO) Study:
A Randomized Controlled Trial on the Effectiveness of Clinical Practice Guidelines
in the Medical and Chiropractic Management of Patients with Acute Mechanical Low Back Pain
Spine J. 2010 (Dec); 10 (12): 1055-1064Tsertsvadze A, Clar C, Court R, Clarke A, Mistry H, Sutcliffe P.
Cost-Effectiveness of Manual Therapy for the Management of Musculoskeletal Conditions:
A Systematic Review and Narrative Synthesis of Evidence From Randomized Controlled Trials
J Manipulative Physiol Ther. 2014 (Jul); 37 (6): 343–362Schneider, M, Haas, M, Glick, R, Stevans, J, and Landsittel, D.
Comparison of Spinal Manipulation Methods and Usual Medical Care for
Acute and Subacute Low Back Pain: A Randomized Clinical Trial
Spine (Phila Pa 1976). 2015 (Feb 15); 40 (4): 209–217A. Tsang, M. Von Korff, S. Lee, et al.
Common chronic pain conditions in developed and developing countries:
gender and age differences and comorbidity with depression-anxiety disorders
J Pain, 9 (10) (2008), pp. 883-891C.H. van Randeraad-van der Zee, A.J. Beurskens, R.A. Swinkels, et al.
The burden of neck pain: its meaning for persons with neck pain and healthcare providers, explored by concept mapping
Qual Life Res, 25 (5) (2016), pp. 1219-1225C. Dos Santos Genebra, T. Maciel, P. Bento, S. Simeao, A. De Vitta
Prevalence and factors associated with neck pain: a population-based study
Braz J Phys Ther, 21 (4) (2017), pp. 274-280S.P. Cohen
Epidemiology, diagnosis, and treatment of neck pain
Mayo Clin Proc, 90 (2) (2015), pp. 284-299B. Leininger, C. McDonough, R. Evans, T. Tosteson, A. Tosteson, G. Bronfort
Cost-effectiveness of Spinal Manipulative Therapy, Supervised Exercise, and Home Exercise
for Older Adults with Chronic Neck Pain
Spine J. 2016 (Nov); 16 (11): 1292–1304J. Freburger, G. Holmes, R. Agans, et al.
The rising prevalence of low back pain
Arch Intern Med, 169 (3) (2009), pp. 251-258J.C. Smith
Back surgery: too many, too costly, and too ineffective
To Your Health, 5 (6) (2011)J. Greene
Health insurers look for ways to cut costs for back surgery
Modern Healthcare (August 27, 2018)B. Keeney, D. Fulton-Kehoe, J. Turner, T. Wickizer, K. Chan, G. Franklin
Early predictors of lumbar surgery after occupational back injury:
results from a prospective study of workers in Washington State
Spine (Phila Pa 1976), 38 (11) (2013), pp. 953-964M. Daubs, D. Norvell, R. Mcguire, et al.
Fusion versus nonoperative care for chronic low back pain
Spine (Phila Pa 1976), 36 (21 suppl) (2011), pp. S96-S109S. Mirza, R. Deyo, P. Heagerty, J. Turner, B. Martin, B. Comstock
One-year outcomes of surgical versus non-surgical treatments for discogenic back pain:
a community-based prospective cohort study
Spine J, 13 (11) (2013), pp. 1421-1433N. Jain, F.M. Phillips, T. Weaver, S.N. Khan
Preoperative chronic opioid therapy: a risk factor for complications, readmission, continued opioid use
and increased costs after one- and two-level posterior lumbar fusion
Spine (Phila Pa 1976), 43 (19) (2018), pp. 1331-1338Deyo RA, Mirza SK, Turner JA, Martin BI.
Overtreating Chronic Back Pain: Time to Back Off?
J Am Board Fam Med. 2009 (Jan); 22 (1): 62–68B. Martin, S. Mirza, N. Spina, L. Brandon, D. Brodke, S. Darrel
Trends in lumbar fusion procedure rates and associated hospital costs for degenerative spinal diseases
in the United States, 2004 to 2015
Spine (Phila Pa 1976), 44 (5) (2019), pp. 369-376Cost helper health
How much does back surgery cost?
Health.costhelper.com/back-surgery, Accessed 16th Jan 2019Spine-Health.com
Cost of lumbar fusion surgery
(2019)Deyo RA, Mirza SK, Martin BI, Kreuter W, Goodman DC, Jarvik JG.
Trends, Major Medical Complications, and Charges Associated
with Surgery for Lumbar Spinal Stenosis in Older Adults
JAMA 2010 (Apr 7); 303 (13): 1259–1265A.N. Tosteson, J.D. Lurie, T.D. Tosteson, et al.
Surgical treatment of spinal stenosis with and without degenerative spondylolisthesis: cost-effectiveness after 2 years
Ann Intern Med, 149 (12) (2008), pp. 845-853L. Proietti, L. Scaramuzzo, G. Schiro, S. Sessa, C. Logroscino
Complications in lumbar surgery: a retrospective analysis
Indian J Orthop, 47 (4) (2013), pp. 340-345McMorland G, Suter E, Casha S, du Plessis SJ, Hurlbert RJ.
Manipulation or Microdiskectomy for Sciatica? A Prospective Randomized Clinical Study
J Manipulative Physiol Ther. 2010 (Oct); 33 (8): 576–584Centers for Disease Control and Prevention/NCHS
National Vital Statistics System, Mortality, CDC WONDER
US Department of Health & Human Services, Atlanta, GA (2018)
http://wonder.cdc.govC.S. Florence, C. Zhou, F. Luo, L. Xu
The economic burden of prescription opioid overdose, abuse, and dependence in the United States, 2013
Med Care, 54 (10) (2016), pp. 901-906National Institute of Drug Abuse
Missouri opioid summary: opioid-involved overdose deaths
https://www.drugabuse.gov/opioid-summaries-by-state/missouri-opioid-summary, Accessed 20th Jan 2019Missouri Hospital Association
Mortality rate from opioid abuse exceeds national average in Missouri. March 27, 2019
https://web.mhanet.com/article/7194/Missouri-Opioid-Use-Disorder-Costs-Exceed-14-Billion.aspx?
articlegroup=2662, Accessed 1st Feb 2019G.C. Alexander, T. Lyapustina
The prescription opioid addiction and abuse epidemic: how it happened and what we can do about it
Pharm J, 294 (7866) (2015)H. Dorr, C. Townley
Chronic pain management therapies in Medicaid: policy considerations for non-pharmacological alternatives to opioids
National Academy for State Health Policy (August 2016)J. Whedon
Association between utilization of chiropractic services and use of prescription opioids among patients with low back pain.
Paper presented at: National Press Club. March 14, 2017; Washington, DC
http://c.ymcdn.com/sites/www.cocsa.org/resource/resmgr/docs/NH_Opioids_Whedon.pdf, Accessed 15th Mar 2019Kaiser Family Foundation
Medicaid benefits: chiropractic services
http://kff.org/medicaid/state-indicator/chiropractor-services/, Accessed 24th Aug 2016Hughes A, Williams M, Lipari R, Bose J, Copello E, Kroutil L.
Prescription drug use and misuse in the United States: results from the 2015 national survey on drug use
and health. National Survey on Drug Use and Health Data Review.
Substance Abuse and Mental Health Services Administration. September 2016.K. McLaughlin
Oregon health plan opens door to back-pain treatment: new policy takes effect January 1
The Bulletin (July 30, 2015)C. Ross
As the opioid crisis grows, states are opening Medicaid to alternative medicine
STAT (January 17, 2018)G.W. Clum, W. Meeker, L. Carabello, S. McAllister, A. Lignos
Chiropractic: A Key to America’s Opioid Exit Strategy
Foundation for Chiropractic Progress (2017)
See also the: F4CP Opioids Toolkit 2.0J. Taylor
Missouri legislature passes measure to let Medicaid cover chiropractic care
MissouriNet (June 5, 2018)Fiscal Note 4120-02 Revised HB 1516, P. 09.
Estimate of Missouri population
http://worldpopulationreview.com/states/missouri-population/Estimate of US population
http://worldpopulationreview.com/countries/united-states-population/Missouri Census Data Center
Population estimates by age
https://census.missouri.edu/population-by-age/report.php?s=29&y=2018&d=&a=5b
Return to MEDICARE
Return to COST-EFFECTIVENESS
Since 12-28-2019


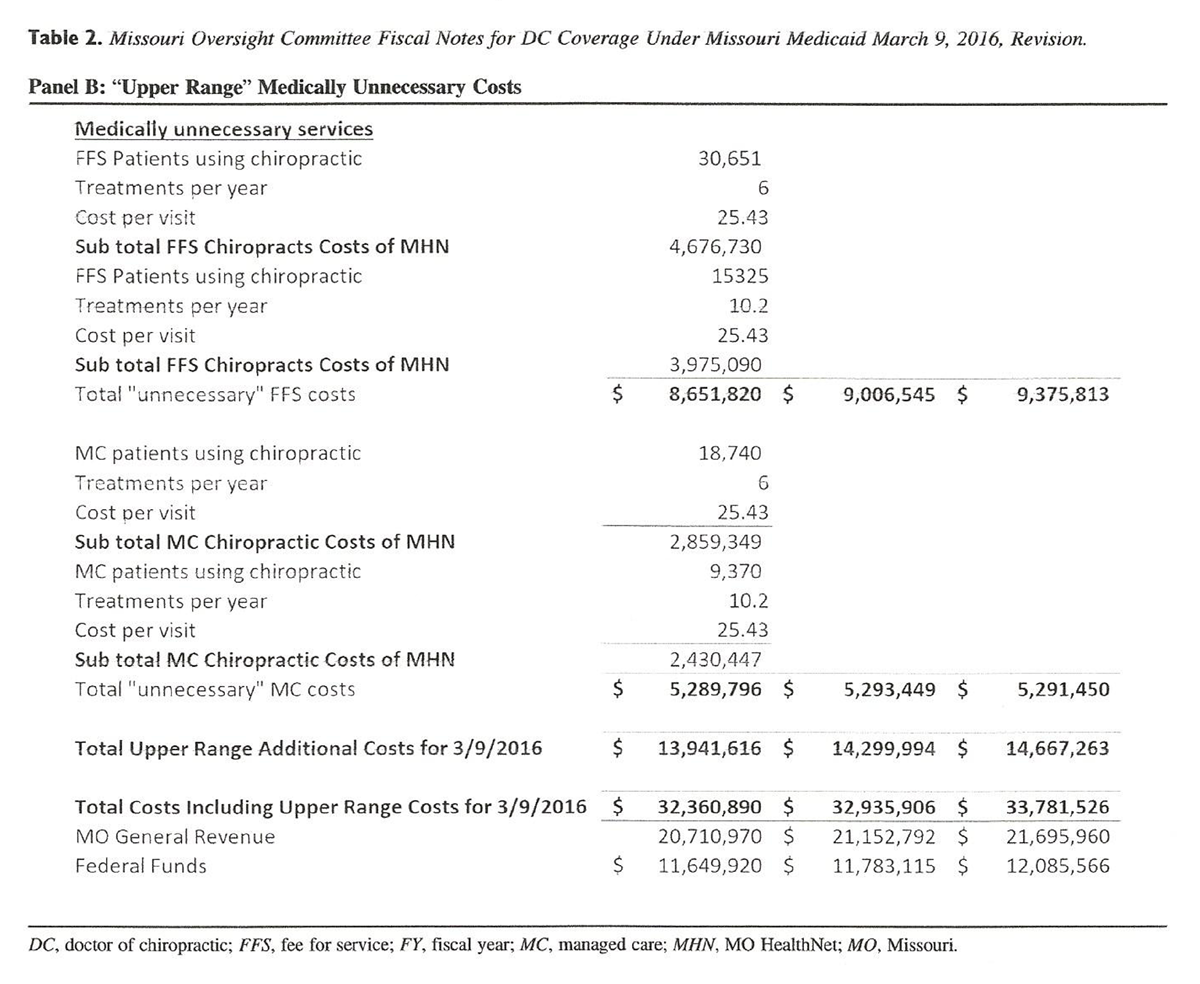
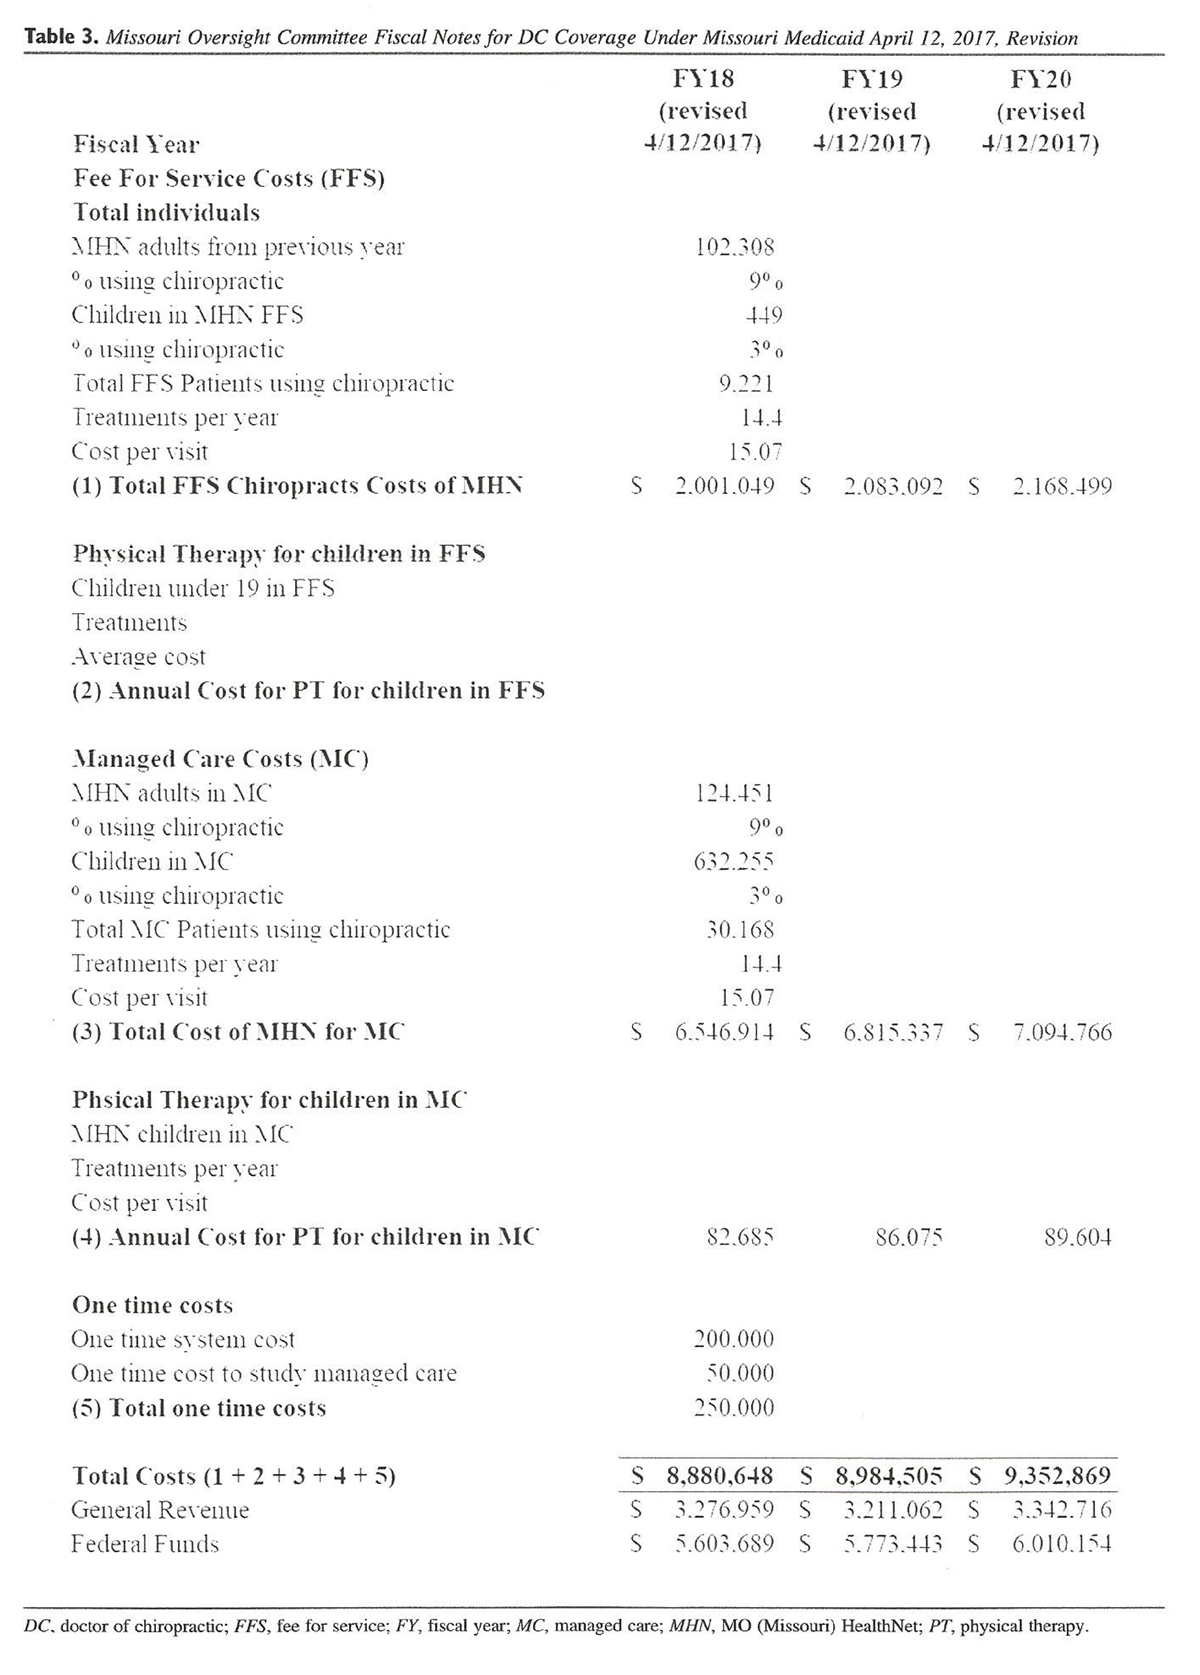
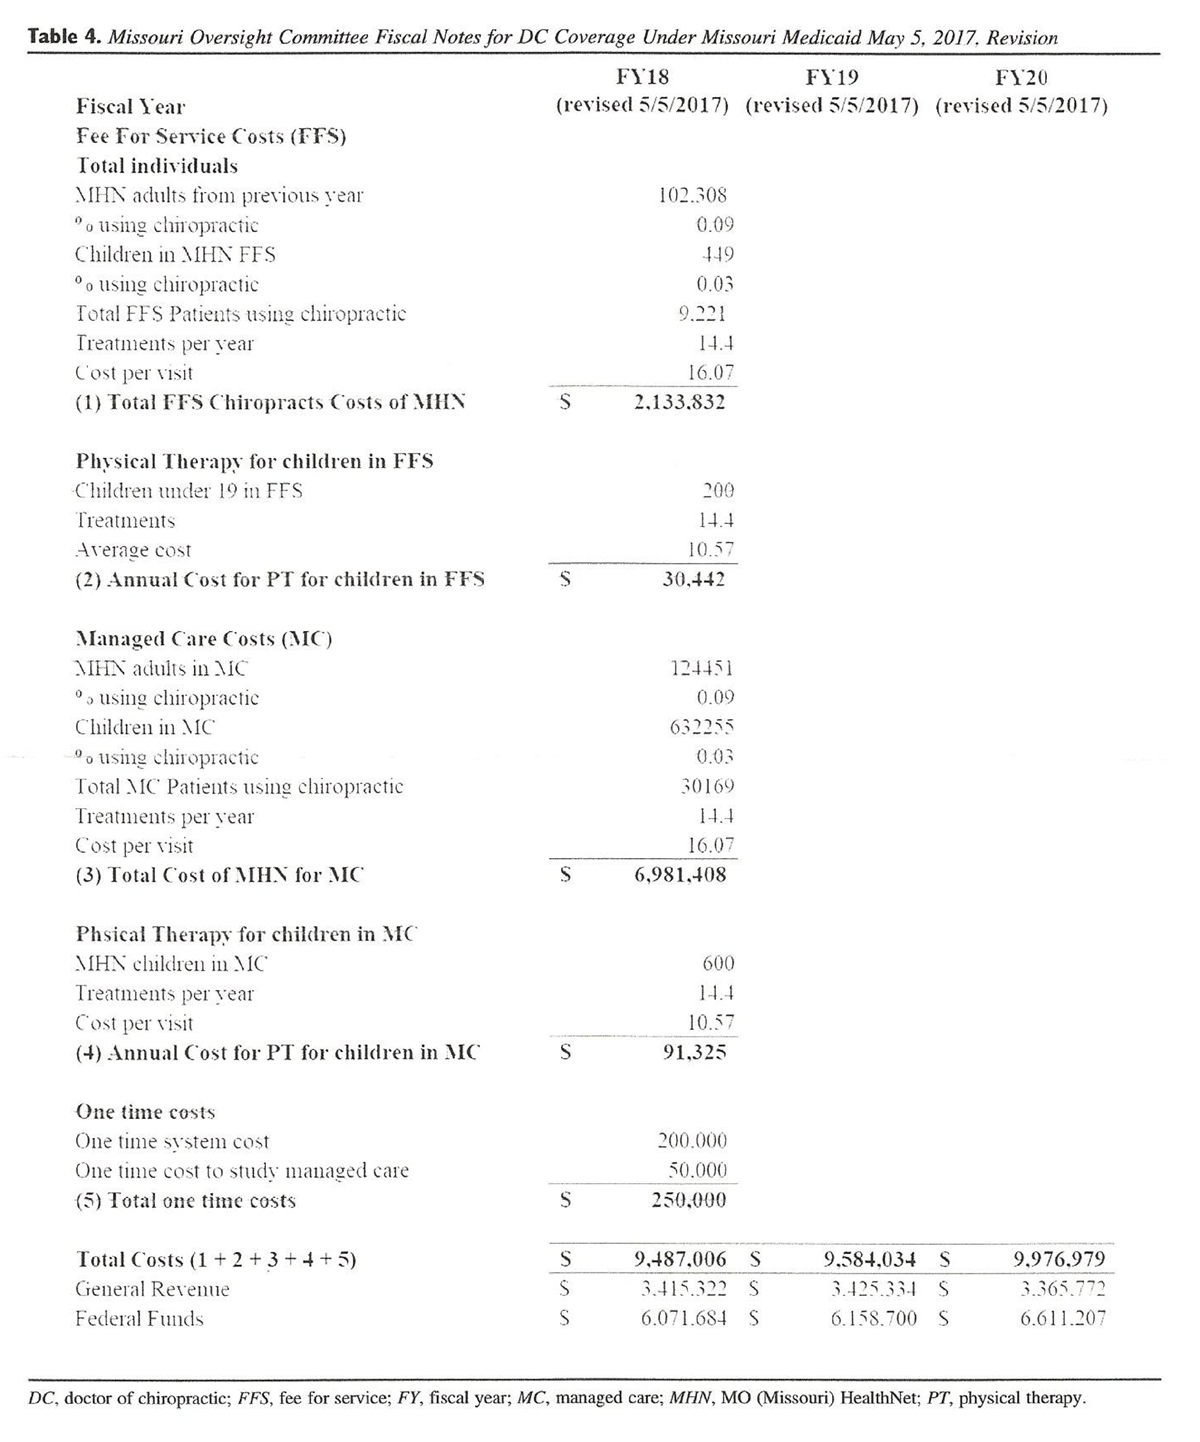
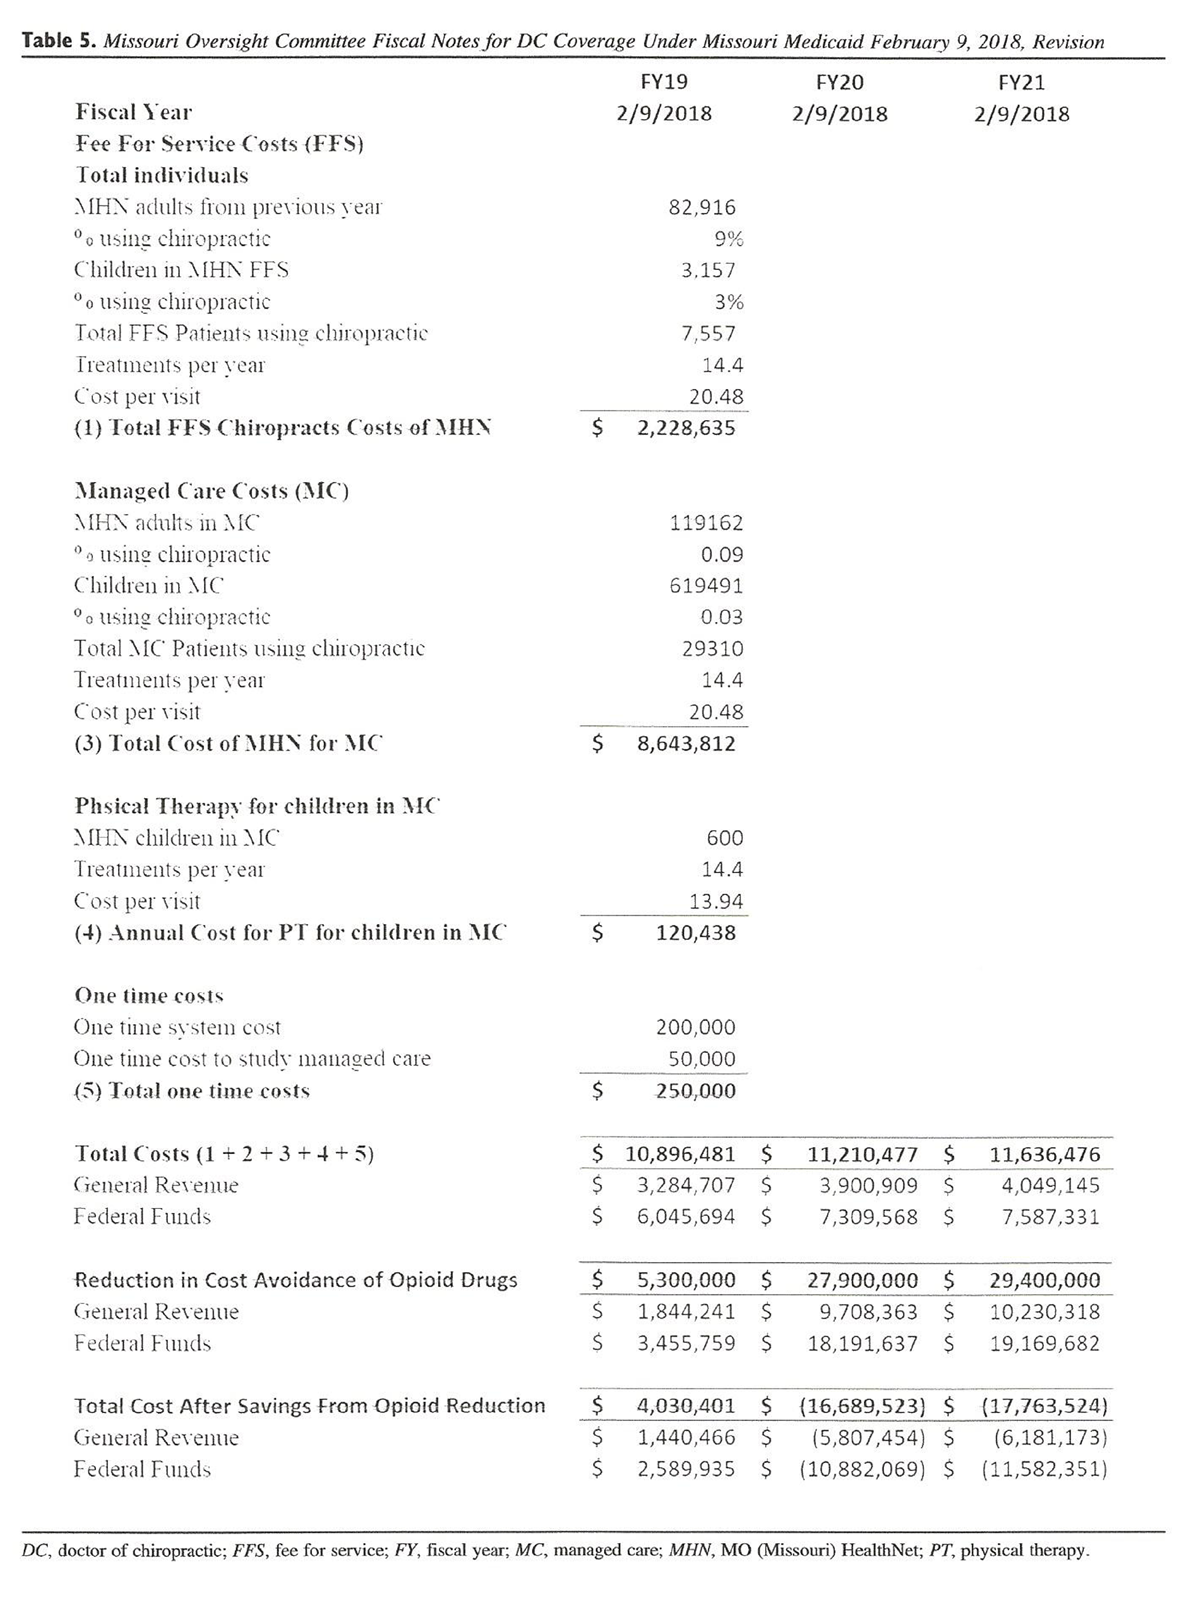

| Home Page | Visit Our Sponsors | Become a Sponsor |
Please read our DISCLAIMER |