

Variations in Patterns of Utilization and Charges
for the Care of Neck Pain in North Carolina,
2000 to 2009: A Statewide Claims' Data AnalysisThis section was compiled by Frank M. Painter, D.C.
Send all comments or additions to: Frankp@chiro.org


FROM: J Manipulative Physiol Ther. 2016 (May); 39 (4): 240–251 ~ FULL TEXT
OPEN ACCESS Eric L. Hurwitz, DC, PhD, Dongmei Li, PhD, Jenni Guillen, MS,
Michael J. Schneider, DC, PhD, Joel M. Stevans, DC, Reed B. Phillips, DC, PhD,
Shawn P. Phelan, DC, Eugene A. Lewis, DC, MPH, Richard C. Armstrong, MS, DC,
Maria Vassilaki, MD, MPH, PhD
Office of Public Health Studies,
University of Hawaii at Manoa,
Honolulu, HI.
ehurwitz@hawaii.edu
Thanks to JMPT for permission to reproduce this Open Access article!
FROM: Weeks ~ JMPT 2016 (Feb) Hurwitz ~ JMPT 2016 (May)OBJECTIVES: The purpose of the study was to compare utilization and charges generated by medical doctors (MD), doctors of chiropractic (DC) and physical therapists (PT) by provider patterns of care for the treatment of neck pain in North Carolina.
METHODS: This was an analysis of neck-pain-related closed claim data from the North Carolina State Health Plan for Teachers and State Employees (NCSHP) from 2000 to 2009. Data were extracted from Blue Cross Blue Shield of North Carolina for the NCSHP using ICD-9 diagnostic codes for uncomplicated neck pain (UNP) and complicated neck pain (CNP).
RESULTS: Care patterns with single-provider types and no referrals incurred the least average charges for both UNP and CNP. When care did not include referral providers or services, for either UNP or CNP, MD care with PT was generally less expensive than MD care with DC care. However, when care involved referral providers or services, MD and PT care was on average more expensive than MD and DC care for either UNP or CNP. Risk-adjusted charges for patients in the middle quintile of risk (available 2006-2009) were lower for chiropractic patients with or without medical care or referral care to other providers.
There are more articles like this @ our:
Cost-Effectiveness of Chiropractic PageCONCLUSIONS: Chiropractic care alone or DC with MD care incurred appreciably fewer charges for UNP or CNP compared to MD care with or without PT care, when care included referral providers or services. This finding was reversed when care did not include referral providers or services. Risk-adjusted charges for UNP and CNP patients were lower for DC care patterns.
KEYWORDS: Chiropractic; Health Services; Healthcare Costs; Medical Care; Neck Pain; Utilization
This is one of 3 of the Cost-Effectiveness Triumvirate articles.
Introduction
Neck pain appears to be increasing in the general population and in specific occupations. [1] Neck pain is a common condition, with nearly half of the individuals experiencing at least 1 clinically significant neck pain episode in their lifetime [2, 3], resulting in substantial disability and financial burden [4] for individuals, families, society, and the healthcare system. [1] US national survey data in 20025 had shown that 13.8% of adults reported neck pain (lasting at least a whole day or more) in the previous 3 months. Neck pain was among the 5 highest contributors for Years Lived in Disability (YLD) both in 1990 and 2010 in the United States. [5]
In 2006, Fejer et al [3] conducted a systematic review of the literature from several countries. The authors collected data from multiple studies and reported lifetime prevalence in adults (aged 18-84) ranging from 14 to 71%, with a mean prevalence of 49% and relatively higher prevalence in the elderly and women. Among 291 other health conditions, neck pain ranked 4th in terms of disability (YLD) and 21st in overall burden of disease in Disability Adjusted Life Years [DALYs] according to the 2010 Global Burden of Disease report. [7]
As the prevalence increases, many people wonder what effect neck pain will have on the healthcare system. Some consider neck pain to be an acute problem that will resolve within days or weeks in about 90% of cases. [8] Others have reported that most self-reported cases of neck pain are continuous or episodic, with 84% of participants reporting mild or severe, continuous or recurrent pain. [9] Although numerous conservative and surgical care strategies exist for patients with neck pain, many are not evidence-based and few show clear evidence of effectiveness. [10, 11] Martin et al compared the medical costs of 22,258 participants with and without self-reported spine (including both back and neck) problems from 1997 to 2005, adjusting for age and sex. [12] Patients with spine problems exhibited a 65% higher increase in medical expenditures, with per person costs rising from $4,695 in 1997 to $6,096 in 2005.
The largest proportion of increasing medical expenditures per person,
for spine-related problems, were associated with:inpatient hospitalizations (37%),
outpatient costs (18%),
prescription drugs (139%), and
emergency room visits (84%). [13]Costs for neck pain are rising, with an increasing prevalence and incidence of neck pain coupled with an uncertainty about the effectiveness of various treatment options. For these reasons, investigating the utilization and expenditures of care patterns for neck pain plays an important role in healthcare policy.
Patients with neck pain are most often seen by medical doctors (MD), doctors of chiropractic (DC), physical therapists (PT) and medical specialists to which they are referred. In North Carolina, PTs must treat under the direction of either an MD or DC, therefore either an MD or a DC act as the portal of entry provider for neck pain patients. [14] Currently, the portal of entry provider combinations (patterns) involved in care (utilization), and the role of specialist referrals as cost drivers is unclear in the literature.
The question of clinical efficacy arises as the health insurance industry increases its interest in containing costs by encouraging patients with musculoskeletal conditions to pursue care through the primary care “medical home” portal. Does reducing patient self-selection of providers reduce the cost of care for these conditions, or does it increase cost? The aim of this study was to assess the utilization and costs of care patterns for patients with complicated (C) and uncomplicated (U) neck pain (NP) in the North Carolina State Health Plan (NCSHP) for Teachers and State Employees from 2000 to 2009. We compared utilization and cost of care patterns in patients who utilized: MDs and DCs alone; in combination with each other (MD-DC); in combination with physical therapy (MD-PT; DC-PT); and/or with additional referred provider care.
Methods
This study was a retrospective closed-claim analysis of the NCSHP that included claims generated annually by approximately 660,000 covered beneficiaries (state employees, dependents, and retirees) between the years 2000-2009. Data were extracted from Blue Cross Blue Shield of North Carolina using an extraction model developed with clinical healthcare analysts from the NCSHP.
Cohort Identification and Stratification
The neck pain analytic cohort was constructed for the analysis by identifying all professional and facility claims for a healthcare event with a primary neck pain diagnosis, using the International Classification of Diseases, 9th Revision (ICD-9) diagnosis codes. The ICD-9 codes used to select the cohort were identified as the most common codes used across all 3 professions (MD, DC, and PT) and were not meant to represent all possible neck pain codes. It was not the intent of this study to include every possible ICD-9 code used by each of the 3 provider types or their specialist referral destinations. It was instead to include the most common codes used by all of the provider types. The codes used by DCs, “Subluxation” ICD-9 codes were excluded for a number of reasons. Medical and PT offices when billing third party payers rarely use subluxation codes. These codes are only required when billing traditional Medicare. In that circumstance, Medicare would be the primary payer and NCSHP would be the secondary payer. All claims in which NCSHP was the secondary payer were excluded from our analysis, therefore we did not analyze any Medicare claims data.
Secondary, tertiary, and quaternary codes were not used to identify neck pain patients because substantial utilization unrelated to the treatment of neck pain came up when they were used in the initial extraction. This would have led to overestimation of neck pain charges in our cohort. Therefore, we chose to use the primary diagnosis to identify cases and subsequent claims. According to ICD-9 coding guidelines, the primary diagnosis listed on a claim form should reflect the principal reason for the patient’s visit on that date of service. By only using the primary diagnosis to identify claims of interest, our analysis provides estimates that were more conservative by eliminating the scatter of cases where neck pain was only a secondary or tertiary complaint.
The neck pain cohort was stratified into 2 broad categories of neck pain:(1) uncomplicated neck pain (UNP), and
(2) complicated neck pain (CNP).

Table 1 Table 1 shows the primary diagnoses (ICD-9 codes) used to distinguish between UNP and CNP. These subgroups were analyzed separately because it was our a priori assumption that patients with diagnoses included in the UNP category were less likely to have radicular complaints than those in the CNP category and would require fewer healthcare services. Although the reliability of using ICD-9 codes to distinguish between these categories could be argued, all provider patterns were evaluated relative to them under the same assignment.
“Claim” Defined
Each claim represents a unique clinical service as defined by an individual allowed Current Procedural Terminology (CPT) code. Medicare and non-North Carolina residents were excluded. Each reporting (fiscal) year represents a benefit year starting in July and ending in June.
Provider Categorization
The provider types were categorized into 4 groups:(1) Doctor of Chiropractic (DC);
(2) Medical/Osteopathic Doctor (MD);
(3) Physical Therapist (PT); and
(4) Referral providers.The MD group also included additional provider types: General Practice, Internal Medicine, Neurology, Neurosurgery, Obstetrics-Gynecology, Orthopedic Surgery, Osteopathy, Pediatrics, Physical Medicine, General Surgery, Family Practice, or Geriatric Medicine; Nurse Practitioner; Podiatry; Public Health; University/College Infirmary; Urgent Care; and VA/Military Hospital-Professional Staff. Referral providers were hospitals, surgical centers, emergency medicine, and other specialty referral services and providers.
Of note is the inclusion of Podiatry in the MD group. This analysis is 1 in a series of 3 using the NCSHP database to evaluate the patterns of care and costs for common conditions (ie, low back pain, neck pain, and headache). Podiatrists were included in the MD category because they may use a primary diagnosis of a lumbar radiculopathy when seeing a patient for foot pain or numbness and therefore serve as a possible portal of entry for low back patients. Podiatrists would be far less likely to treat neck pain or headache patients. However, they were included in all 3 analyses in order to maintain consistent methodology across the 3 studies.
In North Carolina, patients must be referred from a MD or a DC to receive PT care. This places the primary management decisions with the referring MD or DC, with PTs providing treatment under the direction of these MD and DC providers. Therefore, the PT category does not stand alone in this analysis.
Provider Utilization Patterns
Although efforts are underway to create a “medical home” where patients are encouraged to see primary care doctors first, before self-referring to “specialists,” not all patients choose this path. Many enter the system through various specialist and non-specialist portals. This model reflects the way in which the system currently functions and the primary care “medical home” was not selected as a pattern.
Tracking of healthcare use and costs becomes very complicated once one begins to follow longitudinally patient treatment through different provider patterns utilizing a multiple set of tests and interventions (eg, advanced imaging, x-ray, medication, surgery) delivered within heterogeneous settings (eg, office, in- and out-patient facilities). Consequently, patients were classified into care patterns based on their use of each of these provider types: MD only, DC only, MD-DC, MD-PT, MD-referral, DC-referral, MD-DC-referral, and MD-PT-referral.
Care Endpoint
Once ICD-9 codes were selected and the patterns of care identified, the endpoint for care was identified. Ideally, this would have been done within the parameters of an “episode.” However, we chose not to do an “episodes of care” analysis because it would have required arbitrary definitions of: (a) episode length, (b) time lapse between visits, and (c) time to recurrence (eg, reoccur in 1 week, 1 month or 1 year) that have not been validated in the literature. For this reason, we tracked the cost of care for UNP and CNP using the primary ICD-9 code through care according to the provider patterns described above, using a fiscal year as the endpoint for all diagnostic codes. Each fiscal year was analyzed separately, so that the date range for any diagnosis within each analysis could be no longer than 1 year. For a diagnosis that spanned more than 1 fiscal year, or that incurred charges over several months in different years, the diagnosis was included in both but would be reported in separate analyses reflecting those years.
Tracking of Costs
If a patient presented with the primary diagnosis of “intervertebral disc disorder with myelopathy, cervical region” (722.71) in a primary care doctor’s office, the aggregate cost of the care under that code would accumulate under the MD-only pattern of care. This would include all diagnostic and treatment services prescribed as long as the patient did not receive DC, PT, or referral care services. If that same patient also received care in a DC’s office, or PT, the aggregate costs would accumulate costs under the MD-DC or MD-PT pattern of care, respectively. It is possible that the patient’s diagnosis changed over time. If the diagnosis changed, and the new diagnosis fell within the same clinical category (UNP or CNP), the patient would remain in the initially assigned UNP or CNP group. However, if the new diagnosis was from the other category (eg, former diagnosis was UNP and the new diagnosis is CNP), then the patient would move into the CNP group and the aggregate costs would accrue to this category. This is how a primary ICD-9 code would be used to track utilization and costs across provider patterns.
Cost Reference Points
Reference points of average (mean and median) numbers of claims, charges per claim and total allowed charges per patient were used to analyze costs. The total allowed charges were calculated by summing the payments made by both the patient and insurer for a medical service. This dollar amount represents the total amount paid to the provider. Costs were not adjusted for inflation. It was not the purpose of this study to estimate absolute differences in costs over time from 2000-2009, but instead to compare within-year relative differences in costs between patterns of care.
For each fiscal year, pharmaceutical claim data were linked with medical claim data based on each patient’s unique identity. The major claim types were professional office visit (eg, MD, DC), advanced imaging (magnetic resonance imaging, computerized tomography or similar services), radiology (diagnostic x-ray, arthrography, or similar services), physical therapy (provider specialty is physical therapy or a physical therapy facility with service types belonging to physical therapy), and surgical (services provided by neurosurgeon or orthopedic or general surgeon).
The University of Hawaii Human Studies Program approved this study as exempt from federal regulations pertaining to the protection of human research participants, as documented in the Code of Federal Regulations at 45CFR 46.101(b)(Exempt Category 4).
Statistics
We generated frequency distributions of claims and patients for each pattern of care, by year. The numbers of claims in each provider group for each care pattern were identified by cross tabulation of care pattern and provider type. Within each of the 5 claim types, care pattern and provider type were cross-tabulated to identify the number of claims in each provider group for each care pattern. The total allowed and per claim, medical, pharmaceutical, and combined expenses, were then summarized for each patient. The patient-based and claim-based mean and median of medical, pharmaceutical, and combined medical and pharmaceutical expenses were also generated for each care pattern.
Scores reflecting risk of expected healthcare cost and utilization relative to that of the overall population were available in years 2006 to 2009. Risk scores take into account patient-specific factors that may affect utilization and charges, including age, sex, primary diagnosis, comorbidities and use of prescription drugs. Risk scores help define the difficulty in the treatment level for a particular patient.
Within each type of pain (UNP, CNP) for patients in the middle quintile of risk, linear regression models were used to fit log10-transformed total allowed charges per patient to examine pairwise differences across the 8 most relevant patterns of care, adjusting for risk score as a continuous variable in the models. Patterns that contained very little utilization were excluded. The log10-based transformation was used because the transformed costs are closer to normal distributions than natural log-transformed cost data. Examining patients in the middle quintile (40-60th percentiles) removes those at lowest and highest risk and offers apples-to-apples between-pattern comparisons of the “average” or more typical patient. Linear orthogonal contrasts (ratios) were used to compare differences in charges between DC- and MD-related care patterns. Residual diagnostics were conducted and the normality assumptions of residuals were satisfied. The homoscedasticity assumption was also satisfied for the log transformed cost data. P values, standard errors, and 95% confidence intervals were computed. SAS 9.2 (SAS Institute, Cary, NC)15 was used for data management and statistical analyses.
Results
UtilizationUncomplicated Neck Pain (UNP) For UNP, 2,795,046 claims and for CNP, 529,318 claims met the inclusion criteria. For UNP, 11,383 patients in 2000 to 20,492 patients in 2009 (up 80%) met the inclusion criteria; for CNP, 2,431 patients in 2000 to 5,345 patients in 2009 (up 120%) met the inclusion criteria. The overall number of UNP patients in all care patterns increased over the 10-year period; however, gains were greatest among care patterns involving MDs, PTs, and referrals, and lowest among patterns with DCs. The numbers of patients in care patterns with MDs increased from 4,125 in 2000 to 11,772 in 2009 (up 185%), whereas the numbers of patients in care patterns with DCs decreased from 5,331 in 2000 to 4,472 in 2009 (down 16%).
Complicated Neck Pain (CNP) The number of patients with at least 1 claim for CNP increased from 2,431 in 2000 to 5,345 in 2009 (up 120%). Numbers of CNP patients in all care patterns increased over the 10-year period; however, gains were greatest among care patterns involving MDs, PTs, and referrals, and smallest among DC-care patterns. The numbers of patients in care patterns with MDs increased from 1,309 in 2000 to 3,382 in 2009 (up 158%), whereas the numbers of patients in care patterns with DCs increased from 892 in 2000 to 1,360 in 2009 (up 52%).
Overall Charges
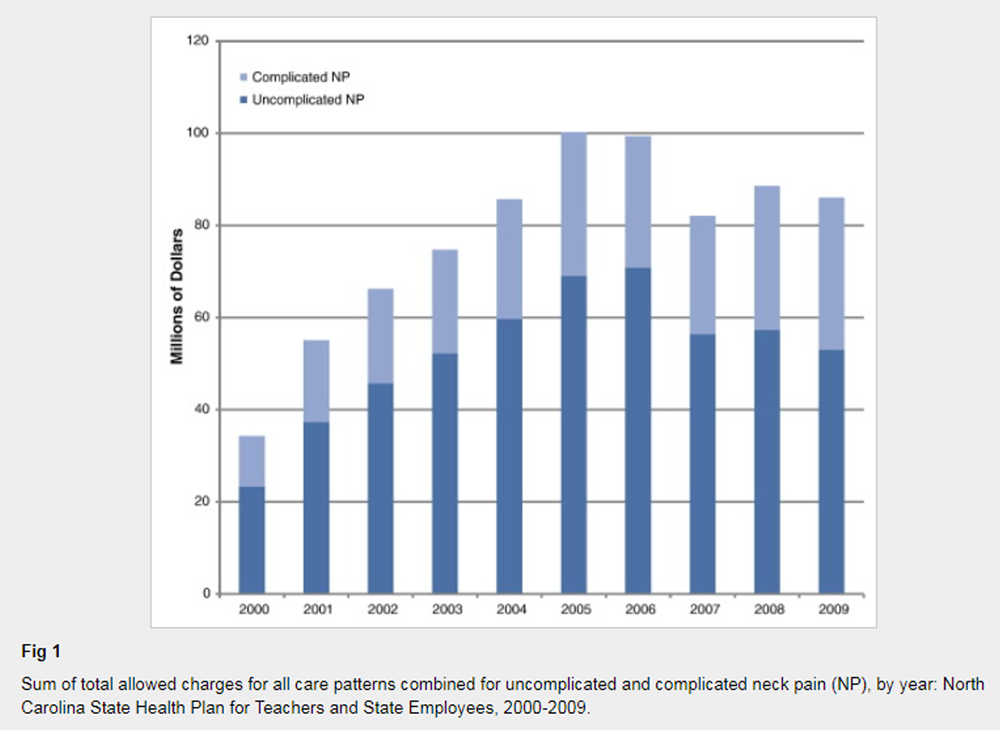
Figure 1
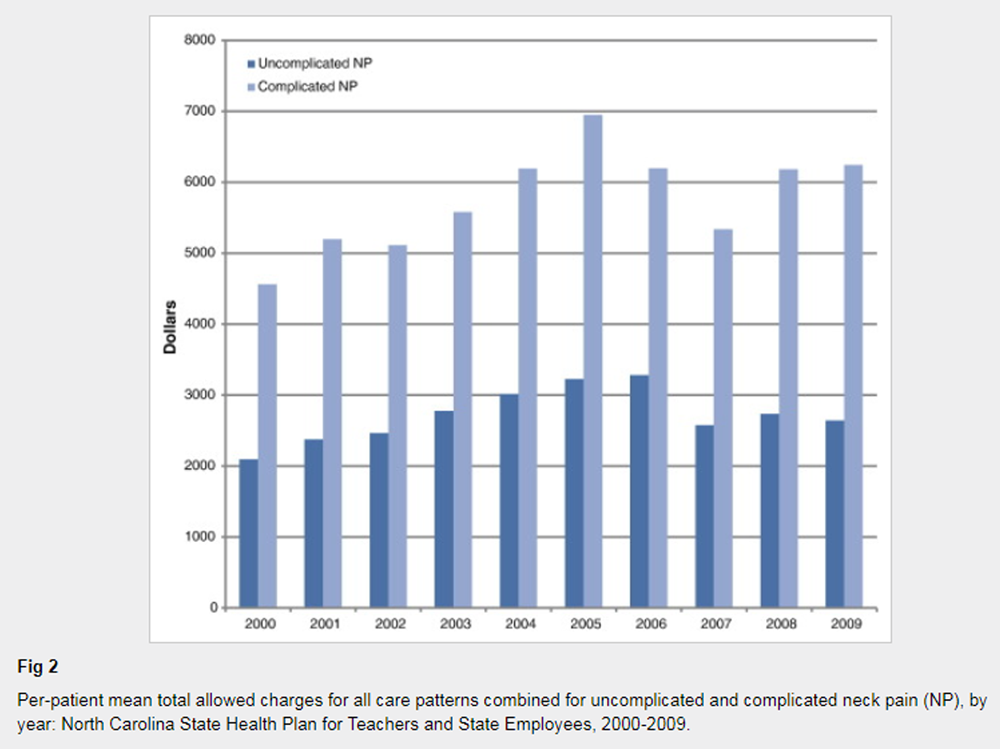
Figure 2 Uncomplicated Neck Pain Total allowed charges (ie, the sum of patient and payer financial responsibility) for UNP more than doubled from $23,323,308 in 2000 to $53,039,049 in 2009 (up 127%) (Fig 1). Average total charges per patient for all care patterns combined increased from $2,094 in 2000 to $3,280 in 2006 (57% increase) before declining in the latter years of that decade. Over the decade, average total allowed charges for UNP increased by 26% (Fig 2).
Complicated Neck Pain Total allowed charges for CNP more than tripled from $10,966,365 in 2000 to $33,040,953 in 2009 (up 201%) (Fig 1). Average total charges per patient for all care patterns combined increased from $4,562 in 2000 to $6,948 in 2005 (52% increase) before declining to $5337 in 2007 and rising again in 2008 (to $6,184) and 2009 (to $6,242). Over the decade, average total allowed charges for CNP increased by 37% (Fig 2).
Pattern-Specific Charges
This section is to report the cost analysis of patterns of provider care or paths through which patients may have been provided care through the system. We also report the average (mean and median) numbers of claims, charges per claim and overall allowed charges per patient for these patterns. This section concludes with a presentation of risk- adjusted averages.Uncomplicated Neck Pain For all years, care patterns involving multiple types of providers resulted in appreciably greater average charges per patient, compared with care patterns involving single providers. In general, care patterns with MDs and referral providers resulted in greater average charges per patient than other care patterns. MD-PT care was much more expensive than MD-DC care, when that care also involved referral providers. There were not enough cases with DC-PT care to allow for an adequate analysis.
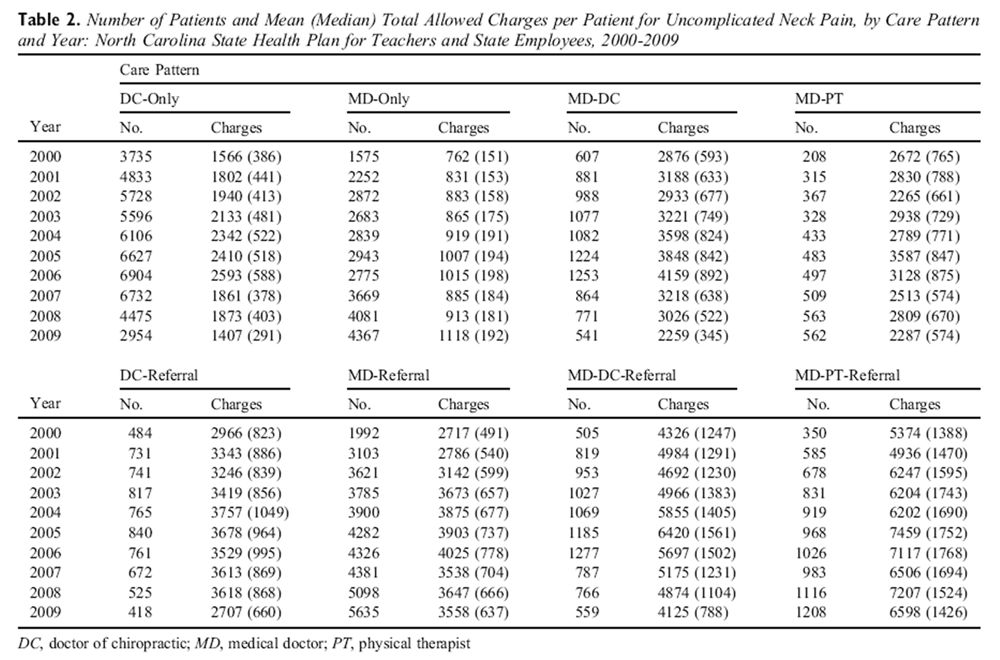
Table 2 Before the application of risk-adjusted averages, MD-only care was consistently the least expensive pattern of care for UNP (mean [median] total allowed charges in 2009 of $1,118 [$192]). Without referral providers or services, MD-PT care was on average just $28 more expensive than MD-DC care in 2009. However, with referral providers, MD-PT care was on average $1,048 (in 2000) to $2,473 (in 2009) more expensive than MD-DC care for UNP (Table 2).
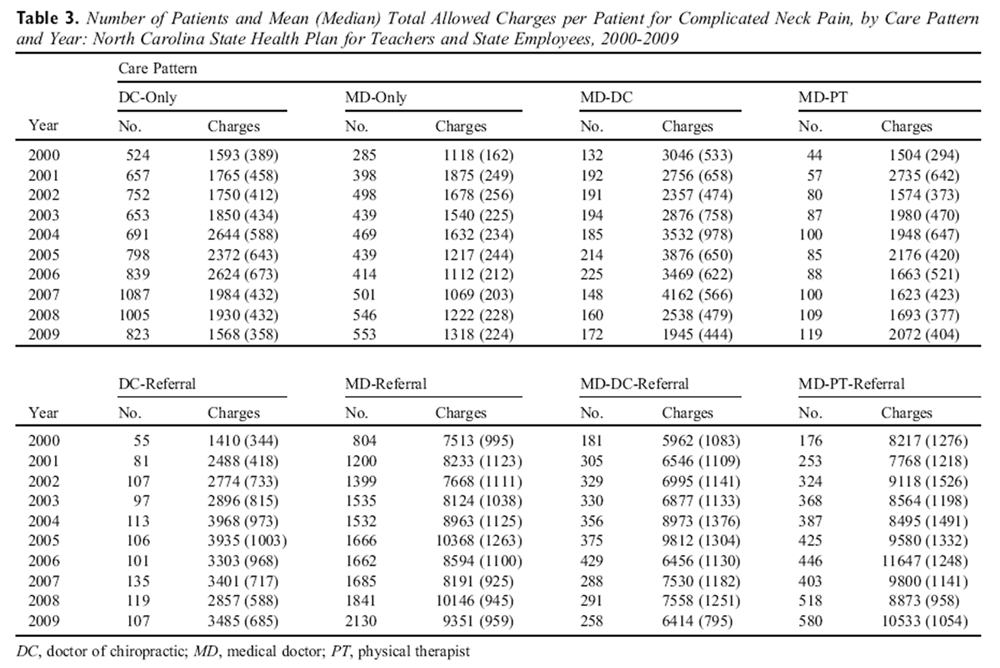
Complicated Neck Pain As with UNP, care patterns involving multiple types of providers resulted in greater average charges compared with care patterns involving single providers. Patterns with MDs and referral providers resulted in generally greater average charges than care patterns with non-referral provider types. As with UNP, before the application of risk adjusted averages, MD-only care was consistently the least expensive pattern of care (mean [median] total allowed charges in 2009 of $1,318 [$224]).
Table 3 Throughout most of the decade, when care did not include referral providers or services, MD-PT care was on average less expensive than MD-DC care. However, when referral care was involved, the combination of MD-DC care is much less expensive than the combination of MD-PT care. With referral providers, MD-PT care was on average $2,255 (in 2000) to $4,119 (in 2009) more expensive than MD-DC care (Table 3).
Risk-Adjusted Charges, 2006 to 2009 Risk scores take into account patient-specific factors that may affect utilization and charges. These factors include: age, sex, primary diagnosis, comorbidities, and use of prescription drugs. Risk scores help to define the level of difficulty associated with the treatment of a particular patient.
Table 4
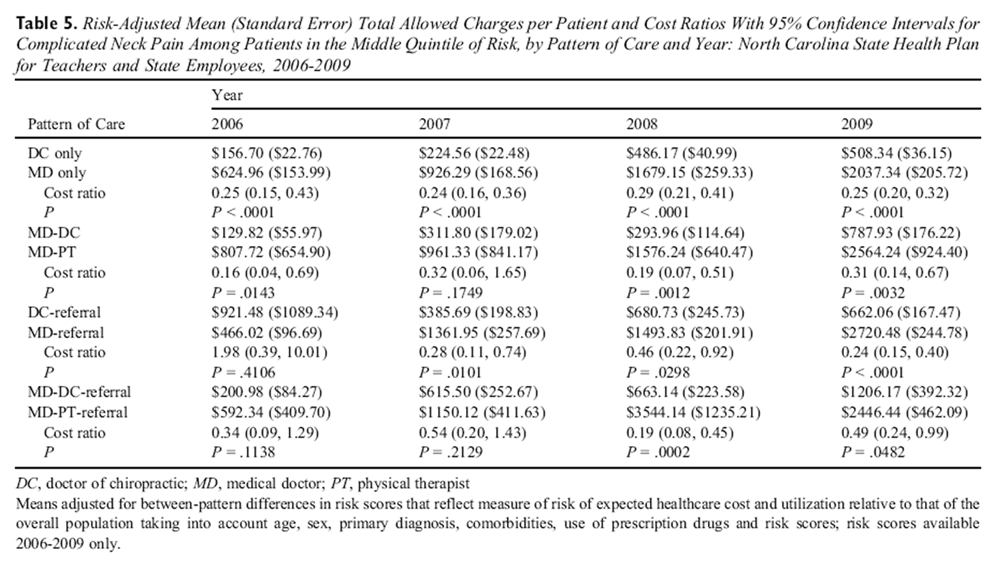
Table 5 For UNP, risk-adjusted mean charges were significantly greater in all years (2006-2009) for the following care patterns: MD-only vs. DC-only care; MD-PT vs. MD-DC care; MD-referral vs. DC-referral care; and MD-PT-referral care vs. MD-DC-referral care. Cost ratios range from 0.20 to 0.59 among UNP patients with risk scores between the 40th and 60th percentiles. Total allowed charges were on average 41% to 80% lower for DC patients (Table 4).
For CNP, risk-adjusted mean charges were significantly greater in all years (2006-2009) for the following care patterns: MD only vs. DC only care; MD-PT vs. MD-DC care; and MD-referral vs. DC-referral care. However, there were two exceptions where there were no significant between-group differences in risk-adjusted mean charges: MD-PT vs. MD-DC care in 2007 and MD-referral vs. DC-referral care in 2006. With the exception of MD-referral vs. DC-referral care in 2006, cost ratios ranged from 0.16 to 0.46 among CNP patients with risk scores between the 40th and 60th percentiles. Risk-adjusted mean charges were greater for MD-PT-referral care vs. MD-DC-referral care in all years, but not significantly greater in the years 2006 or 2007. Total allowed charges were on average 54-84% lower for DC patients (Table 5).
Discussion
Most individuals will experience an episode of neck pain (NP) at some point in their life and its prevalence is on the rise. [1] Neck pain can cause considerable and lasting functional limitations, with neck pain ranking 4th out of 291 diseases and injuries in terms of years lived with disability. [16] The financial consequences of neck pain are considerable, including rising direct healthcare costs putting pressure on the healthcare system, as well as the indirect costs associated with work absenteeism and disability. [1]
The present study findings are consistent with previous research showing large increases in overall utilization and expenditures throughout the 2000-2009 decade for the management of neck pain across all provider types. [12, 13, 17, 18] The overall number of claims and charges increased, with claims rising 16% for UNP and 121% for CNP; and total annual allowed charges increasing 127% for UNP and 201% for CNP. Average total allowed charges increased by 26% for UNP and 37% for CNP.
Increases in utilization and charges were the highest among patterns involving MDs, PTs and referral providers. These findings are consistent with previous studies showing that medical specialty, diagnostic imaging, and invasive procedures (eg, spine injections, surgery) [17, 19, 20, 21] are significant drivers of increasing spine care costs.
The analysis of unadjusted charges found that both UNP and CNP patients incurred the highest average total per patient charges when the pattern of care involved multiple provider types. Although this may not be a surprising finding, there are interesting differences between specific individual and combination patterns. On average over the decade, the combination of MD-DC care incurred greater total charges per patient than the combination of MD-PT, but only without the addition of referral care. However, the direction of this relationship was reversed when referral care was added as part of the combination care pattern. The combination of MD-DC-referral care incurred fewer total charges per patient than the combination of MD-PT-referral care.
When care was limited to a single provider pattern, the MD-only group demonstrated the lowest total charges per patient in the unadjusted analyses. While the unadjusted analyses are informative, the cost differences associated with various care patterns may be influenced by differences in the characteristics of patients consulted by each provider type. Furthermore, patient characteristics can strongly affect utilization and charges and controlling for these factors through risk-score adjustment can provide additional insight into the differences between care patterns.
Beginning in 2006, the NCSHP dataset contained a risk score measure that allowed us to control for relevant patient characteristics (ie, age, sex, primary diagnosis, comorbidities, and use of prescription drugs) that affect utilization and charges. Because of heterogeneity in the distributions of patient risk scores across MD and DC patterns of care, we conducted a subgroup analysis using patients in the middle quintile of risk to provide apples-to-apples, between-pattern comparisons of the “average” or more typical patient. For UNP, risk-adjusted mean charges were significantly lower for all patterns of DC care compared to patterns with MD and PT, with the total allowed charges 41-80% lower on average. The findings were strikingly similar in the CNP cohort, with a few exceptions noted in isolated years. (Table 4) Generally, the total allowed charges were on average 54-84% lower for DC patients.
These findings are consistent with previous studies that compared the total costs of manual therapy (including DC care), PT and MD care for the treatment of neck pain. [22, 23] For example, Korthals de-Bos et al. [22] found a significant difference in cost when comparing manual therapy and MD care; manual therapy costs were approximately one-third of the total costs of MD care. They also found manual therapy to be more effective than the two other care patterns (physiotherapy and general practitioner care) in terms of perceived recovery, pain intensity, functional disability, and utility. This study did not, however, distinguish between uncomplicated and complicated neck pain, and therefore reflects a generalization for both types of pain. Nevertheless, these studies provide supporting evidence that chiropractic care, which includes manual therapy, is an efficient mode of treatment and can be a valuable component in the management of neck pain populations.
As our healthcare system continues the march toward pricing-transparency and value-based purchasing, economic analyses can be important sources to inform policy decisions. Utilization patterns and their resultant costs reflect a number of things: patient preference, shifts in beneficiary populations; existing referral patterns; provider supply; and payer policies, to name a few. It is beyond the scope of this study to make definitive conclusions regarding causation. Nevertheless, this study shows that when multiple providers are involved in the care of both UNP and CNP, the costs associated with patterns including DC care are about the same as patterns including PT care.
When comparing patterns of care that are limited to a single provider type, MD-only care is less expensive than DC-only care in the unadjusted models. However, in the risk-adjusted subgroup analyses the total charges per patient were found to be significantly lower for all patterns that included DC care (i.e. single or multiple providers). Many patients prefer the drug-free, hands-on approach offered by DCs, [24] and our findings suggest that DC care for neck pain patients may be cost-saving. Therefore, given our cost-conscious healthcare environment it would appear reasonable to ensure that patients with neck pain have adequate access to DC services.
Access and use of DC services have been shown to be sensitive to patient cost-sharing. [25, 26] The RAND Health Insurance Experiment found that consumer access to DC care was reduced by half (odds ratio = 0.49) when patient cost-sharing was 25% or more of the visit cost. [25] Unfortunately current trends towards greater patient cost sharing may drive population costs higher, by restricting access to lower cost services such as DC care.
Prior to 2007, there was a legislative mandate that required equal copayments for both primary medical and chiropractic office visits. During the 2007 legislative session, North Carolina law makers repealed this mandate, paving the way for the NCSHP to raise DC copayments to the level of specialist physicians beginning October 1st of that year. This policy change effectively made DC copayments 20-100% higher than those for primary MD care.
In the years prior to this policy change, the combined charges for complicated and uncomplicated neck pain in 2000 were $34.3 million escalating to $99.4 million by 2006. There was a noticeable break in this trend the following year when total allowed charges dropped to $82.1 million. That flattening of the trend in 2007 may reflect changes in the NCSHP benefit plan options that were introduced in 2006. However, despite the introduction of new benefit options, in 2008 the total allowed charges again spiked upward to $88.6 million.
The resumption of the upward trend in total charges occurred immediately following the hike in DC copayments. It may be that the copayment change altered utilization patterns in the population resulting in patients using higher cost services (Fig 1). It was beyond the scope of this analysis to explore temporal association between the decision to raise DC copayments and higher utilization and charges but this will be the focus of our future work.
Limitations
There are methodologic challenges inherent in the analysis of health insurance databases. For this study, these challenges arise in the form of: inability to control for tiering; possible inaccuracy of diagnostic, management and treatment codes; and the lack of availability of risk factors for the entire decade of the analysis. All of these challenges can affect comparability and create the potential for provider under-representation. Although our study was limited to an analysis of patients from the NCSHP in North Carolina, the population demographics of North Carolina were approximately the same when compared to national demographics in terms of age, sex, occupation, income, and citizenship. [27] Total annual allowed charges might be conservative in some respect, as other studies have reported, [13] since they don’t account for healthcare consumed due to comorbidities, which might be common among patients with spine disorders (eg, neck pain is associated with comorbidities including headache, arthralgias, depression or back pain). [2] However, the aim of our study was to compare use and charges of neck pain care in patients with a primary neck pain diagnosis.
Additional limitations are the potential misclassification of patients by providers regarding category of neck pain (uncomplicated vs. complicated) and the classification of post-laminectomy syndrome (722.81) as uncomplicated neck pain in our analysis. In analyzing the potential impact of this classification, the specific dollar estimates would have changed if these patients had been categorized as having complicated neck pain. However, given the small number of patients in this group (1.33% of all patients) and the similar relative proportions of these cases in the MD and DC patterns, the relative differences in charges between groups would likely not have changed dramatically.
Study Strengths
A major strength of the study is the large amount of neck pain claims available (3,324,364 claims) for analyses in the different pathways of healthcare services, over the 2000-2009 decade in North Carolina. This study, and the series of papers it has generated on the treatment of low back pain, [28] neck pain and headache, [29] provides an opportunity to healthcare policy makers and legislators for a unique economic examination.
When accumulating provider costs are viewed vertically as if in “silos” (eg, DC-only costs, MD-only costs), increasing utilization of one particular provider or another can be seen as a net cost increase. However, when costs are viewed across the silos, as this study has done; an increase in utilization of one provider group or another can result in a net cost decrease. It is also an opportunity to view costs laterally versus confined vertical analyses.
Conclusion
This study confirms that overall utilization patterns and charges for the treatment of neck pain increased dramatically over the decade 2000-2009 in North Carolina. Without referral care, MD-PT care incurs fewer total charges on average than MD-DC care; however, with referral care, MD-DC care incurs fewer charges than MD-PT care. For both uncomplicated and complicated neck pain, average allowed charges adjusted for patient-specific risk scores affecting healthcare use and expenditures are lower for DC patients with or without MD care, or referral care from other providers or services.
Practical Applications
In North Carolina from 2000 to 2009, the use and expenditures
for care of neck pain increased substantially.MD and DC care alone (with no referrals) were the least expensive
patterns of neck pain care.Without referral care, MD-care with PT-care incurs fewer total charges
on average than MD with DC care; however, with referral care,
MD-care with DC-care incurs fewer charges.Risk-adjusted charges for patients in the middle quintile of risk
(available 2006-2009) were lower for chiropractic patients
with or without medical care or referral care to other providers.
References:
Hoy, DG, Protani, M, De, R, and Buchbinder, R.
The epidemiology of neck pain.
Best Pract Res Clin Rheumatol. 2010; 24: 783–792Cohen, SP.
Epidemiology, Diagnosis, and Treatment of Neck Pain.
Mayo Clin Proc. 2015; 90: 284–299Fejer, R, Kyvik, KO, and Hartvigsen, J.
The prevalence of neck pain in the world population:
a systematic critical review of the literature.
Eur Spine J. 2006; 15: 834–848Hogg-Johnson, S, van der Velde, G, Carroll, LJ et al.
The Burden and Determinants of Neck Pain in the General Population:
Results of the Bone and Joint Decade 2000–2010 Task Force
on Neck Pain and Its Associated Disorders
Spine (Phila Pa 1976). 2008 (Feb 15); 33 (4 Suppl): S39–51Deyo, RA, Mirza, SK, and Martin, BI.
Back pain prevalence and visit rates: estimates from U.S. national surveys, 2002.
Spine (Phila Pa 1976). 2006; 31: 2724–2727Murray CJ, Atkinson C, Bhalla K, et al;
The State of US Health, 1990-2010: Burden of Diseases, Injuries, and Risk Factors
JAMA 2013 (Aug 14); 310 (6): 591–608Murray CJ, Vos T, Lozano R, et al.
Disability-adjusted life years (DALYs) for 291 diseases and injuries in 21 regions, 1990-2010:
a systematic analysis for the Global Burden of Disease Study 2010
Lancet 2013 Dec 15;380(9859):2197–223.Binder, AI.
Cervical spondylosis and neck pain.
BMJ. 2007; 334: 527–531Picavet, HS and Schouten, JS.
Musculoskeletal pain in the Netherlands: prevalences, consequences and
risk groups, the DMC(3)-study.
Pain. 2003; 102: 167–178Hurwitz, EL, Carragee, EJ, van der Velde, G et al.
Treatment of Neck Pain: Noninvasive Interventions: Results of the Bone and Joint Decade
2000–2010 Task Force on Neck Pain and Its Associated Disorders
Spine (Phila Pa 1976). 2008 (Feb 15); 33 (4 Suppl): S123–152Carragee EJ, Hurwitz EL, Cheng I, Carroll LJ, Nordin M, Guzman J, et al.
Treatment of Neck Pain: Injections and Surgical Interventions:
Results of the Bone and Joint Decade 2000–2010 Task Force on
Neck Pain and Its Associated Disorders
Spine (Phila Pa 1976). 2008 (Feb 15); 33 (4 Suppl): S153–169Martin, BI, Deyo, RA, Mirza, SK et al.
Expenditures and Health Status Among Adults With Back and Neck Problems
JAMA 2008 (Feb 13); 299 (6): 656–664Martin, BI, Turner, JA, Mirza, SK, Lee, MJ, Comstock, BA, and Deyo, RA.
Trends in Health Care Expenditures, Utilization, and Health Status Among US Adults
With Spine Problems, 1997-2006
Spine (Phila Pa 1976). 2009 (Sep 1); 34 (19): 2077–2084Physical Therapy Act,
North Carolina General Statute 90-270.24. (available from:)
www.ncleg.net/gascripts/statutes/Statutes.aspSAS Institute.
SAS (release 9.2) statistical software Cary, NC. ; 2012Hoy D, March L, Woolf A, et al.
The Global Burden of Neck Pain: Estimates From the Global Burden of Disease 2010 Study
Ann Rheum Dis. 2014 (Jul); 73 (7): 1309–1315Davis MA, Onega T, Weeks WB, Lurie JD.
Where the United States Spends its Spine Dollars: Expenditures on Different Ambulatory Services
for the Management of Back and Neck Conditions
Spine (Phila Pa 1976). 2012 (Sep 1); 37 (19): 1693–1701Smith, M, Davis, MA, Stano, M, and Whedon, JM.
Aging Baby Boomers and the Rising Cost of Chronic Back Pain:
Secular Trend Analysis of Longitudinal Medical Expenditures
Panel Survey Data for Years 2000 to 2007
J Manipulative Physiol Ther. 2013 (Jan); 36 (1): 2–11Rajaee, SS, Bae, HW, Kanim, LE, and Delamarter, RB.
Spinal fusion in the United States: analysis of trends from 1998 to 2008.
Spine (Phila Pa 1976). 2012; 37: 67–76Manchikanti, L, Pampati, V, Singh, V, and Falco, FJ.
Assessment of the escalating growth of facet joint interventions in the
medicare population in the United States from 2000 to 2011.
Pain Physician. 2013; 16: E365–E378Manchikanti, L, Pampati, V, Falco, FJ, and Hirsch, JA.
Assessment of the growth of epidural injections in the medicare population from 2000 to 2011.
Pain Physician. 2013; 16: E349–E364Korthals-deBos IBC, et al.
Cost Effectiveness of Physiotherapy, Manual Therapy, and General Practitioner Care
for Neck Pain: Economic Evaluation Alongside a Randomised Controlled Trial
British Medical Journal 2003 (Apr 26); 326 (7395): 911Driessen MT, Lin CW, van Tulder MW.
Cost-effectiveness of Conservative Treatments for Neck Pain:
A Systematic Review on Economic Evaluations
European Spine Journal 2012 (Aug); 21 (8): 1441–1450Gallup, Inc. (2015)
Americans’ Perceptions of Chiropractic
Gallup-Palmer College of Chiropractic Inaugural ReportShekelle, PG, Rogers, WH, and Newhouse, JP.
The effect of cost sharing on the use of chiropractic services.
Med Care. 1996; 34: 863–872Stevans, JM and Zodet, MW.
Clinical, demographic, and geographic determinants of variation
in chiropractic episodes of care for adults using the 2005-2008
Medical Expenditure Panel Survey.
J Manipulative Physiol Ther. 2012; 35: 589–599Kff.org [Internet] Menlo Park, CA:
Kaiser Family Foundation; c2015 [cited 2015 October 1].
North Carolina: Demographics and Economy. 2013 [updated November 10.
(Available from:)
http://kff.org/state-category/demographics-and-the-economy/?state=NCHurwitz, E.L., Vassilaki, M., Li, D. et al.
Variations in Patterns of Utilization and Charges for the Care of Low Back Pain in North Carolina,
2000 to 2009: A Statewide Claims' Data Analysis
J Manipulative Physiol Ther. 2016 (May); 39 (4): 252–262
This is one of 3 of the Cost-Effectiveness Triumvirate articles.Hurwitz EL, Vassilaki M, Li D, Schneider MJ, Stevans JM, Phillips RB, et al.
Variations in Patterns of Utilization and Charges for the Care of Headache in North Carolina,
2000-2009: A Statewide Claims' Data Analysis
J Manipulative Physiol Ther. 2016 (May); 39 (4): 229–239
This is one of 3 of the Cost-Effectiveness Triumvirate articles.
Return to MEDICARE
Return to WHIPLASH
Return to CHRONIC NECK PAIN
Return to COST-EFFECTIVENESS
Return to INITIAL PROVIDER/FIRST CONTACT
Since 5-18-2016


| Home Page | Visit Our Sponsors | Become a Sponsor |
Please read our DISCLAIMER |