

Temporal Trends and Geographic Variations in the Supply
of Clinicians Who Provide Spinal Manipulation to
Medicare Beneficiaries: A Serial Cross-Sectional StudyThis section is compiled by Frank M. Painter, D.C.
Send all comments or additions to: Frankp@chiro.org


FROM: J Manipulative Physiol Ther 2021 (Mar); 44 (3): 177û185 ~ FULL TEXT
OPEN ACCESS James M Whedon ò Scott Haldeman ò Curtis L Petersen ò William Schoellkopf
Todd A MacKenzie ò Jon D Lurie
Health Services Research,
Southern California University of Health Sciences,
Whittier, California.
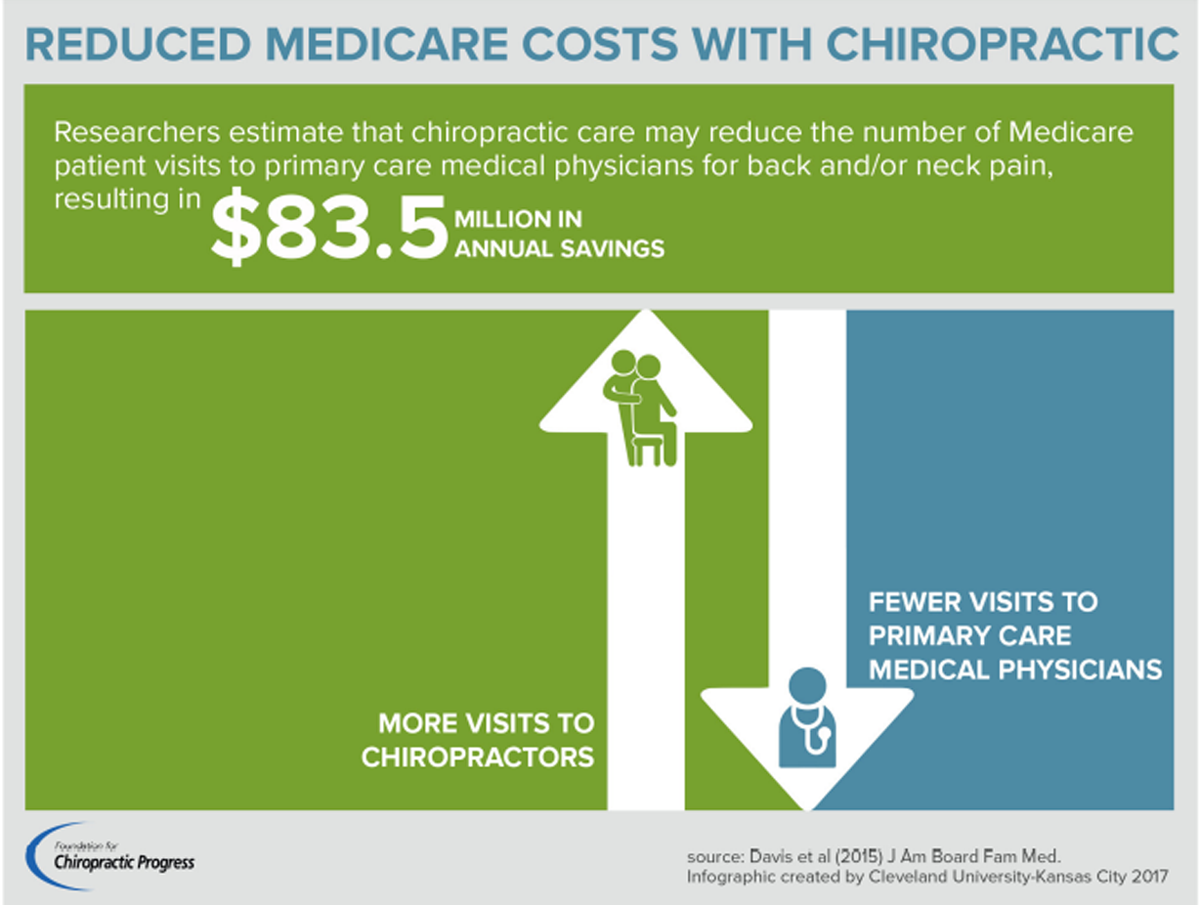
FROM: Davis ~ J Am Board Fam Med. 2015 (Jul); 28 (4): 481û490Objective: Spinal manipulation (SM) is recommended for first-line treatment of patients with low back pain. Inadequate access to SM may result in inequitable spine care for older US adults, but the supply of clinicians who provide SM under Medicare is uncertain. The purpose of this study was to measure temporal trends and geographic variations in the supply of clinicians who provide SM to Medicare beneficiaries.
Methods: Medicare is a US government-administered health insurance program that provides coverage primarily for older adults and people with disabilities. We used a serial cross-sectional design to examine Medicare administrative data from 2007 to 2015 for SM services identified by procedure code. We identified unique providers by National Provider Identifier and distinguished between chiropractors and other specialties by Physician Specialty Code. We calculated supply as the number of providers per 100,000 beneficiaries, stratified by geographic location and year.
Results: Of all clinicians who provide SM to Medicare beneficiaries, 97% to 98% are doctors of chiropractic. The geographic supply of doctors of chiropractic providing SM services in 2015 ranged from 20/100,000 in the District of Columbia to 260/100,000 in North Dakota. The supply of other specialists performing the same services ranged from fewer than 1/100,000 in 11 states to 8/100,000 in Colorado. Nationally, the number of Medicare-active chiropractors declined from 47 102 in 2007 to 45 543 in 2015. The count of other clinicians providing SM rose from 700 in 2007 to 1441 in 2015.
Conclusion: Chiropractors constitute the vast majority of clinicians who bill for SM services to Medicare beneficiaries. The supply of Medicare-active SM providers varies widely by state. The overall supply of SM providers under Medicare is declining, while the supply of nonchiropractors who provide SM is growing.
Keywords: Chiropractic; Manipulation, Spinal; Medicare; Musculoskeletal Manipulations.
From the FULL TEXT Article:
Introduction
Low back pain is highly prevalent in the United States, and management of it can be particularly challenging in the Medicare beneficiary population, which is older and has disabilities and frequently comorbidities. [1, 2] Current evidence-based guidelines advise use of nonpharmacologic therapies as a first-line approach to management of low back pain. [3] Spinal manipulation (SM) is included among the recommended nonpharmacologic therapies. Spinal manipulation is a covered treatment under Medicare, and is often provided to Medicare beneficiaries by doctors of chiropractic (DCs). [4û7] It may also be provided by clinicians of other specialties, including medical physicians, osteopathic physicians, and physical therapists. It was reported in 1992 that 94% of all SM in the US was provided by DCs. [8] Since that time, substantial evidence favoring the value of SM for treatment of spinal pain has accumulated. [9û11] It is not known to what extent SM is now provided by clinicians other than DCs.
Because SM is a high-value intervention for low back pain, variation in the supply of clinicians who provide it may affect patient access to high-quality spine care. [12] Inadequate access to SM may result in inequitable care for older US adults, with the potential for resultant health disparities. [13, 14] Therefore, it is critically important to evaluate the health care workforce with regard to the supply of clinicians who are trained and qualified to perform SM, and thus inform policy initiatives that are intended to ensure adequate supply. The objective of this study was to measure temporal trends and geographic variations in the supply of clinicians who provide SM to Medicare beneficiaries. We hypothesized that the supply of clinicians who provide spinal manipulation remains static over time and that there are significant geographic variations in the supply of Medicare-active clinicians who provide spinal manipulation.
Methods
We conducted a serial cross-sectional study using administrative data files compiled by the Centers for Medicare and Medicaid Services. To measure temporal trends and geographic variations in the supply of clinicians who provide SM to Medicare beneficiaries, we examined 100% Medicare beneficiary enrollment files and 100% Medicare Part B claims files. [15] This study was approved by the Committee for Protection of Human Subjects at Dartmouth College.
Data Wrangling
We analyzed Part B claims for fee-for-service Medicare beneficiaries for 2007û2015. We included all beneficiaries with at least 1 month of Part A or B eligibility during a given year. Spinal manipulation was defined by Current Procedural Terminology code 98940, 98941, or 98942. For each SM case in 2007û2015, we gathered the state in which it occurred, the provider, and the date. We then gathered the total number of beneficiaries in each state for each year. We identified unique providers by National Provider Identifier (NPI). For each year and state, unique providers were identified from the claims data by having a valid NPI code present on at least 2 claims for SM. We used Provider Specialty Code 35 (chiropractors) to distinguish between DCs and other specialists. For providers with more than 1 specialty code, the provider was assigned to the specialty with the most claims. The study cohort for each year was then defined as the providers identified in that year. None of the observations in the analysis had missing values.
Analysis
We calculated supply as the count of providers per 100,000 beneficiaries. Variation in supply between states was examined by calculating the interquartile range, mean, standard deviation, and coefficient of variation. To reveal temporal trends in supply we examined the relationship between year and supply in independent linear models per state. To illustrate geographic variations of this temporal trend and in the supply, we stratified by state and mapped the data by shade-coded supply. All statistical analyses were performed in SAS 9.4 (SAS Institute, Cary, North Carolina) or R 3.6.2 (R Foundation for Statistical Computing, Vienna, Austria). This study was conducted in the context of a multiaim National Institutes of Health-funded investigation of the association between SM and cervical artery dissection.
Results

Table 1
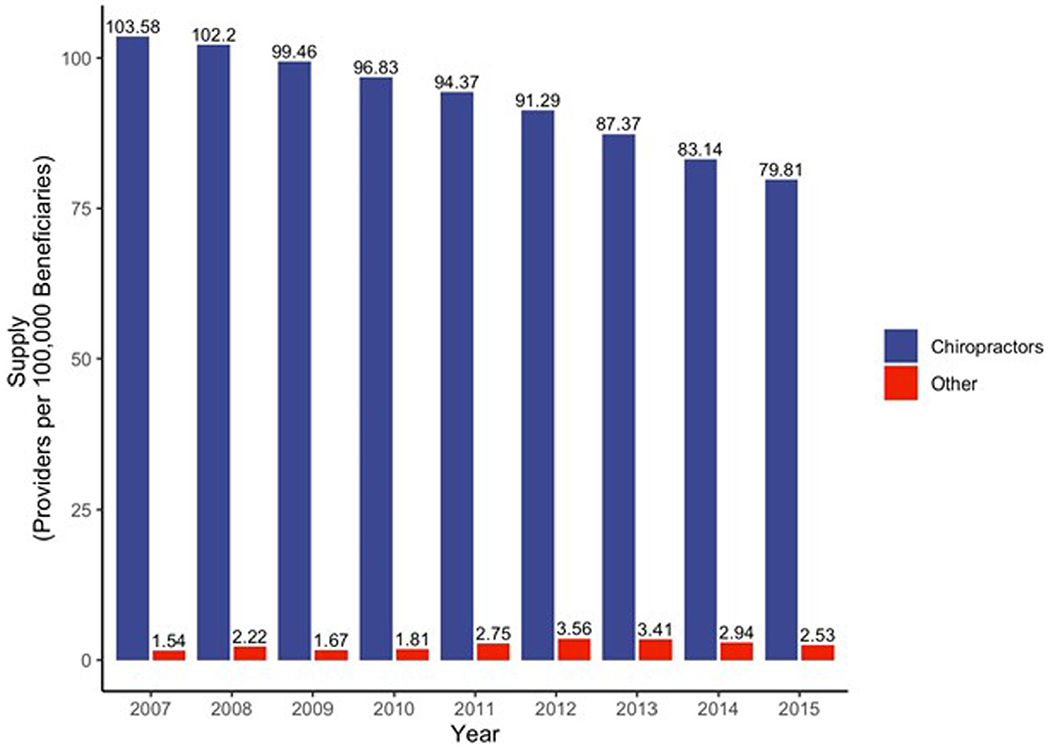
Figure 1
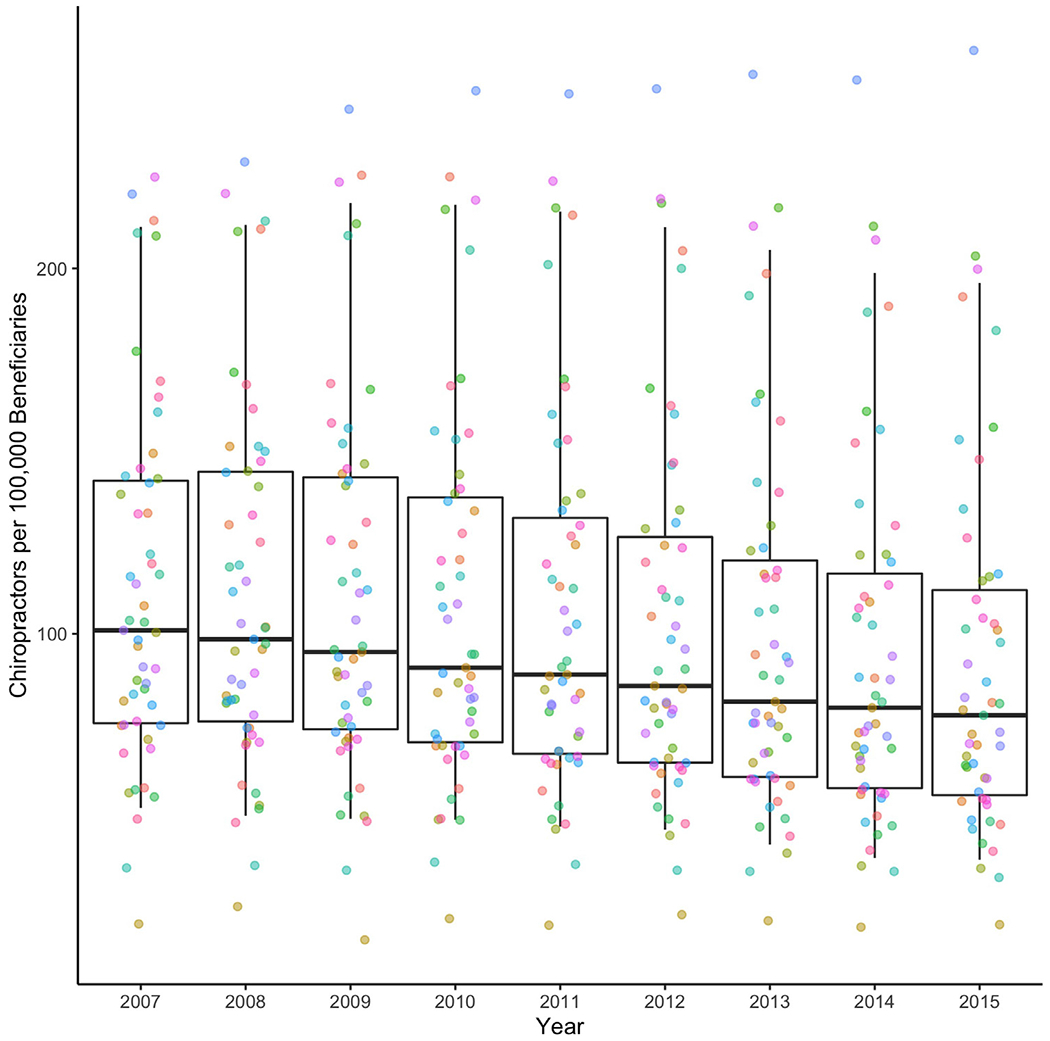
Figure 2
Table 2
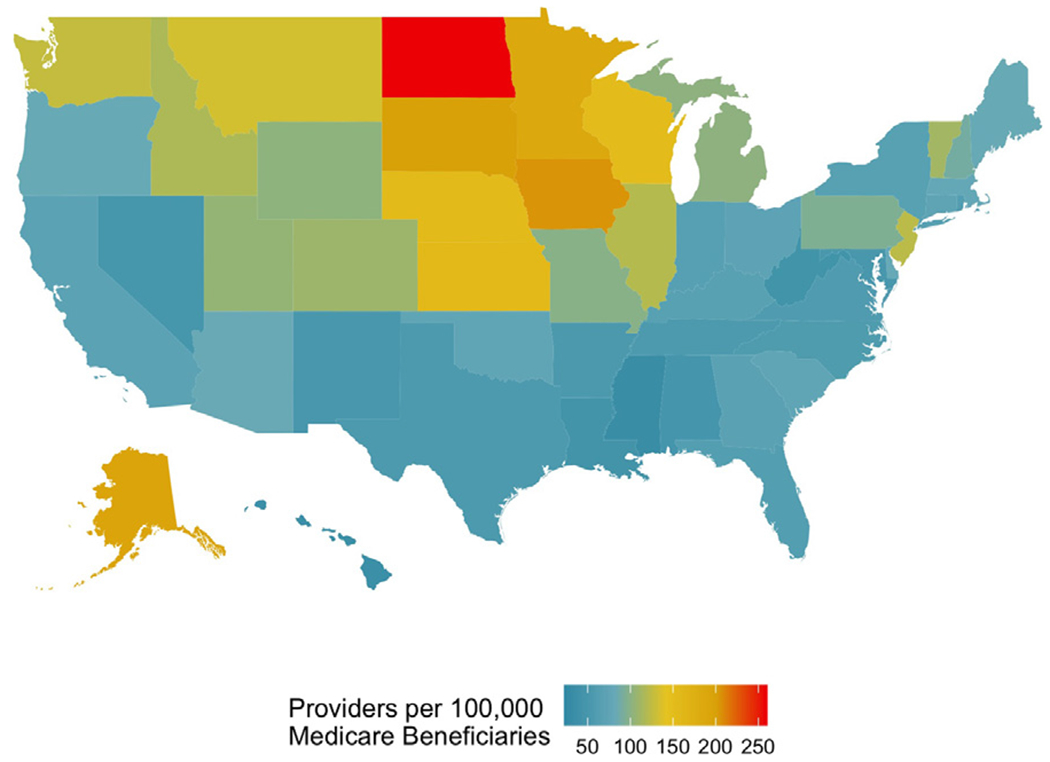
Figure 3
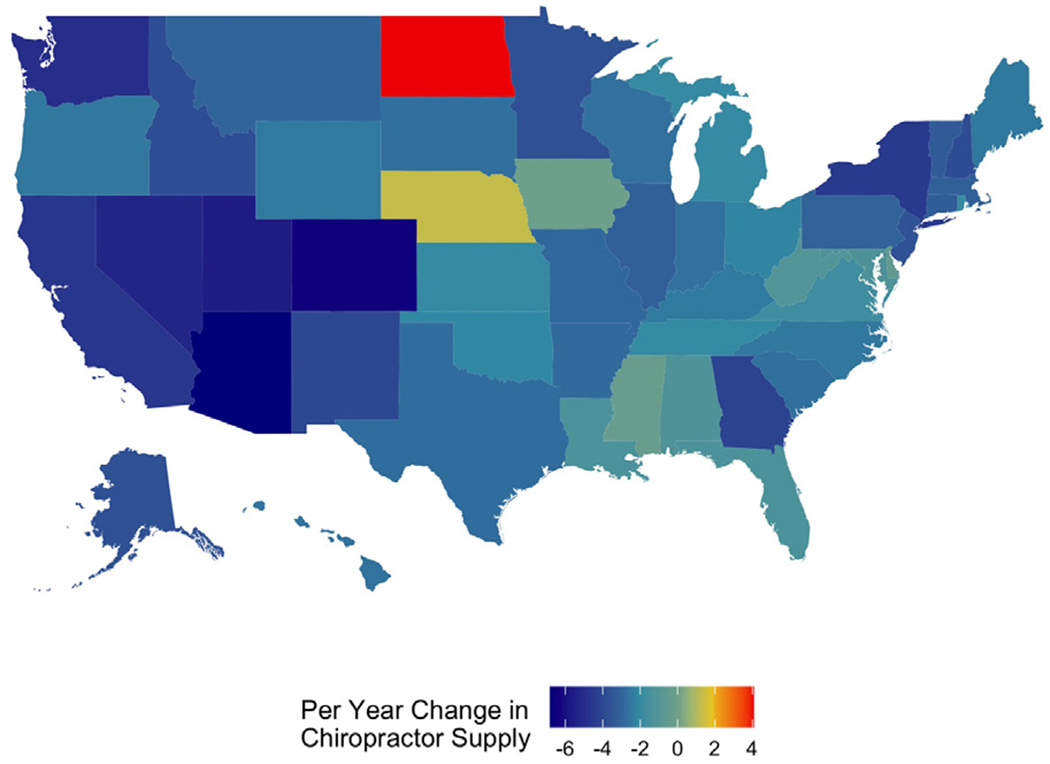
Figure 4 Of all clinicians who submitted specific SM claims to Medicare, 97% to 98% were DCs. Table 1 displays the supply of SM providers by year, distinguishing between chiropractic and other specialties. From 2007 through 2015, the number of Medicare B enrollees increased by 11.5 million (a 25% increase), from 45,475,990 to 57,063,713. During the same time period, the count of DCs providing SM under Medicare dropped by more than 3%, from 47,102 to 45,543, whereas the count of nonchiropractic providers doubled from 700 to 1441. As measured by the coefficient of variation, relative variability in supply gradually increased over time, from 0.44 in 2007 to 0.54 in 2015.
Figure 1 illustrates temporal trends in the supply of SM providers. Throughout the study period, the supply of Medicare-active chiropractors per 100,000 beneficiaries remained more than 25 times higher than the supply of nonchiropractor SM providers. However, from 2007 to 2015 both the supply of chiropractic providers and the overall supply fell by approximately 23%, whereas the supply of nonchiropractic manipulation providers increased by 64%.
Figure 2 illustrates temporal trends in supply by state, specifically for DCs. The median supply of DCs providing SM under Medicare decreased nationwide, but this trend was not consistent across all states. Among the 47 states that had a significant linear change, the supply decreased in 46 and increased in 1. For example, in North Dakota the supply of SM-providing chiropractors increased by 4.1/100,000 per year, while in Arizona it decreased by 6.8/100,000 per year.
Table 2 shows geographic variations in the supply of clinicians who provide SM to Medicare beneficiaries. By state in 2015, the supply of DCs per 100,000 beneficiaries varied more than 12ûfold, ranging from 20/100,000 in the District of Columbia to 260/100,000 in North Dakota. The supply of other specialists performing the same services ranged from below 1/100,000 in 11 states to 8/100,000 in Colorado. The average supply across all states in 2015 was 91.6/100,000 for DCs and 2.3/100,000 for other providers.
The map in Figure 3 illustrates variation by state in the overall supply of SM providers (chiropractic and nonchiropractic combined). Higher levels of supply are evident in a block of states in the northern prairie region, while lower levels of supply are seen in the South.
Figure 4 illustrates temporal trends by state in the supply of chiropractors. Only 2 states demonstrated a per-year increase in chiropractors performing spinal manipulation from 2007 to 2015. North Dakota increased by an average of 4 chiropractors per 100,000 beneficiaries over this time (P < 0.001) while Nebraska increased at a rate of 1 every 3 years, but this change was not significant over time (P = 0.1), The supply of chiropractors decreased in all other states in the US, with the highest rate of decrease in Arizona (û6.8/100,000, P < 0.001), followed by Colorado (û6.4, P < 0.001).
Discussion
The results demonstrate that chiropractic remains the health care specialty that provides the vast majority of SM to Medicare beneficiaries. However, the supply of nonchiropractors who provide SM is growing, even as (in contradiction to our first hypothesis) the overall supply of SM providers is declining. In support of our second hypothesis, we found evidence of significant geographic variation in supply. These findings may potentially help policy makers plan strategies for providing patients with equitable access to high-quality spine care, help clinicians determine where to locate their practices, and help public and private organizations understand supply and demand in markets for spinal manipulation services.
From a clinical and patient-centered perspective, because DCs constitute 97% to 98% of all clinicians who provide SM to Medicare beneficiaries, our findings on temporal trends and geographic variations are most relevant to chiropractors and their patients. Our current estimate of the national supply of DCs is congruent with a recent study by Davis et al, [16] which found that the total number of Medicare-active DCs ranged from a high of 45,264 in 2012 to a low of 44,040 in 2014. Our finding that the supply of DCs varied geographically by more than 12ûfold is consistent with all earlier studies. Whedon et al [17] found that DC supply varied by Hospital Referral Region in 2008 by a factor of more than 14, and Davis et al [18] reported a variation of more than 17ûfold in 2011. The general national pattern of geographic variation in supply (higher in the northern prairie states and lower in the South; Fig 3) is also consistent with previous reports. [12, 17û19] It is notable that North Dakota was consistently a high outlier and demonstrated a strong trend of increasing supply over the entire study period (Fig 4).
Our findings are also relevant to policy makers and payers because an inadequate supply of SM providers may result in higher costs for spine care. Previous research has shown that chiropractic costs under Medicare compare favorably with those of conventional medical care for chronic low back pain. [2] In a quasi-experimental study of over 84,000 older Medicare beneficiaries, Davis et al [12] found that increased access to chiropractic care was correlated with reduced spine-related costs.
Changes over time in the supply of SM providers reflect trends and fluctuations in both provider count and Medicare enrollment. From 2007 to 2015, the supply of DCs failed to keep pace with growing Medicare enrollment, which is associated with aging of the US population. Growth in the supply of nonchiropractic manipulation providers may reflect the emergence of evidence of the superior value of nonpharmacologic spine therapies, but it did not compensate for the overall decline in supply. Because the use of chiropractic care under Medicare is highly correlated with the supply of chiropractors, [17] the national decline in supply ù coupled with persistent regional differences in supply ù suggests that Medicare beneficiary access to chiropractic care may be inequitable. Inequitable access may be particularly acute in Southern states, where supply is relatively low and the population is characterized by higher proportions of people of color, poorer health status, and lower socioeconomic status.
A greater supply of clinicians who provide SM has been shown to be positively correlated with use of spinal manipulation [17] and negatively correlated with use of opioids. [20] Because SM is recommended as a first-line nonpharmacologic approach to the treatment of low back pain, and 1 of the few such therapies covered under Medicare, variation in the supply of clinicians who provide SM may also result in inequitable care for older US adults, and resultant health disparities. [13, 14] Where low supply occurs in areas with lower socioeconomic status and poorer health status (as in certain areas of the Southern US, for example), the quality of spine care may be lower, and existing health disparities may be accentuated.
The observed decline in the overall supply of SM providers under Medicare is concerning, because low back pain is 1 of the most common reasons for a physician visit among older US adults. [21] The point prevalence of nonspecific back pain among older adults is approximately 30%. [22] Older adults often have recurrent episodes of low back pain [23]; between 2000 and 2007, the total number of adults with chronic low back pain increased by 64%. [24] With the aging of the US population, the number of Medicare enrollees is projected to further increase by 29%, from 62 million in 2020 to over 80 million by 2030. [25] These trends are likely to converge and cause increased demand for spine care under Medicare even as the supply of Medicare-active SM providers is declining.
The causes of the observed trends and variation in the supply of SM providers are unknown, but the trends may be the result of geographic variation in patient demand or provider reimbursement. Where variations in supply of SM reflect genuine differences in patient treatment preferences or demand for SM, health disparities may be less likely to be caused by low supply. However, providers may be less likely to locate their practices in areas where reimbursement is perceived to be inadequate, and such areas of low supply may be correlated with reduced access to necessary spine care and associated health disparities. [26] Further investigation is needed to discover the underlying causes of the reported trends and variations, and to identify appropriate patient-centered policy changes.
Limitations
General limitations of using health claims data for research include inconsistencies in billing practices and coding of procedures. Obtaining an accurate count of providers can be challenging because some clinicians may bill under an institutional NPI, or a medical directorÆs NPI, and clinicians may also practice in more than 1 state. Counts of providers do not reflect whether a clinician practices fulltime, what the volume of their caseload is, or how frequently they perform spinal manipulation; therefore, provider supply does not necessarily equate with provider availability. The supply of SM providers does not reflect the quality, safety, or cost of care, nor any other measure of health care value. The results apply to Medicare Part B and may not be generalized to other populations. To capture rates of SM under Medicare, we included only those procedure codes that are specific for SM. Thus, to the extent that SM procedures may be billed under alternative procedure codes such as those for manual therapy, rates of SM may have been underestimated. Although the claims data available for this study were limited to Medicare Part B, the study population included beneficiaries with Part C enrollment in addition to those eligible for Part B. Thus, because the denominator included all Medicare beneficiaries, differences in supply may reflect differences in Part C enrollment as well as differences in the number of SM providers.
We found the national supply of Medicare-active DCs to be 45,543 in 2015, which is considerably lower than the total of 74,623 reported for 2006 by Davis et al [16] and the total of 57,912 reported for 2007 by Whedon and Song. [19] The discrepancies are likely due to differences in the methods used to count chiropractors. Finally, we note that geographic variations in SM supply do not necessarily result in inequitable access to SM or health disparities. They may also reflect differences in patient treatment preferences and demand for SM.
Conclusion
Most clinicians who bill for SM services to Medicare beneficiaries are chiropractors. The supply of Medicare-active SM providers varies widely by state. The overall supply of SM providers under Medicare is declining, while the supply of nonchiropractors who provide SM is growing. Since SM is recommended for first-line treatment of low back pain, adequate access to SM is needed to provide equitable spine care for older US adults. The supply of clinicians who provide SM under Medicare deserves further attention.
Practical Applications.
The findings will help policy makers plan strategies for providing patients with equitable access to high-quality spine care.
The findings will help clinicians determine where to locate their practices.
The findings will help public and private organizations understand supply and demand in markets for spinal manipulation services.
Funding Sources and Conflicts of Interest
This research was supported by the National Center for Complementary and Integrative Health of the National Institutes of Health under award number 5R01-AT009720. This project was 100% federally funded. The content is solely the responsibility of the authors and does not necessarily represent the official views of the National Institutes of Health. No conflicts of interest were reported for this study.
References:
Kim LH, Vail D, Azad TD, et al.
Expenditures and Health Care Utilization Among Adults with
Newly Diagnosed Low Back and Lower Extremity Pain
JAMA Network Open 2019 (May 3); 2 (5): e193676Weeks WB, Leininger B, Whedon JM, et al.
The Association Between Use of Chiropractic Care and
Costs of Care Among Older Medicare Patients With
Chronic Low Back Pain and Multiple Comorbidities
J Manipulative Physiol Ther. 2016 (Feb); 39 (2): 63û75Qaseem A, Wilt TJ, McLean RM, Forciea MA.
Noninvasive Treatments for Acute, Subacute, and Chronic
Low Back Pain: A Clinical Practice Guideline From
the American College of Physicians
Annals of Internal Medicine 2017 (Apr 4); 166 (7): 514û530Whedon JM, Davis MA.
Medicare part B claims for chiropractic spinal manipulation, 1998 to 2004.
J Manipulative Physiol Ther. 2010;33(8):558û561.Whedon JM, Goertz CM, Lurie JD, Stason WB.
Beyond Spinal Manipulation: Should Medicare Expand
Coverage for Chiropractic Services? A Review and
Commentary on the Challenges for Policy Makers
J Chiropractic Humanities 2013 (Aug 28); 20 (1): 9û18Weeks WB, Whedon JM, Toler A, Goertz CM.
MedicareÆs demonstration of expanded coverage for chiropractic services:
limitations of the demonstration and an alternative direct cost estimate.
J Manipulative Physiol Ther. 2013;36(8):468û481.Weigel PA, Hockenberry JM, Wolinsky FD.
Chiropractic Use in the Medicare Population:
Prevalence, Patterns, and Associations With
1-Year Changes in Health and Satisfaction With Care
J Manipulative Physiol Ther. 2014 (Oct); 37 (8): 542-551Shekelle PG, Adams AH, Chassin MR, Hurwitz EL, Brook RH.
Spinal manipulation for low-back pain.
Ann Intern Med. 1992;117(7):590û598.Coulter ID, Crawford C, Hurwitz EL, et al.
Manipulation and Mobilization for Treating Chronic Low Back Pain:
A Systematic Review and Meta-analysis
Spine J. 2018 (May); 18 (5): 866û879Coulter ID, Crawford C, Vernon H, et al.
Manipulation and Mobilization for Treating Chronic Nonspecific Neck Pain:
A Systematic Review and Meta-Analysis for an Appropriateness Panel
Pain Physician. 2019 (Mar); 22 (2): E55ûE70Rubinstein SM, de Zoete A, van Middelkoop M, Assendelft WJJ.
Benefits and Harms of Spinal Manipulative Therapy for the Treatment
of Chronic Low Back Pain: Systematic Review and Meta-analysis
of Randomised Controlled Trials
British Medical Journal 2019 (Mar 13); 364: 1689Davis MA, Yakusheva O, Liu H, Tootoo J, Titler MG, Bynum JPW.
Access to Chiropractic Care and the Cost
of Spine Conditions Among Older Adults
American J Managed Care 2019 (Aug); 25 (8): e230ûe236Derose KP, Gresenz CR, Ringel JS.
Understanding disparities in health care accessù
and reducing themùthrough a focus on public health.
Health Aff (Millwood). 2011;30(10): 1844û1851.Baicker K, Chandra A, Skinner JS, Wennberg JE.
Who you are and where you live: how race and geography
affect the treatment of Medicare beneficiaries.
Health Aff (Millwood). 2004;23(suppl 2):33û44.Research Data Assistance Center.
Research identifiable file availability.
Available at: https://www.resdac.org/file-availability
Accessed January 22, 2021.Davis MA, Mackenzie TA, Coulter ID, Whedon JM, Weeks WB.
The United States Chiropractic Workforce:
An Alternative or Complement to Primary Care?
Chiropractic & Manual Therapies 2012 (Nov 21); 20: 35Whedon JM, Song Y, Davis MA, Lurie JD.
Use of Chiropractic Spinal Manipulation in Older Adults
is Strongly Correlated with Supply
Spine (Phila Pa 1976). 2012 (Sep 15); 37 (20): 1771û1777Davis MA, Yakusheva O, Gottlieb DJ, Bynum JP.
Regional Supply of Chiropractic Care and Visits to
Primary Care Physicians for Back and Neck Pain
J American Board of Family Medicine 2015 (Jul); 28 (4): 481û490Whedon J, Song Y.
Geographic variations in availability and use of
chiropractic under medicare.
J Manipulative Physiol Ther. 2012;35(2):101û109.Weeks WB, Goertz CM.
Cross-Sectional Analysis of Per Capita Supply of Doctors of
Chiropractic and Opioid Use in Younger Medicare Beneficiaries
J Manipulative Physiol Ther. 2016 (May); 39 (4): 263û266Hart LG, Deyo RA, Cherkin DC.
Physician office visits for low back pain: frequency, clinical evaluation,
and treatment patterns from a U.S. national survey.
Spine (Phila Pa 1976). 1995;20(1):11û19.Docking RE, Fleming J, Brayne C, Zhao J, Macfarlane GJ, Jones GT.
Epidemiology of back pain in older adults:
prevalence and risk factors for back pain onset.
Rheumatology. 2011;50(9):1645û1653.Dunn KM, Hestbaek L, Cassidy JD.
Low back pain across the life course.
Best Pract Res Clin Rheumatol. 2013;27(5):591û600.Smith M, Davis MA, Stano M, Whedon JM.
Aging Baby Boomers and the Rising Cost of Chronic Back Pain:
Secular Trend Analysis of Longitudinal Medical Expenditures
Panel Survey Data for Years 2000 to 2007
J Manipulative Physiol Ther. 2013 (Jan); 36 (1): 2û11Medpac.
Report to the Congress: the next generation of Medicare beneficiaries.
Available at: http://www.medpac.gov/docs/default-
source/reports/chapter-2-the-next-generation-of-medicare-
beneficiaries-june-2015-report-.pdf
Accessed March 10, 2021.Casper S, Schroeder GD, McKenzie J, et al.
Medicaid reimbursement for common spine procedures:
are compensation rates consistent?
Spine (Phila Pa 1976). 2019;44(22):1585û1590.
Return to MEDICARE
Since 2-01-2025
| Home Page | Visit Our Sponsors | Become a Sponsor |
Please read our DISCLAIMER |