

Degenerative Changes Following Spinal Fixation
in a Small Animal ModelThis section is compiled by Frank M. Painter, D.C.
Send all comments or additions to: Frankp@chiro.org


FROM: J Manipulative Physiol Ther 2004 (Mar); 27 (3): 141–154 ~ FULL TEXT
Gregory D Cramer, DC, PhD, Jaeson T Fournier, DC, MPH,
Christopher C Wolcott, DC, Charles N.R Henderson, DC, PhD
Department of Research,
National University of Health Sciences,
200 E Roosevelt Road,
Lombard, IL 60148, USA.
gcramer@nuhs.edu
OBJECTIVE: The objective of this study was to evaluate changes of the lumbar vertebral column following fixation.
DESIGN: Using an established small animal (rat) model of spinal fixation (hypomobility), 3 contiguous lumbar segments (L4, L5, L6) were fixed with a specially engineered vertebral fixation device. Spinal segments of control rats were compared with those of animals with 1, 4, or 8 weeks of fixation. Subgroups of these fixation animals subsequently had the fixation device removed for 1, 2, 4, 8, or 12 weeks to evaluate the effects of attempting to reestablish normal forces to the vertebral segments following hypomobility.
SETTING: This Institutional Animal Care and Use Committee (IACUC) approved study was conducted in a university animal facility.
ANIMALS: Eighty–seven animals (23 controls animals and 64 fixation animals) were used in this study.
MAIN OUTCOME MEASURES: Outcome measures were degenerative changes of the vertebral bodies (VBs) and intervertebral disks (IVDs), zygapophysial (Z) joint osteophyte formation, and Z joint articular surface degeneration (ASD). Changes found in vertebral segments that were fixed (hypomobile) were compared with changes in adjacent nonfixed vertebral segments, and changes among fixation animals were compared with nonfixed controls.
MAIN RESULTS: Very few degenerative changes were identified on the VBs and IVDs. Z joint changes were significant, both for osteophyte formation (analysis of variance [ANOVA], P <.0001) and ASD (ANOVA, P <.0001). Fixed segments had more degenerative changes than nonfixed segments for all Z joint parameters (ANOVA, P <.0001). Osteophyte formation and ASD were directly dependent on duration of fixation.
CONCLUSIONS: These findings indicate that fixation (hypomobility) results in time–dependent degenerative changes of the Z joints.
From the Full–Text Article:
Introduction
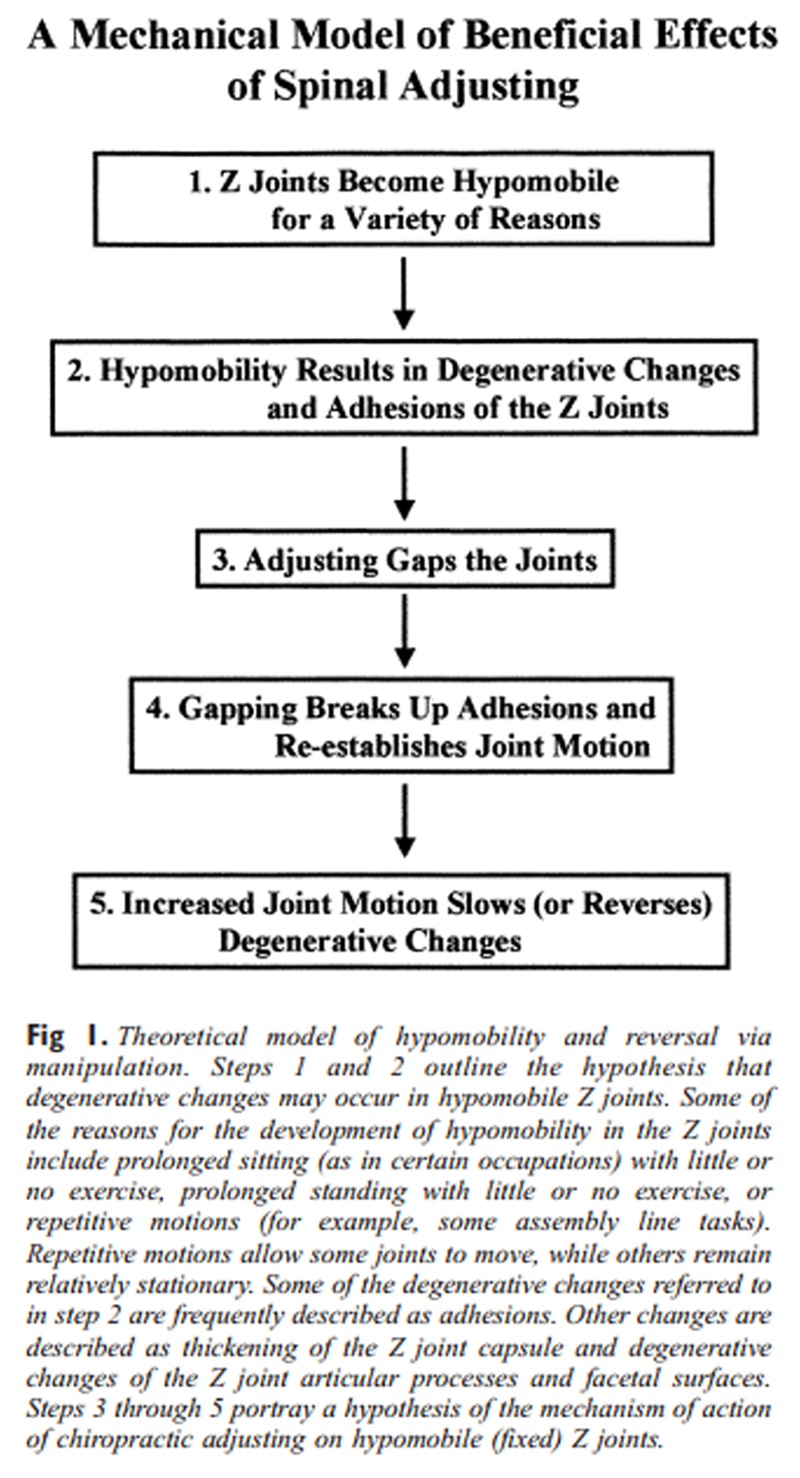
Figure 1 A widely accepted theoretical model suggests that adhesions and degenerative changes develop in hypomobile zygapophysial (Z) joints [1–3] (Figure 1). Chiropractic adjusting has been found to gap the Z joints, [4, 5] and this gapping action is thought to break up adhesions within the Z joints, thus allowing for increased mobility. [1, 6, 7] This putative increase in mobility is thought to slow, and possibly, to some extent reverse the degenerative changes caused by hypomobility. [1] However, to our knowledge, there have been no reports in the peer–reviewed literature documenting degenerative changes following hypomobility of the Z joints. Animal models are necessary to evaluate such changes, and until recently such models were lacking. [8–10] The recent development of a small animal (rat) model [10–12] allows for the assessment of the Z joints and other spinal structures following fixation (hypomobility) of various time periods. In addition, the animal model allows for motion to be reestablished following periods of spinal fixation. Using this animal model, we sought to answer 3 questions in this study.
They were the following:
Will experimentally induced lumbar spine fixation (hypomobility) produce degenerative spine changes (hypertrophic spurs on the vertebral bodies and Z joints, intervertebral disk thinning, or Z joint articular cartilage and subchondral articular surface changes)?
Will the degenerative changes just mentioned be greater with increased fixation time (1, 2, 4, 8, 12, or 16 weeks) or with a given experimental fixation position (neutral, flexed, or rotated)?
Is there a “time window” within which these degenerative changes will spontaneously remit if the experimental fixation is removed?
If degenerative changes of the Z joints were found to develop following hypomobility, then future work using this animal model could evaluate the effects of chiropractic spinal adjusting on the severity and time profile of such degenerative changes.
Methods
This study was approved by the Institutional Animal Care and Use Committees (IACUC) of the participating institutions.

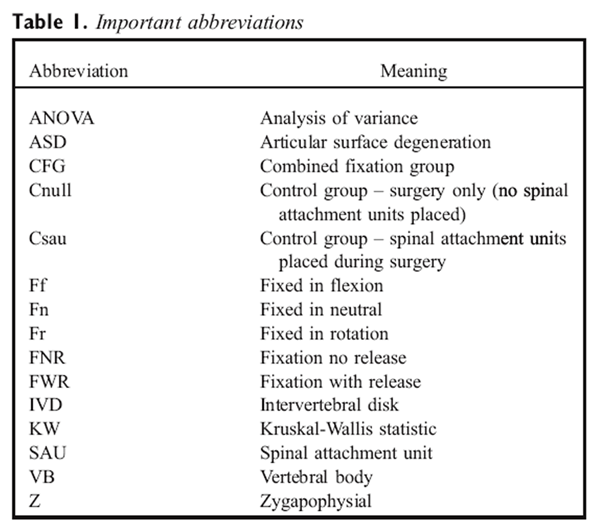
Table 1
Figure 2 Because of the number of abbreviations used in this study, Table 1 has been included. This table provides a summary of the abbreviations used in the following sections.
Eighty-seven Sprague Dawley rats, weighing 450 g to 550 g each, were used in this study. These were separated into 2 experimental fixation categories and 2 control groups. The 2 experimental fixation categories were:1) the Fixation No Release (FNR) Group; and
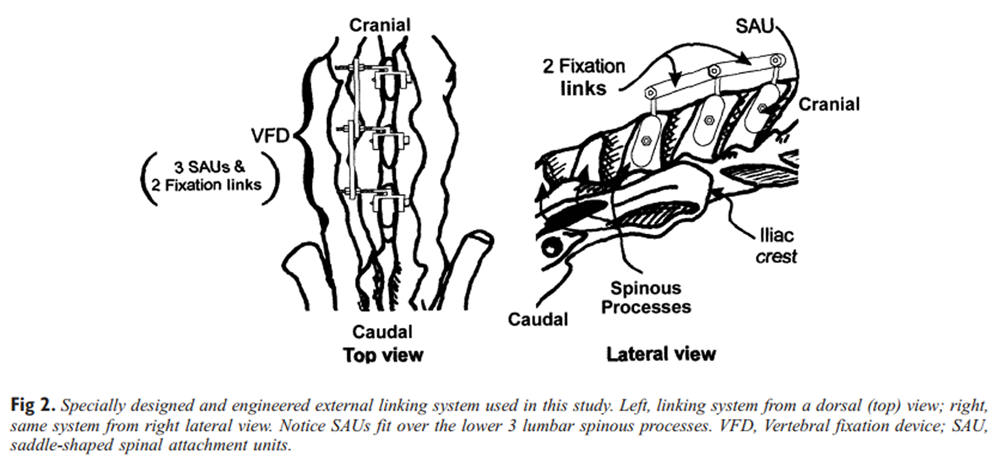
2) three Fixation with Release (FWR) groups.Three contiguous lumbar segments (L4, L5, and L6 [rats have 6 lumbar vertebrae]) were fixed in all animals in the experimental fixation groups. Fixation (hypomobility) was achieved by means of a specially designed and engineered external linking system (Figure 2). [10] The external linking system was composed of 3 stainless steel spinal attachment units (SAUs), each of which was surgically implanted on one of the aforementioned lumbar vertebrae, and 2 stainless steel linking bars (links) that rigidly connected the vertical shafts of the 3 implanted SAUs. Each SAU fit, like a saddle, over a spinous process.
Extending vertically from the saddle was a bar that was approximately 2.1 mm wide from cephalad to caudad, 0.9 mm thick from left to right, and 12.0 mm ventral to dorsal. The “saddle” of each SAU was then affixed by clamping its sides together against the spinous process. The left side of the saddle (when in place on the spinous process) had a threaded 1.5-mm hole. A slightly larger, nonthreaded hole was present on the right side of the saddle. The holes on each side were in alignment with one another. The 2 holes were connected by drilling through the spinous process with the saddle in place. A single threaded screw was then inserted from the right side and carefully tightened to secure the attachment of the SAU to the spinous process. An SAU was attached in this way to the L4, L5, and L6 spinous processes. The 12-mm high vertical bar of the SAU extended through the skin of the back.
Following one week of postsurgical recovery, the vertical bars of the fixation animals were linked together. This was done by bolting the links to the dorsal extremes of the 3 contiguous vertical bars (Figure 2. The links completed the fixation procedure. The external linking system permitted reversible, experimental fixation (hypomobility) of the vertebrae bearing the SAUs (L4, L5, and L6).
The 64 rats in the experimental fixation groups were linked in one of 3 fixation positions: neutral, flexed, or rotated.The neutral fixation position (Fn) was attained by linking the 3 SAUs in the position assumed when the anesthetized animal was placed prone on a firm surface.
The flexion fixation position (Ff) was attained by linking the anesthetized, prone rat with its lumbar region flexed over a 2-in diameter plastic cylinder.
Fixation in rotation (Fr) was attained by shifting the middle (L5) SAU laterally, relative to the outer (L4 and L6) SAUs, in the anesthetized rat.This was done by adding 2 spacers (extra nuts) to the horizontal bolt of the L5 SAU (Figure 2). In the rotated position, the rat's spine was neutral with regard to flexion/extension, but the L5 vertebra was rotated.
Immediately following all linking procedures, a drop of thread locker (Loctite 222MS thread locker, Loctite Corporation, Rocky Hill, Conn) was applied to the nuts to prevent subsequent loosening. These procedures have been found to increase stiffness by ≥350% while the segments are linked and by ≥25% (≥20 N/mm, posterior-anterior stiffness coefficient) immediately following removal of the links. [11] This represents significant hypomobility but falls far short of complete lack of motion. Therefore, this model produces hypomobility of the fixed segments. For this reason, the terms hypomobility and fixation will be used interchangeably throughout this article.
The 2 control groups in this study were termed theControl without SAUs (Cnull) group and the
Control with SAUs (Csau) group.The Cnull group underwent a fully replicated surgical procedure, but the SAUs were not actually attached to the vertebrae. The Csau group had the SAUs attached during the surgical procedure, but the SAUs were never linked in fixation. Consequently, none of the control animals underwent vertebral fixation.
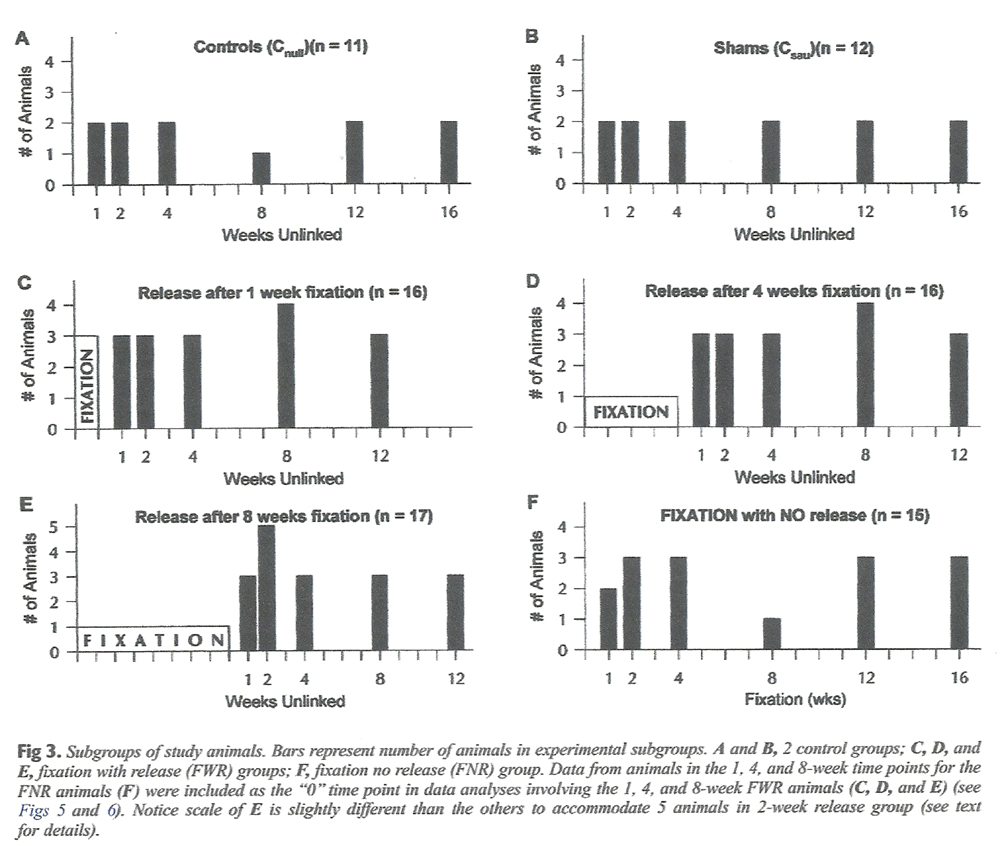
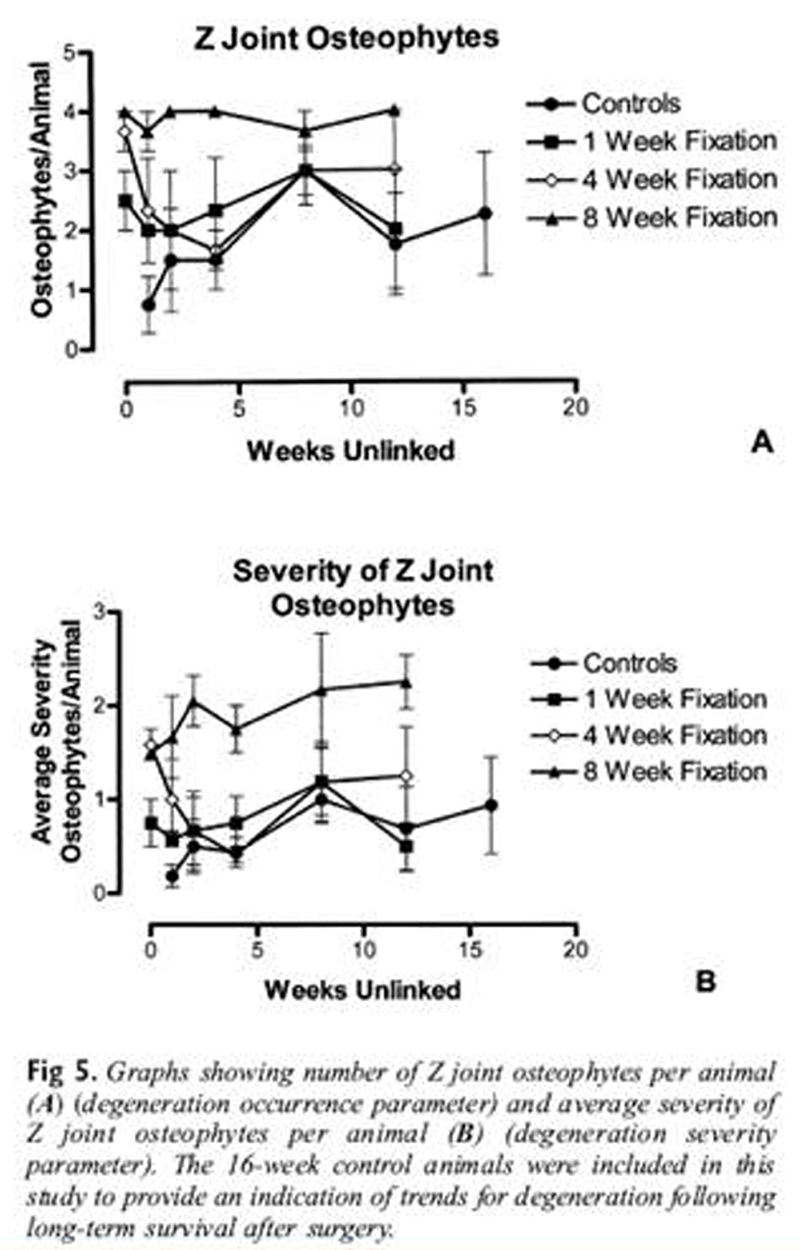
Figure 3 Figure 3 is a diagram showing the various groups (graphs A through F) and subgroups (bars on each graph) of animals used in the study. Notice that 23 control animals and 64 experimental fixation animals were used. As mentioned previously, the control animals were divided into Cnull (Fig 3, A) and Csau (Fig 3, B) groups. The 16-week control animals were included in this study to provide an indication of the trends for degeneration following long-term survival following surgery. The experimental fixation animals were divided into FNR (Fig 3, F) and FWR (Fig 3, C through E) groups. The fixation (linked) period varied for rats in the FNR group (1, 2, 4, 8, 12, or 16 weeks). The FNR animals were sacrificed as soon as the fixation period was over (ie, there was no unlinked period). This provided information on the continuum of change following fixation for a brief to an extended period of time.
The 12-week and 16-week FNR animals were included in this study to provide an indication of the trends for degeneration following long-term fixation without release. There were 3 FWR groups. These animals were linked in fixation for either 1, 4, or 8 weeks (depending on the group), after which the links were removed for a variable “unlinked” period of 1, 2, 4, 8, or 12 weeks. This postfixation (unlinked) time period allowed for evaluation of the effects of reestablishing joint motion by simply removing the links after a period of joint fixation. Each FWR and FNR fixation subgroup in the study (black bars on Fig 3, C through F) was planned to have 3 animals: 1 fixed in flexion (Ff), 1 fixed in neutral (Fn) and 1 fixed in rotation (Fr).
On arrival from the animal supply facility, the rats were assigned to one of the groups described above. The long-term survival groups were filled first and this was followed by sequentially filling the groups comprised of shorter-term animals.
To study the vertebral structures, the animals were euthanized and then placed in a demestid beetle colony until all soft tissues except ligaments were removed. The lumbar spine sacrum, and pelvis were removed en bloc and hydrated and fixed in a 5% formalin solution.
The vertebral bodies (VBs), intervertebral disks (IVDs), and Z joints of all 87 animals were evaluated for signs of degeneration. Therefore, macroscopic evaluation was performed on435 VBs (L3, L4, L5, L6, S1) (5 VBs × 87 animals),
348 IVDs (L3-4, L4-5, L5-6, L6-S1),
696 Z joints (left and right L3-4, L4-5, L5-6, L6-S1), and
1392 Z joint articular surfaces (cartilage and subchondral bone of the cephalad and caudad articular processes for each Z joint).For the purpose of economy of words throughout the remainder of this article, the terms articular facet or articular surface will be used to refer to the combined regions of the hyaline cartilage articular facet of a Z joint articular process and the subchondral bone found immediately subjacent to this cartilage.
Two types of evaluations were performed for each tissue (VB, IVD, articular processes, articular facets). The 2 evaluations were degeneration occurrence evaluation and degeneration severity evaluation. Degeneration occurrence evaluation was simply a count of the number of segments (or facetal surfaces) affected by degeneration for each animal. Degeneration severity evaluation was performed by grading, on a scale of 0 to 3 (from least to most severe, respectively), the severity of each instance of degeneration. Therefore, the resulting data consisted of degeneration occurrence parameters and degeneration severity parameters for the VBs, IVDs, Z joints with osteophytes, and Z joint articular surfaces. No formal blinding procedures were used in this study.
Evaluation of the Vertebral Bodies
The L3-S1 VBs were systematically evaluated for signs of degeneration (degeneration occurrence parameter). More specifically, the external aspects of the ventral and lateral surfaces of the VBs were evaluated for the presence of osteophytes using 6X and 12X magnifications of a dissecting microscope. Osteophyte severity (degeneration severity parameter) was then graded on a scale of 0 to 3 as follows:Osteophyte formation on vertebral bodies (degeneration severity parameter):
0 = no osteophytes
1 = single osteophyte of <2mm in length
2 = single osteophyte of 2 mm to 4mm in length or more than 1 osteophyte of <2 mm in length
3 = osteophyte(s) of >4 mm in length or more than 1 osteophyte of 2 mm to 4mm in length
Evaluation of the Intervertebral Disks
The ventral and lateral surfaces of the L3-4 to L6-S1 IVDs were also evaluated for signs of narrowing using 6X and 12X magnifications of the dissecting microscope (degeneration occurrence parameter). Severity of narrowing (degeneration severity parameter) was then graded on a scale of 0 to 3 as follows:IVD narrowing (degeneration severity parameter):
0 = no narrowing
1 = mild narrowing (narrowing leaving more than two thirds of normal IVD space)
2 = moderate narrowing (narrowing leaving between one third to two thirds typical IVD space)
3 = severe narrowing (narrowing leaving < one third of typical IVD space)
Evaluation of the Z Joints
The Z joints of the right and left L3-4 to L6-S1 segments were systematically evaluated in 2 stages. First, the external aspects of the cephalad articular processes were evaluated for the presence of osteophytes (degeneration occurrence parameter). The caudad articular processes rarely showed signs of osteophytosis. This was most likely due to the anatomic makeup of these processes. Each caudad articular process fits snugly into the cephalad articular process of the vertebra below, thus providing little room for osteophyte formation on the caudad process. Evaluation of the cephalad articular processes took place using 6X and 12X magnifications of a dissecting microscope.
The second stage of Z joint evaluation began by carefully dissecting away the Z joint capsules. The joints were then disarticulated, and each articular surface was systematically evaluated under 6X, 12X, and, if needed, 25X magnifications. The articular surfaces were evaluated to identify erosions (roughening and pitting), elevations, or signs of remodeling of the articular surfaces (degeneration occurrence parameter). [13] The changes for both the presence of osteophytes (stage 1 of the evaluation) and for signs of degeneration of the articular surfaces (stage 2 of the evaluation) were then graded on a scale of 0 to 3, with 3 being the most severe changes (degeneration severity parameters). The scales for the severity parameters for the 2 stages of evaluation were as follows:Z joint osteophyte formation (stage 1 of evaluation, degeneration severity parameter):
0 = no osteophytes
1 = osteophyte(s) of <2mm in length
2 = osteophyte(s) of 2 mm to 4mm in length that did not extend along the entire
external surface of the articular process
3 = osteophyte(s) of >2 mm in length that did extend along the entire external
surface of the articular process or an osteophyte(s) of >4 mm in lengthNotice that the grading systems for osteophyte formation on VBs and Z joints were different. This was because the usual pattern of osteophytosis differed between the 2 structures. The VBs tended to have fewer and smaller osteophytes than the Z joints. Therefore, the upper range of the Z joint osteophyte severity scale reflects more pronounced spur formation than does the same scale for VB osteophytes.
Z joint articular surface degeneration (ASD) (stage 2 of evaluation, degeneration severity parameter):
0 = no ASD
1 = presence of 1 of the following: pitting, roughening, elevations, or remodeling
2 = presence of 2 of the following: pitting, roughening, elevations, or remodeling
3 = presence of at least 3 of the following: pitting, roughening, elevations, or remodeling
Data Analysis
Note: Unless specifically indicated, the 1-week, 4-week, and 8-week FNR subgroups (Fig 3, F) were analyzed with the respective 1-week, 4-week, and 8-week FWR groups (Fig 3, C through E). This is because the 1-week, 4-week, and 8-week FNR animals represented the first (“0”) time point of those respective FWR groups.
Analysis began with evaluation of the descriptive statistics for the degeneration occurrence parameters. Inferential analyses were determined to be appropriate on these parameters if signs of degeneration were found in ≥10% of the VBs, IVDs, Z joints, or Z joint articular surfaces under investigation in any experimental group of animals (ie, 1-week fixation, 4-week fixation, 8-week fixation, Cnull, or Csau). The 10% cutoff was chosen as a very conservative estimate of the amount of degeneration that could possibly be considered to be clinically meaningful. Inferential analysis was performed for a degeneration severity parameter if such analysis was deemed appropriate for the corresponding degeneration occurrence parameter. All inferential analyses were performed using GraphPad Prism version 3.02 for Windows (GraphPad Software, San Diego, Calif USA). The difference from 0 was assessed at the 5% confidence level of significance (P ≤ .05).
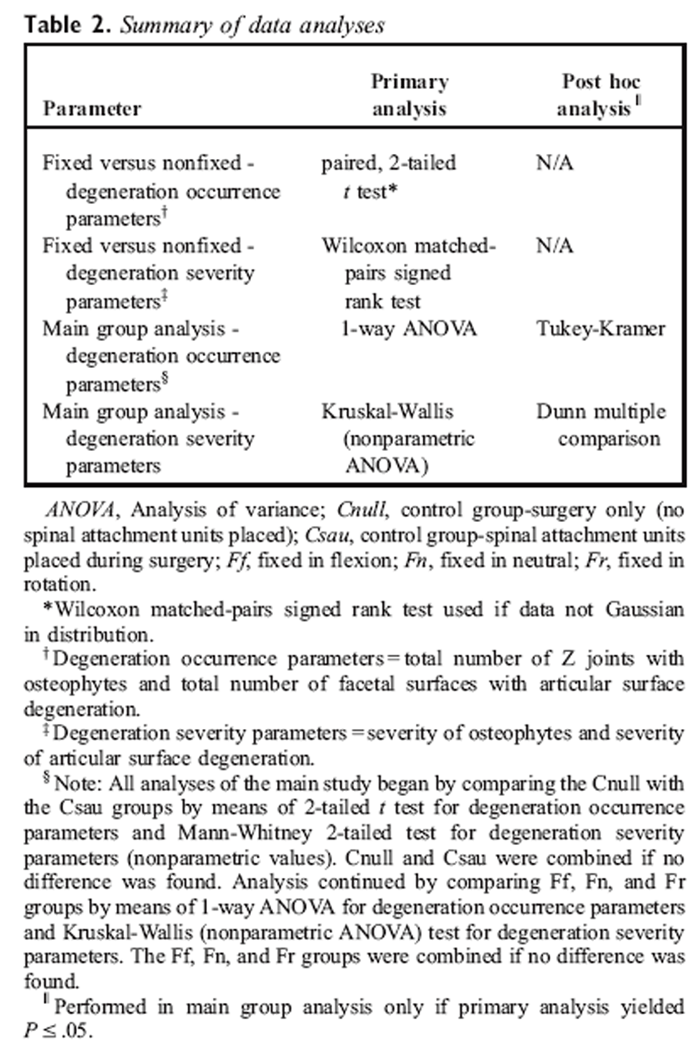
The following sections describe the inferential analyses used in this study. Table 2 summarizes these analyses.
Fixed Segments Versus Nonfixed Segments
Table 2
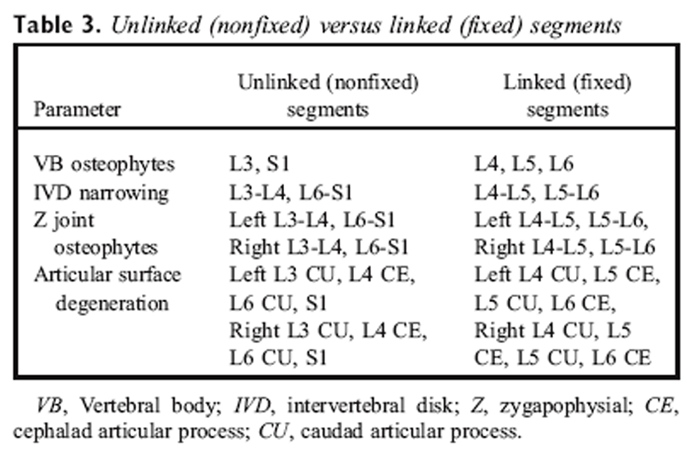
Table 3 When inferential analysis was determined to be appropriate for a given parameter, such analysis began by comparing vertebral segments in the same animal that were directly affected by the fixation units (fixed segments) with those segments not directly affected by the fixation devices (nonfixed segments). Because one purpose of this analysis was to determine if the fixation devices alone had an effect on the outcome variables, values for the 1-week, 4-week, and 8-week fixation animals were pooled, and values for the fixed segments and nonfixed segments were then paired.
A second purpose of the analysis was to determine if either the surgery alone or the placement of the SAUs on the spinous processes had any effect on the outcome variables. Therefore, the 2 different control groups (Cnull and Csau) were evaluated separately, and values for fixed segments and nonfixed segments were separately paired for the Cnull and Csau control groups. The specific segments used for fixed segments versus nonfixed segments for each parameter are shown in Table 3. The data of the fixed segments versus nonfixed segments were truly paired, because the nonfixed segments of each animal were those segments directly cephalad and caudad to the fixed segments of the same animal. Therefore, paired analyses could be performed. The exception to this was VB degeneration in which 3 segments were fixed (L4, L5, L6) and 2 segments were nonfixed (L3, S1). Consequently, paired analyses could not be performed for this parameter.Degeneration occurrence parameters Analyses for fixed segments versus nonfixed segments for each of these parameters were handled in a similar manner. The data from all the fixation animals (1-week fixation, 4-week fixation, 8-week fixation) were pooled. These data from the combined fixation animals (termed combined fixation group) were then separated into paired fixed segments versus nonfixed segments groups. Data for the Cnull and Csau animals were also each separated into comparable fixed segments (segments that would have been fixed had SAUs been implanted and linked) and nonfixed segments (segments that would not have been fixed had SAUs been implanted and linked) groups. Comparisons between data from the fixed segments versus nonfixed segments groups for the combined fixation animals (combined fixation group) and for the Cnull and Csau animals were made using a paired, 2-tailed t test. However, if the data did not pass the Kolmogorov-Smirnov normality test for a Gaussian distribution of the data, then the Wilcoxon matched-pairs signed rank test for nonparametric values was used.
Degeneration severity parameters Analyses for fixed segments versus nonfixed segments for each of these parameters were handled in a similar manner. Again, the data from the combined fixation animals (combined fixation group; 1-week fixation, 4-week fixation, 8-week fixation) and the Cnull and Csau animals were separated into paired fixed segments versus nonfixed segments groups. Because values of these parameters were ordinal in nature (0 to 3 scale), comparisons between fixed segments versus nonfixed segments groups were made using the Wilcoxon matched-pairs signed rank test.
Analyses of 1-Week Fixation, 4-Week Fixation, 8-Week Fixation, and Control Groups (Main Group Analysis)
Because the primary purpose of this project was to determine the effects of hypomobility (fixation) on the tissues of the spine, comparisons among these groups were performed on the fixation segments only (Table 3). When inferential analysis was found to be appropriate (see above), the analysis began with a comparison of the Cnull group with the Csau group. This was done by means of an unpaired, 2-tailed t test for the degeneration occurrence parameters and the Mann-Whitney 2-tailed test for nonparametric values for the severity parameters. If no difference was found between the Cnull and Csau groups, the data for the 2 groups were combined by time point for any further analysis. This increased the number of replicates for each time point. In addition, this procedure helped to clarify any differences among control animals and fixation groups in later analyses.
Next the Ff, Fn, and Fr fixation subgroups were compared for each parameter. This was done by means of an ANOVA for the degeneration occurrence parameters and by means of the Kruskal-Wallis (nonparametric ANOVA) test for the degeneration severity parameters. If no difference was found among the Ff, Fn, and Fr groups for a parameter, then the values were grouped together for each time point for any further analyses. This allowed for more replicates per time point.Degeneration occurrence parameters Differences among the control group(s) and the fixation groups (1-week fixation, 4-week fixation, 8-week fixation) were then evaluated using a 1-way ANOVA. The average and standard deviation of the replicate animals for each time point were used for these analyses. If the ANOVA showed a significant difference (P ≤ .05), the Tukey-Kramer post-test was used to further evaluate differences between individual groups. This post-test describes significance as either not significant or significant at P ≤ .05, P < .01, P < .001, or P < .0001.14
Degeneration severity parameters Because the data of these parameters were ordinal in nature (scale of 0 to 3), the inferential methods differed from those described above. Differences among the control group(s) and the fixation groups were compared by means of the Kruskal-Wallis (nonparametric ANOVA) test. If the Kruskal-Wallis test showed a significant difference among the groups (P ≤ .05), the Dunn multiple comparison post-test was used to evaluate differences between individual groups. This post-test describes significance as either not significant or significant at P ≤ .05, P < .01, P < .001, or P < .0001.14Analyses of Fixation No Release Animals
Recall that the FNR animals (Fig 3, F) underwent fixation for 1, 2, 4, 8, 12, or 16 weeks and were then immediately sacrificed. That is, they were not euthanized after an “unlinked” (nonfixation) period. This was done to permit evaluation of the effects of the fixation devices on several additional time points. Because the values for the 1-week, 4-week, and 8-week FNR animals were used as the first time points (“0” time point) for the corresponding FWR groups (1-week, 4-week, or 8-week fixation), analysis of the FNR animals by means of inferential statistics was determined to be inappropriate (ie, the data from the 1-week, 4-week, and 8-week animals would have been analyzed twice). Therefore, only descriptive statistics on the degeneration occurrence and severity parameters were performed to compare the subgroups of FNR animals.
Results
Figure 3 shows the animals that completed the study. The goal of the study was to have 3 animals in each time point of the fixation groups and 2 animals for each time point in each of the 2 control groups. To accomplish this, additional animals were entered into the study if at any time during the surgery an animal appeared to have difficulty or if during the survival period an animal appeared to be ill. Frequently, the original animal would survive and, as a result, there are 4 animals in the 1-week fixation, 8-week release (extra Ff) and 4-week fixation, 8-week release time periods (extra Ff) and 5 animals in the 8-week fixation, 2-week release time periods (extra Ff and Fr). Having more replicates in these 3 time periods was thought to have a negligible effect on the overall results and, if anything, strengthened the data for these time periods. In 3 instances, animals died prematurely and no replacement was entered into the study.
For this reason, there is only one animal (Ff) in the 8-week fixation, no release (FNR) time period (2 died) and only one animal in the 8-week Cnull time period (1 died). The results of having one animal in these 2 time periods out of the 30 time periods of the study were judged to be negligible. The overall success rates of the surgeries and postsurgical recovery of the animals were high and very similar to those reported in the initial evaluation of the model.10
Table 4
Table 5 Table 4 summarizes the overall results for the VB, IVD, and Z joint degeneration occurrence parameters. Notice that very few degenerative changes were associated with the VBs or IVDs. Because degenerative changes for these parameters were found to be below the 10% cutoff level, inferential analyses were not carried out on these parameters or their corresponding severity parameters.
Fixed Segments Versus Nonfixed Segments
Table 5 summarizes the results of this part of the study. Significant differences were found between fixed segments and nonfixed segments for all of the degeneration occurrence and degeneration severity Z joint parameters for the combined fixation group. No significant differences were found between fixed segments and nonfixed segments in either the Cnull or Csau control groups for any of the degeneration occurrence or degeneration severity Z joint parameters.
Vertebral Body and Intervertebral Disk Degeneration
Degenerative changes of the VBs and IVDs were miniscule (Table 4). In only 3 instances of 390 VBs was degeneration found to reach the severity of a grade of 2 on the 0 to 3 scale. These were the L3 and L6 vertebral bodies of the same 4-week fixation, 8-week release animal and the L6 vertebral body of an 8-week fixation, 2-week release animal. In only one instance of 390 VBs did the severity of degeneration reach a grade of 3. This was the L4 vertebral body in a 1-week fixation, no release animal. None of the IVDs were judged to have degeneration greater than a grade of 1.
Z Joints
Table 6
Table 7
Table 8
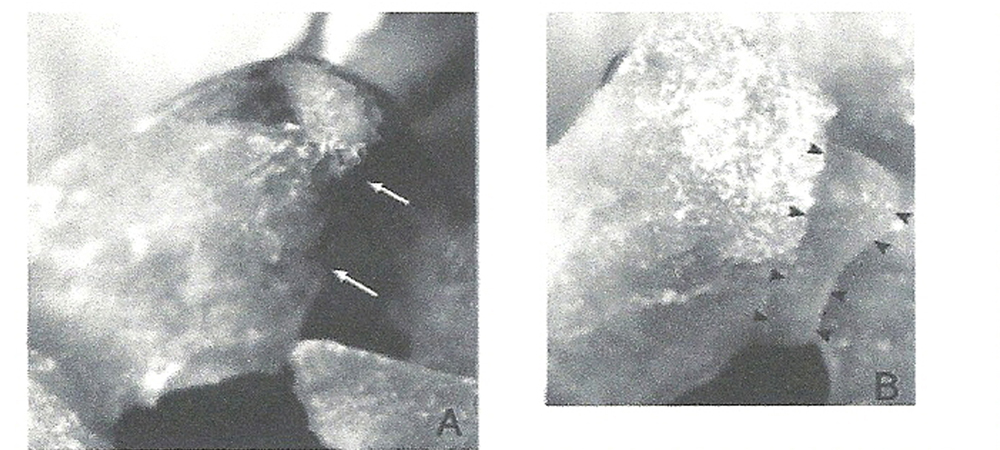
Figure_4
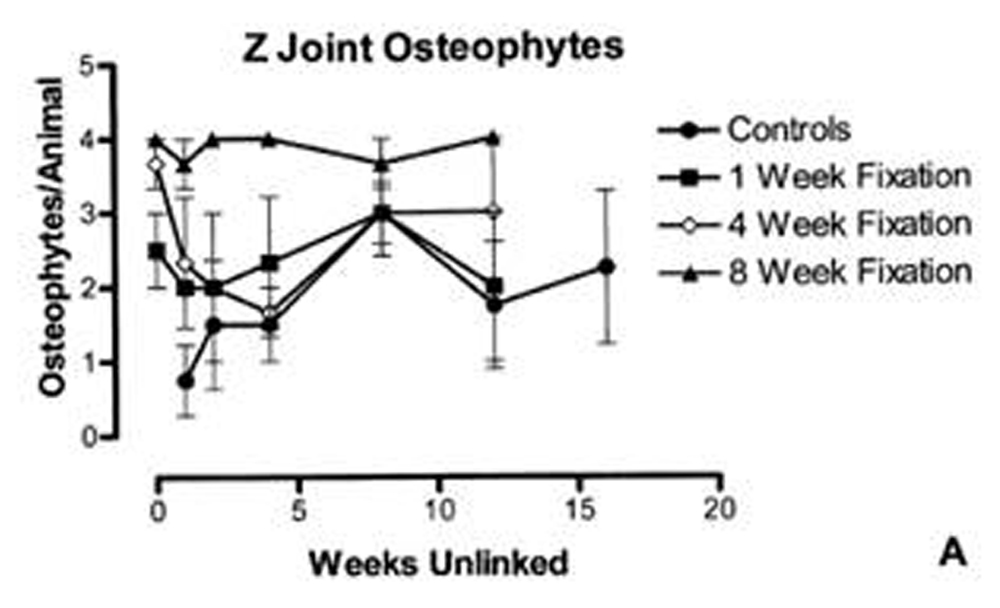
Figure 5
Table 9
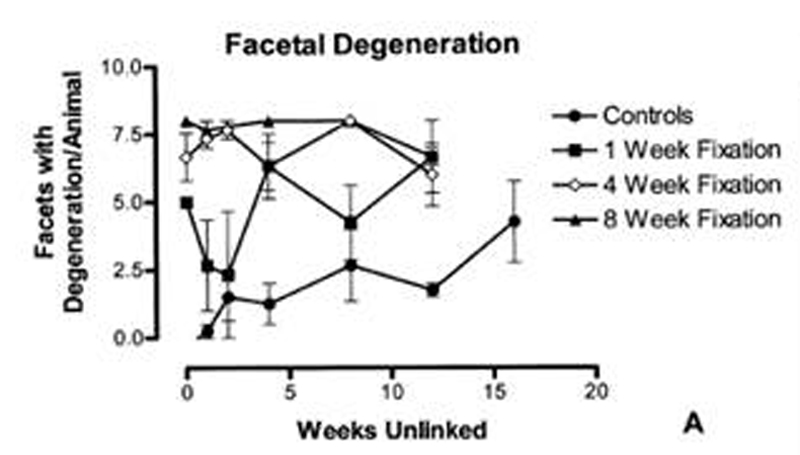
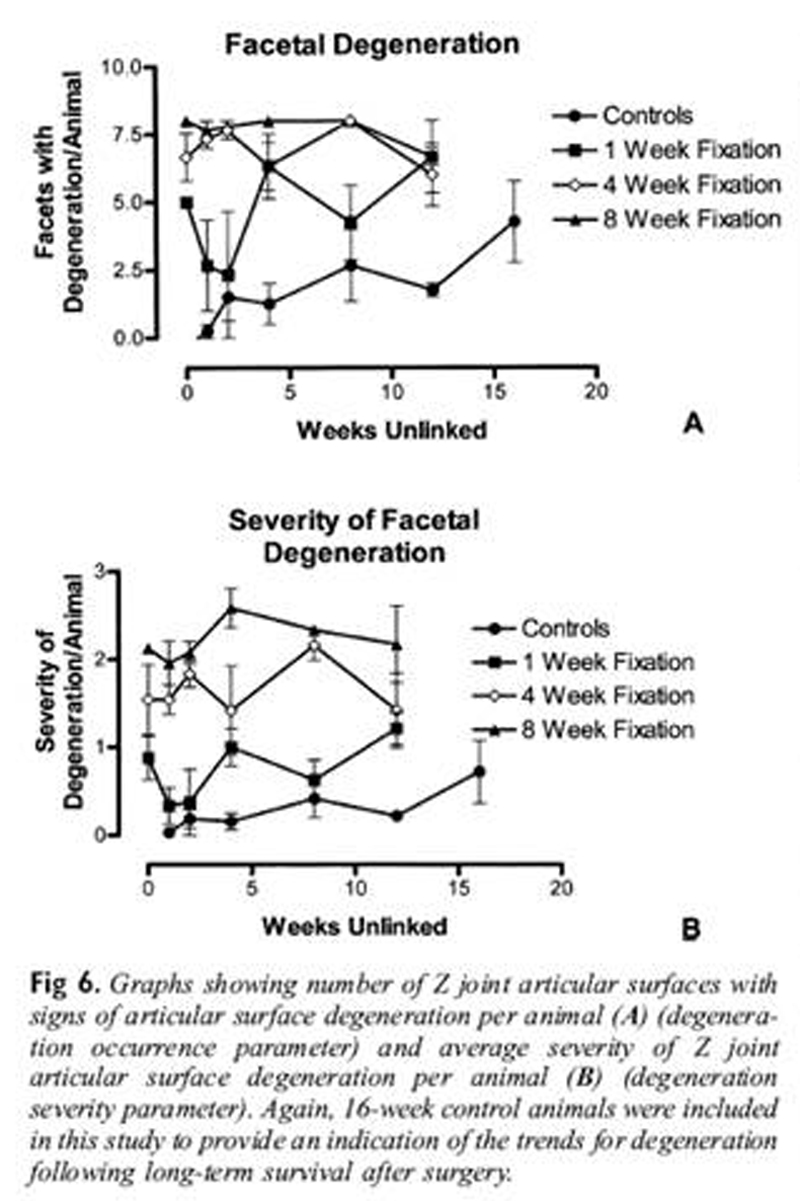
Figure 6
Table 10
Table 11 Table 6 reports within-group comparisons for control and fixation groups. The Cnull and Csau subgroups were compared, and the Ff, Fn, and Fr subgroups were compared for the degeneration occurrence and degeneration severity Z joint parameters. These comparisons were made on “fixed segments” only (see Table 3 for discussion of fixed segments versus nonfixed segments). Notice that there were no significant differences between any of these subgroups. Therefore, the Cnull and Csau and the Ff, Fn, and Fr data for each time point were combined by time point for further analyses.
Number of Osteophytes per Animal
Table 7 and Figure 5, A summarize the results of evaluation for number of fixed Z joints with osteophytes per animal (degeneration occurrence parameter). Recall that for fixed segments, osteophytes were evaluated on the left and right superior (cephalad) articular processes of L4-5 and L5-6 (ie, 2 Z joints on the left and 2 on the right). Therefore, 4 was the maximum possible number of Z Joints with osteophytes per animal for Table 7 and Figure 5, A. Notice the number of osteophytes increased as duration of fixation increased (Fig 5, A and last row of Table 7). A significant difference was found among the groups (Kruskal-Wallis nonparametric ANOVA, non-Gaussian distribution, KW = 25.87, P < .0001). In addition, the 8-week fixation group was found to have significantly more osteophytes per animal than the control (P < .001), 1-week fixation (P < .01), and 4-week fixation (P < .05) groups.
Severity of Osteophytes per Animal
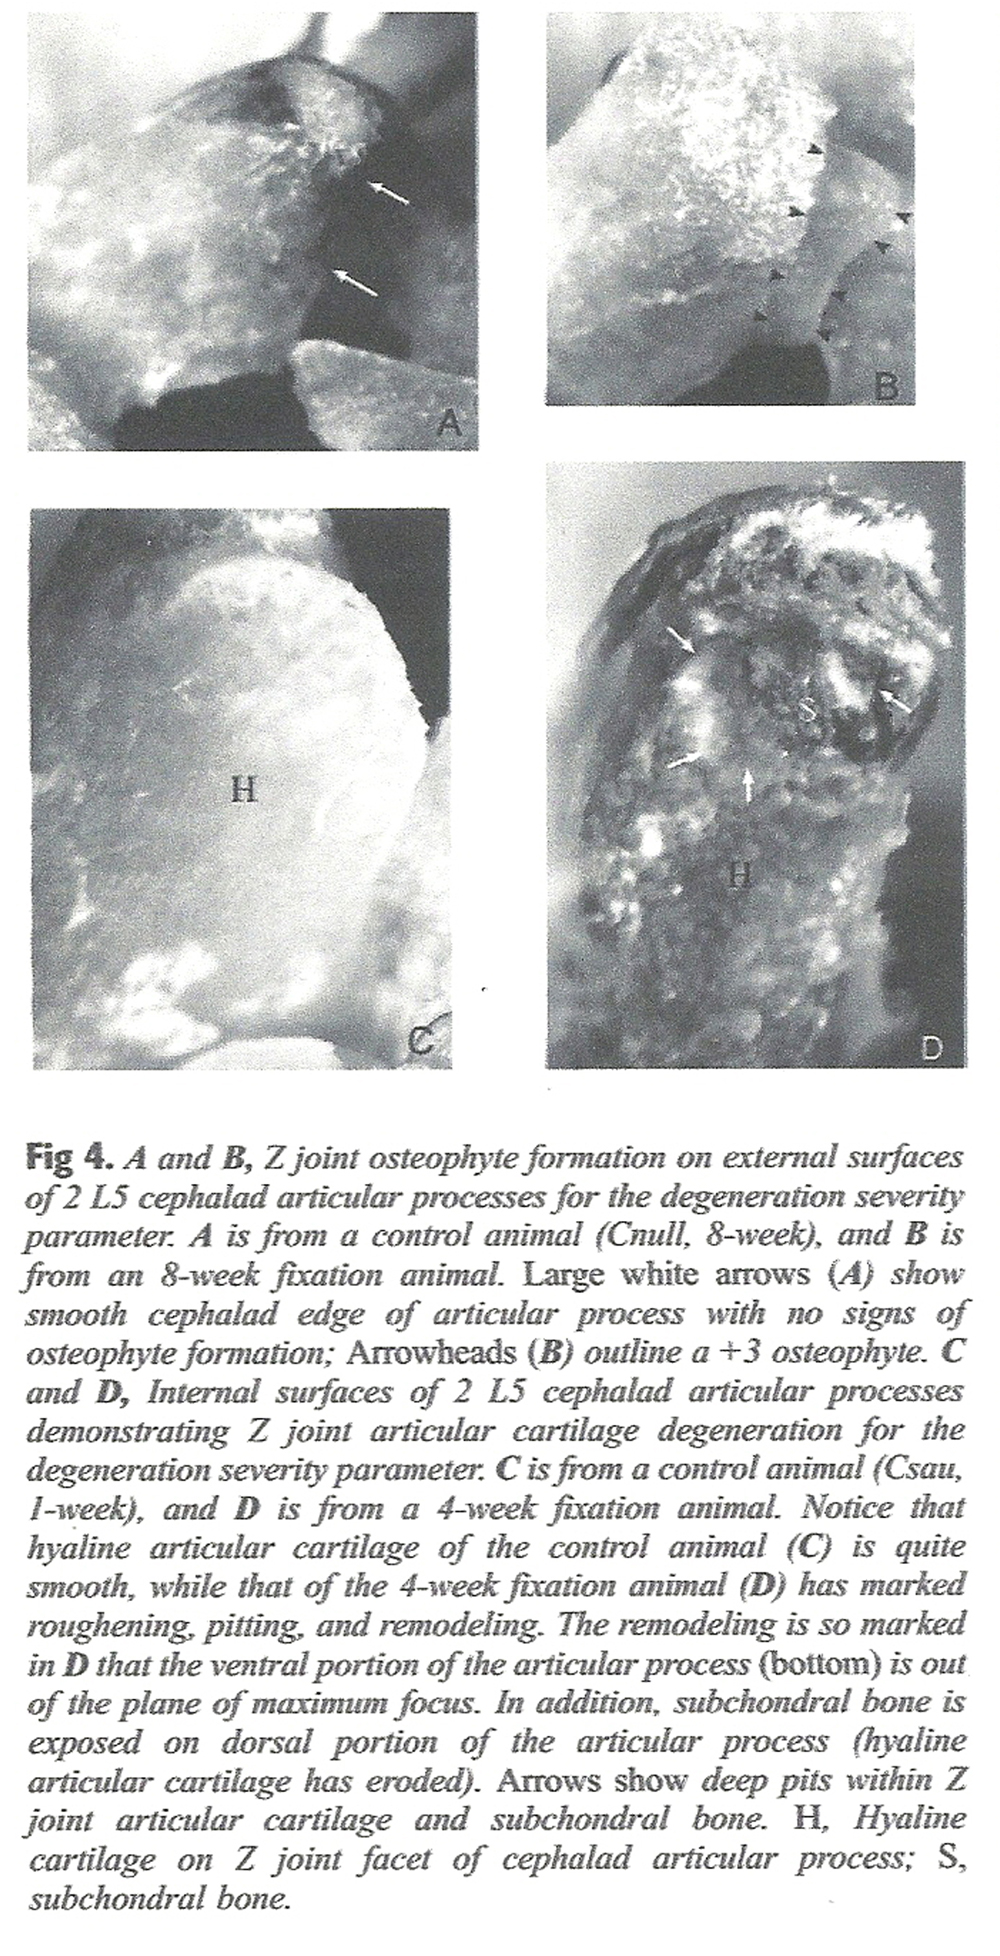
Table 8; Figure 4, A and B; and Figure 5, B summarize the results of average severity of osteophytes per animal (degeneration severity parameter). The severity of the osteophytes was graded on a scale of 0 to 3 with 3 representing the largest osteophytes. There was a significant difference among groups (Kruskal-Wallis nonparametric ANOVA, ordinal data, KW = 29.86, P < .0001). The same relationships found between the 8-week fixation group and the other groups with osteophytes per animal (see above) were also found with this parameter, except the differences between groups, as shown in Table 8, were more marked (8-week versus control groups, P < .001; 8-week versus 1-week, P < .001; 8-week versus 4-week, P < .01).
Number of Articular Facets with Signs of Articular Surface Degeneration
The left and right Z joints of L4-5 and L5-6 (fixed segments) were evaluated. Since there are 2 articular surfaces per Z joint (cephalad and caudal articular processes), the maximum possible number of articular surfaces showing signs of degeneration for fixed segments was 8 (4 Z joints × 2 articular surfaces). Very robust changes were found with this degeneration occurrence parameter (Table 9 and Fig 6, A). Significant differences were found among groups (Kruskal-Wallis nonparametric ANOVA, non-Gaussian distribution, KW = 48.26, P < .0001). In addition, the 4-week and 8-week fixation groups were found to show greater ASD than controls (4-week, P < .001; 8-week, P < .001). Finally, a distinct separation of ASD was found between the 1-week fixation group and both the 4-week (P < .05) and the 8-week (P < .001) groups. However, the 4-week and 8-week groups were not significantly different from one another (P > .05).
Degeneration Severity of Articular Surface Degeneration per Animal
Table 10; Figure 4, C and D; and Figure 6, B summarize the results of average severity of ASD per animal (degeneration severity parameter). The severity of ASD was graded on a scale of 0 to 3 with 3 showing the most severe ASD. Again, significant differences were found among the groups (Kruskal-Wallis nonparametric ANOVA, ordinal data, KW = 55.46, P < .0001), and again, the 4-week and 8-week fixation groups were different than the control group (4-week, P < .001; 8-week, P < .001). The 1-week fixation group showed less ASD than both the 4-week (P < .05) and 8-week (P < .001) fixation groups, but the 4-week and 8-week groups were not different from one another (P > .05).
Fixation No Release Animals
Table 11 summarizes the data for the 1, 2, 4, 8, 12, and 16-week fixation no release animals. As mentioned previously, there was only one 8-week FNR animal. Therefore, the data in the 8-week column of Table 11 must be viewed with this in mind. Notice that the values for all parameters increased as the duration of fixation increased (with 2 exceptions for the 8-week FNR animal).
Discussion
Vertebral Body and Intervertebral Disk Degeneration
The reason for the low incidence of vertebral body (VB) and intervertebral disk (IVD) degeneration may be due to the success of the model in producing hypomobility rather than fusion. The results of biomechanical testing support the hypothesis that hypomobility (rather than fusion or no mobility) is created in this animal model. [11] In addition, when the dissected spines with the linked attachment devices (SAUs) still in place (FNR animals) were moved into flexion or extension by an investigator, slight movement was seen at the Z joints, but more motion was subjectively observed at the VBs and IVDs, which were further from the point of fixation. The vertical bars that were a part of the SAUs were important in the fixation process. These bars extended 12 mm posterior to the spinous processes. The horizontal linking bars used to create fixation were attached to the vertical bars by means of a bolt coursing through a hole in each vertical bar that was approximately 10 mm posterior to the spinous process (2 mm from the distal tip of the vertical bar). Therefore, the VBs and IVDs were a considerable distance from the point of fixation. The extremely low incidence of degenerative changes seen in the VBs and IVDs of this study supports the hypothesis that the fixation model used was truly a model of spinal hypomobility, which is thought to be a much more common clinical presentation than spinal fusion (found only in cases of ankylosis or arthrodesis).
Z Joints
Fixed segments versus nonfixed segments
The marked differences between fixed segments versus nonfixed segments for all Z joint parameters in the combined fixation group provide strong evidence that the fixation devices did produce a difference between the 2 types of segments (fixed versus nonfixed). This is further supported by the findings that for every Z joint parameter, there was no difference between corresponding segments in either the Cnull or Csau control groups. This latter finding indicates that neither the surgery nor the placement of the SAUs on the spinous processes resulted in the changes found in the fixed Z joints. Therefore, the differences found in the fixation groups of this study were most likely due to the linking of the SAUs (and the resultant hypomobility of the Z joints).
Fixation position
There were no differences found among the 3 different fixation configurations (Fn, fixed in neutral; Ff, fixed in flexion; and Fr, fixed in rotation) for any of the parameters of degeneration. This indicates that decreased vertebral motion alone (hypomobility) was more important in the development of degenerative changes than the position in which the vertebrae were fixed during the period of decreased motion.
Osteophytes
The data of Tables 5 and 6; Figure 4, A and B; and the results of the inferential analyses indicate that there was a threshold between 4 and 8 weeks of fixation when the osteophytes became so severe that there was very little return to normal even after a considerable length of time. This also corresponds to a preliminary report of biomechanical data of spine stiffness using this animal model. [11]
Articular Surface Degeneration
With respect to ASD, the data of Tables 7 and 8; Figure 6, A and B; and the results of the inferential analyses indicate that ASD occurred earlier than osteophytic formation, with a threshold of between 1 and 4 weeks of fixation. After this threshold was reached, the ASD became so severe that there was very little return to normal after removal of the linking bars. Therefore, ASD was found to occur first, followed by the development of osteophytes. These findings indicate that fixation resulted in reversible degenerative changes that became progressively more severe (and less apt to reverse) with time. For each type of degenerative change evaluated in this study, there appeared to be a rather distinct time threshold; after this threshold was reached, a decrease in degenerative changes–even after the linking devices were removed from the SAUs–was unlikely. This lack of remission, once a critical time threshold was reached, may be clinically significant and emphasizes the potential importance of maintaining intersegmental motion through the application of spinal manipulative therapy. Further study is needed to determine the effects of spinal manipulative therapy on the time thresholds of degenerative changes and its effectiveness in reducing hypomobility need to be studied in this animal model. Such studies are in progress.
Time Thresholds for Degenerative Changes
Osteophytic formation and ASD were not significantly different in fixation versus control animals before 8 weeks and 4 weeks of fixation, respectively. One reason for the lack of difference between control and fixation groups in these earlier time frames can be attributed to a relative reduction of degenerative findings in the subgroups of animals that had the fixation devices removed for varying periods. This also supports the notion that the degenerative changes were reversible up to a certain time threshold, after which degenerative changes remained relatively constant (ie, were found to remain throughout the 12–week postfixation survival time of this study). Articular surface degeneration changes that showed no signs of reversal occurred between 1 and 4 weeks of fixation (hypomobility); osteophytic changes that showed no signs of reversal occurred between 4 and 8 weeks of fixation in the rat. These findings suggest that inducing motion into hypomobile segments as early as possible and before this threshold is reached may be clinically important. Estimating the human equivalent of the ages of the animals and the time span for the formation of degenerative changes in this study would be purely speculative and could be misleading.
Fixation No Release Animals
A direct relationship was found between duration of fixation and development of degenerative changes in the Z joints in the FNR animals (with 2 exceptions in the single 8–week fixation animal). These results support those presented above. That is, as the time of fixation increased, ASD and osteophytic changes increased.
Future Work
Future work is planned to evaluate the effects of spinal adjusting (mobilization of previously fixed segments) to determine if this changes the time profile found in this study. In addition, further work is being done to evaluate the development of adhesions within the Z joints following fixation (hypomobility). The Z joints of the rat have very large synovial folds that attach to the Z joint capsule. This is similar to the anatomy of human Z joints, which also have prominent synovial folds. [15, 16]. Putative Z joint adhesions would course from the articular cartilage of the cephalad and caudad articular facets to these synovial folds. Because the capsules (and the large synovial folds) were removed in this investigation, Z joint adhesions could not be investigated in this study. Work on the same animal model is currently being conducted in our laboratory to evaluate horizontal sections of the Z joints under light microscopy. Horizontal sections allow the Z joint capsules and synovial folds to remain intact, thus allowing for evaluation of any adhesions attaching the articular cartilage to the synovial folds.
Conclusion
Degenerative changes were found in the Z joints following spinal fixation in this animal model. In addition, degenerative changes of the articular surfaces preceded the slower formation of new bone required for the development of osteophytes. The average severity of the degenerative changes (degeneration severity parameters) supports the findings from the total number of osteophytes per animal and facetal surfaces showing signs of degeneration per animal (degeneration occurrence parameters). These results support the hypothesis that degenerative changes follow hypomobility of the Z joints and are consistent with the theoretical model shown in Figure 1. Future studies are planned to evaluate the effects of spinal adjusting on the time profiles of the degenerative changes found in this study and on the development of adhesions following fixation (hypomobility) of the Z joints.
We conclude that Z joint changes occur following spinal fixation in this rat model, and the amount and severity of degeneration is time–dependent with a threshold of between 4 and 8 weeks for the development of osteophytic changes that showed no signs of reversal and between 1 and 4 weeks for ASD changes of a similar magnitude.
Acknowledgements
We thank Christopher Reinhart, DC, Leah Ustas, BS, Qiang Zhang, MS, MD, DC, Virgil Stoia, DC, and Nathaniel R. Tuck, Jr, DC for their contributions to this work.
References:
Janse, J.
in: Principles and practice of chiropractic: an anthology.
Kjellberg & Sons, Inc, Wheaton (IL); 1976: 55Mooney, V and Robertson, J.
The facet syndrome.
Clin Orthop Res. 1976; 115: 149–156Paris, S.
Anatomy as related to function and pain. Symposium on evaluation and
care of lumbar spine problems.
Orthop Clin North Am. 1983; 14: 476–489Cramer, G, Tuck, NR Jr, Knudsen, JT, Fonda, SD, Schliesser, JS, Fournier, JT et al.
Effects of side posture positioning and side posture adjusting on the lumbar zygapophysial
joints as evaluated by magnetic resonance imaging: a before and after study with randomization.
J Manipulative Physiol Ther. 2000; 23: 380–394Cramer, GD, Gregerson, DM, Knudsen, JT, Hubbard, BB, Ustas, LM, and Cantu, JA.
The effects of side posture positioning and spinal adjusting on the lumbar z joints:
a randomized controlled trial of 64 subjects.
Spine. 2002; 27: 2459–2466Sandoz, R.
Some physical mechanisms and effects of spinal adjustments.
Ann Swiss Chirop Assoc. 1976; 6: 91–141Triano, JJ.
Interaction of spinal biomechanics and physiology.
in: S Haldeman (Ed.) Principles and practice of chiropractic. 2nd ed.
Appleton & Lange, Norwalk (CT); 1992: 225–257(NINCDS monograph No. 15)
in: M Goldstein (Ed.) The research status of spinal manipulative therapy.
US Department of Health, Education, and Welfare, Bethesda (MD); 1975Brennan, PC, Cramer, GD, Kirstukas, SJ, and Cullum, ME.
Basic Science Research in Chiropractic:
The State of the Art and Recommendations for a Research Agenda
J Manipulative Physiol Ther. 1997 (Mar); 20 (3): 150–168Henderson, CNR, Cramer, GD, and Zhang, Q.
Development and Evaluation of a Reversible Small Animal Model of Chiropractic Subluxation
Fifth World Federation of Chiropractic Congress; 1999 May 17-22;
Auckland, New Zealand. World Federation of Chiropratic, Toronto; 1999: 140–141Henderson, CNR, DeVocht, J, Kirstukas, SJ, and Cramer, GD.
in: In vivo biomechanical assessment of a small animal model of the vertebral subluxation.
Proceedings of the 2000 International Conference on Spinal Manipulation;
2000 September 21-23.
FCER, Minneapolis, Minn. Des Moines; 2000: 193–195Cramer, G, Fournier, JT, and Henderson, CNR.
in: Zygapophysial joint changes following spinal fixation.
Proceedings of the 2000 International Conference on Spinal Manipulation;
2000 September 21-23.
FCER, Minneapolis, Minn. Des Moines; 2000: 85–87Ghadially, F.
in: Fine structure of synovial joints.
Butterworth and Company, Philadelphia; 1983: 280Motulsky, HJ.
in: Analyzing data with GraphPad Prism.
GraphPad Software Inc, San Diego; 1999: 1–379Engel, R and Bogduk, N.
The menisci of the lumbar Zygapophysial joints.
J Anat. 1982; 135: 795–809Giles, LGF and Taylor, JR.
Human Zygapophysial joint capsule and synovial fold innervation.
Br J Rheumatol. 1987; 26: 93–98
Return to CHIROPRACTIC AND DJD
Return to ABOUT SPINAL ADJUSTING
Return to SUBLUXATION DEGENERATION
Since 6–17–2004
| Home Page | Visit Our Sponsors | Become a Sponsor |
Please read our DISCLAIMER |